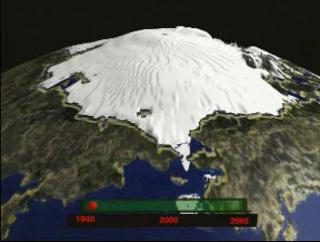
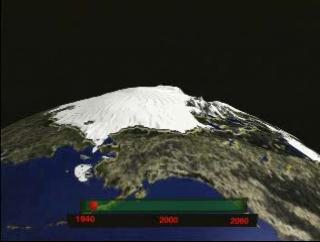
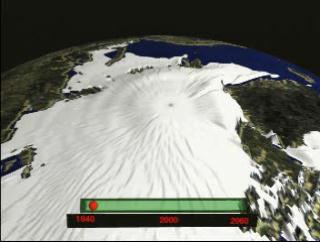
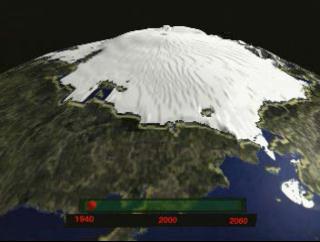
Modeled Arctic Sea Ice Thickness From 1940 Through 2060: View #3
Part of the ongoing research into polar ice trends encompasses evaluation from sophisticated computer models. At the Geophysical Fluid Dynamics Laboratory at Princeton University, run by NASA's sibling agency, NOAA, researchers modeled a 5,000 year period to see how polar ice might behave over time depending on several different variables. This visualization shows a 120-year slice of that complete model, essentially offering a research window on to experimental processes that require longer time frames than human lifetimes. According to the model shown here, projecting a period from 1940 to 2060, there is evidence to suggest human factors have had a measurable effect on Arctic ice decreases.
Arctic Sea Ice Thickness from 1940 through 2060 from the GFDL Coupled Global Climate Model

Video slate image reads, "Oceans and Ice
Viewing modeled polar sea ice density projections
1940-2060".
For More Information
Credits
Please give credit for this item to:
NASA/Goddard Space Flight Center
Scientific Visualization Studio
-
Animator
- Tom Biddlecome (Raytheon)
-
Scientist
- Keith Dixon (NOAA/GFDL)
Release date
This page was originally published on Tuesday, May 30, 2000.
This page was last updated on Wednesday, May 3, 2023 at 1:58 PM EDT.
Series
This page can be found in the following series:Datasets used
-
[GFDL Coupled Global Climate Model]
ID: 390
Note: While we identify the data sets used on this page, we do not store any further details, nor the data sets themselves on our site.
Alternate Versions
- ID: 1075
- ID: 1076
- ID: 1078
- ID: 1079