Fermi's Five-year View of the Gamma-ray Sky
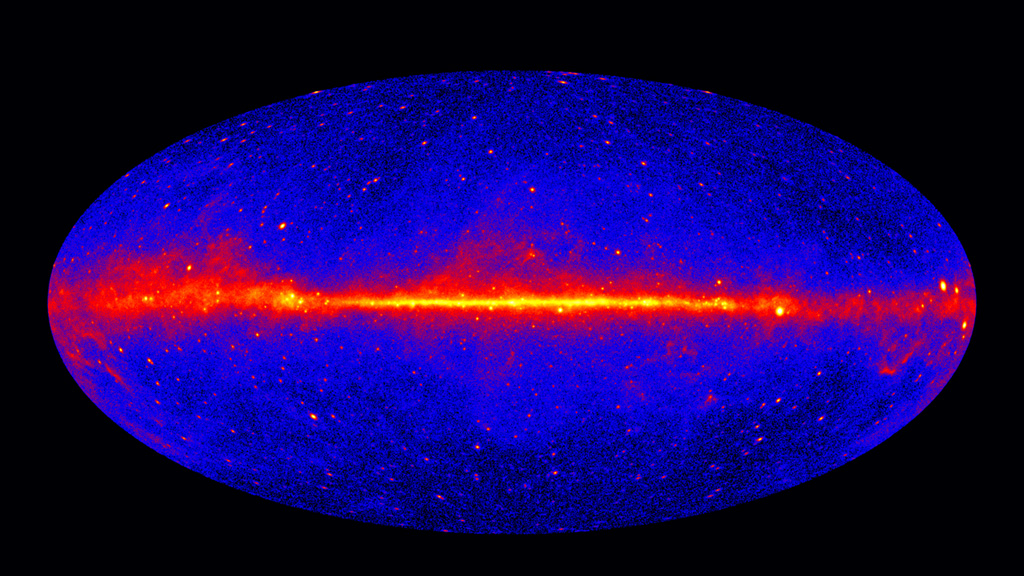
This all-sky view shows how the sky appears at energies greater than 1 billion electron volts (GeV) according to five years of data from NASA's Fermi Gamma-ray Space Telescope. (For comparison, the energy of visible light is between 2 and 3 electron volts.) The image contains 60 months of data from Fermi's Large Area Telescope; for better angular resolution, the map shows only gamma rays converted at the front of the instrument's tracker. Brighter colors indicate brighter gamma-ray sources. The map is shown in galactic coordinates, which places the midplane of our galaxy along the center.
The five-year Fermi map is available in multiple resolutions below, along with additional plots containing reference information and identifying some of the brightest sources.

The Fermi LAT 60-month image, constructed from front-converting gamma rays with energies greater than 1 GeV. The most prominent feature is the bright band of diffuse glow along the map's center, which marks the central plane of our Milky Way galaxy. The gamma rays are mostly produced when energetic particles accelerated in the shock waves of supernova remnants collide with gas atoms and even light between the stars. Hammer projection.
Image credit: NASA/DOE/Fermi LAT Collaboration

The Fermi LAT 60-month image, constructed from front-converting gamma rays with energies greater than 1 GeV. The most prominent feature is the bright band of diffuse glow along the map's center, which marks the central plane of our Milky Way galaxy. The gamma rays are mostly produced when energetic particles accelerated in the shock waves of supernova remnants collide with gas atoms and even light between the stars. Equidistant cylindrical projection.
Image credit: NASA/DOE/Fermi LAT Collaboration

This plot overlays the locations of three reference planes on the Fermi sky map: the celestial equator (the plane of Earth's equator projected onto the sky), the ecliptic (the annual apparent path of the sun around the sky as well as the plane of Earth's orbit), and the galactic equator, which marks the central plane of our Milky Way galaxy.
Image credit: NASA/DOE/Fermi LAT Collaboration

Constellations
This plot overlays the boundaries of traditional constellations on the Fermi sky map. The area of each constellation is labeled with its three-letter abbreviation.
Image credit: NASA/DOE/Fermi LAT Collaboration

Pulsars
This plot identifies selected pulsars detected by Fermi's LAT. A pulsar is a type of rapidly rotating neutron star that emits electromagnetic energy at periodic intervals. A neutron star is the closest thing to a black hole that astronomers can observe directly, crushing half a million times more mass than Earth into a sphere no larger than a city. Its matter is so compressed that even a teaspoonful weighs as much as a mountain. One pulsar shines especially bright for Fermi. Called Vela, it spins 11 times a second and is the brightest persistent source of gamma rays the LAT sees.
Image credit: NASA/DOE/Fermi LAT Collaboration


Active Galaxies
This plot identifies selected active galaxies detected by Fermi's LAT. An active galaxy is one whose central region exhibits strong emissions at many different wavelengths. What powers these emissions is a well-fed black hole millions of times more massive than our sun. Some of the infalling gas becomes diverted into a pair of oppositely directed particle jets streaming outward at nearly the speed of light. Famous members of this class include NGC 1275 (the bright radio source Perseus A); M87, which sports a jet that can be seen in visible light; and Centaurus A (NGC 5128), whose jet has been operating long enough to form two lobes of radio- and gamma-ray-emitting gas, each up to a million light-years long.
Image credit: NASA/DOE/Fermi LAT Collaboration

Blazars
This plot highlights the most extreme type of active galaxy: blazars. They are the most common objects detected by Fermi's LAT, making up 57 percent of the total sources in the second Fermi catalog.. Like all active galaxies, blazars are powered by matter falling toward a central supermassive black hole. Some of the infalling material becomes diverted into oppositely directed particle jets that travel outward near the speed of light. What distinguishes blazars is that the galaxy happens to be oriented so that we're looking directly into the jet, which accounts for their intensity and rapid changes in brightness. Some blazars were originally detected in visible light and mistaken for variable stars. The term blazar was coined in 1978 by combining the name of one of these objects (BL Lacertae) with quasar, a word for another class of active galaxy that exhibits less extreme behavior.
Image credit: NASA/DOE/Fermi LAT Collaboration

Normal galaxies
This plot highlights a selection of bright normal galaxies detected by Fermi's LAT. M31 (the Andromeda galaxy) and the Large and Small Magellanic Clouds, two of the Milky Way's many small satellites, qualify as normal galaxies. Astronomers classify M82 and NGC 253 as "starburst" galaxies because they host an unusually high rate of star formation, as well as explosive stellar deaths (supernovae).
Image credit: NASA/DOE/Fermi LAT Collaboration

Supernova remnants
This plot shows selected supernova remnants detected by Fermi's LAT. A supernova remnant is the expanding shell of debris caused by the explosion of a star, which creates a nebula that radiates gamma rays, radio waves, X-rays, and light for thousands of years. Cassiopeia A and Tycho, with ages less than 500 years, are among the galaxy's youngest and appear only as point sources in the map. Fermi's LAT can make out extended structure in remnants like W44, IC 443 (the Jellyfish Nebula) and the Cygnus Loop, which are more than 5,000 years old.
Image credit: NASA/DOE/Fermi LAT Collaboration

HMBs and globular clusters
This plot shows high-mass binary systems and globular star clusters detected by Fermi's LAT. Few pairings in astronomy are as peculiar as high-mass binaries, where a hot blue-white star many times the sun's mass and temperature is joined by a compact companion no bigger than Earth — and likely much smaller. Depending on the system, this companion may be a burned-out star known as a white dwarf, a city-sized remnant called a neutron star (also known as a pulsar) or, most exotically, a black hole. One of the high-mass binaries plotted here, 1FGL J1018.6-5856, was discovered by the Fermi team.
Globular clusters are dense, roughly spherical groupings of tens of thousands of old stars. Astronomers have identified about 150 globular clusters in our galaxy, and the three plotted here — NGC 6266, Terzan 5, and 47 Tucanae — are bright sources for Fermi's LAT. Their brightness at these energies is likely due to the combined gamma-ray glow of many unresolved millisecond pulsars.
Image credit: NASA/DOE/Fermi LAT Collaboration
Fermi's portrait of the sky at energies beyond 1 GeV has steadily deepened with the accumulation of more data. This animation compares views of a 20-degree-wide region in the constellation Virgo after the LAT's first and fifth year of operations. Many additional strong sources (yellow, red) appear in the latest image. Most are black-hole-powered galaxies called blazars. In both images, the brightest source is the blazar 3C 279. The view is centered at R.A. 13h 00m, Dec. -2d 00m.
Image credit: NASA/DOE/Fermi LAT Collaboration

This image identifies several blazars and one pulsar (PSR J1312+00) in a 20-degree-wide patch in the constellation Virgo. The view is centered at R.A. 13h 00m, Dec. -2d 00m. The LAT image is a five-year exposure of gamma rays with energies greater than 1 billion electron volts (GeV). Brighter colors indicate brighter gamma-ray sources.
Image credit: NASA/DOE/Fermi LAT Collaboration

Fermi LAT one-year exposure of a 20-degree-wide region in the constellation Virgo. Brighter colors indicate brighter gamma-ray sources.
Image credit: NASA/DOE/Fermi LAT Collaboration

Fermi LAT five-year exposure of a 20-degree-wide region in the constellation Virgo. Brighter colors indicate brighter gamma-ray sources.
Image credit: NASA/DOE/Fermi LAT Collaboration
For More Information
Credits
Please give credit for this item to:
NASA's Goddard Space Flight Center. However, individual images should be credited as indicated above.
-
Producer
- Scott Wiessinger (USRA)
-
Science writer
- Francis Reddy (University of Maryland College Park)
-
Visualizer
- Francis Reddy (University of Maryland College Park)
Release date
This page was originally published on Wednesday, August 21, 2013.
This page was last updated on Monday, January 6, 2025 at 1:27 AM EST.
Missions
This page is related to the following missions:Series
This page can be found in the following series:Tapes
The media on this page originally appeared on the following tapes:-
Fermi Five Year Anniversary
(ID: 2013066)
Monday, August 12, 2013 at 4:00AM
Produced by - Robert Crippen (NASA)
Datasets used
-
[Fermi: LAT]
ID: 216Fermi Gamma-ray Large Area Space Telescope (GLAST) Large Area Telescope (LAT)
This dataset can be found at: http://fermi.gsfc.nasa.gov
See all pages that use this dataset -
[Fermi]
ID: 687
Note: While we identify the data sets used on this page, we do not store any further details, nor the data sets themselves on our site.


