El Niño Rainfall and Ocean Temperature Visualizations
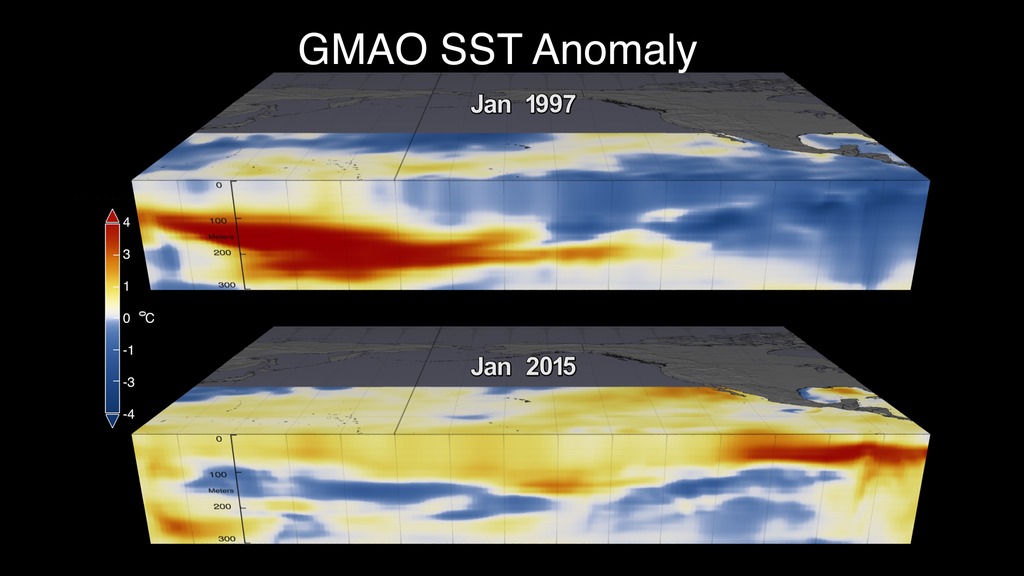
Visualization showing sea surface temperature (SST) anomaly data from Jan. 1, 2015 through Feb. 14, 2016.
Visualization showing sea surface temperature (SST) anomaly data and subsurface temperature anomaly data from Jan. 1, 2015 through Feb. 14, 2016.
Visualization showing sea surface temperature (SST) anomaly data from Jan. 1, 1997 through Feb. 14, 1998.
Visualization showing sea surface temperature (SST) anomaly data and subsurface temperature anomaly data from Jan. 1, 1997 through Feb. 14, 1998.
Visualization showing accumulated rainfall in the U.S. for Dec. 2015, Jan. 2016, and Feb. 1-16, 2016.
Visualization showing accumulated rainfall in California for Dec. 2015, Jan. 2016, and Feb. 1-16, 2016.
Visualization showing accumulated rainfall in the U.S. in December 2015.
Visualization showing accumulated rainfall in the U.S. in December 2015 (with date layer and color bar).
Visualization showing accumulated rainfall in the U.S. in January 2016.
Visualization showing accumulated rainfall in the U.S. in January 2016 (with date layer and color bar).
Visualization showing accumulated rainfall in the U.S. from February 1-16, 2016.
Visualization showing accumulated rainfall in the U.S. from February 1-16, 2016 (with date layer and color bar).
Visualization showing accumulated rainfall in the U.S. West in December 2015.
Visualization showing accumulated rainfall in the U.S. West in December 2015 (with date layer).
Visualization showing accumulated rainfall in the U.S. West in January 2016.
Visualization showing accumulated rainfall in the U.S. West in January 2016 (with date layer).
Visualization showing accumulated rainfall in the U.S. West from February 1-16, 2016.
Visualization showing accumulated rainfall in the U.S. West from February 1-16, 2016 (with date layer).
Date layer for December 2015 for accumulated rainfall visualizations.
Date layer for January 2016 for accumulated rainfall visualizations.
Date layer for February 1-16, 2016 for accumulated rainfall visualizations.

Color bar for accumulated rainfall visualizations.
Visualization showing accumulated rainfall in the U.S. West from Dec. 31, 2015 to Jan. 6, 2016. Video courtesy of Hal Pierce (SSAI/NASA GSFC).
For More Information
Credits
Please give credit for this item to:
NASA's Scientific Visualization Studio
-
Animators
- Horace Mitchell (NASA/GSFC)
- Lori Perkins (NASA/GSFC)
-
Scientist
- George Huffman (NASA/GSFC)
-
Producer
- Kayvon Sharghi (USRA)
-
Writers
- Kate Ramsayer (Telophase)
- Kasha Patel (NASA/GSFC)
Release date
This page was originally published on Thursday, February 25, 2016.
This page was last updated on Wednesday, May 3, 2023 at 1:48 PM EDT.


