Two Decades of Soil Moisture from Space
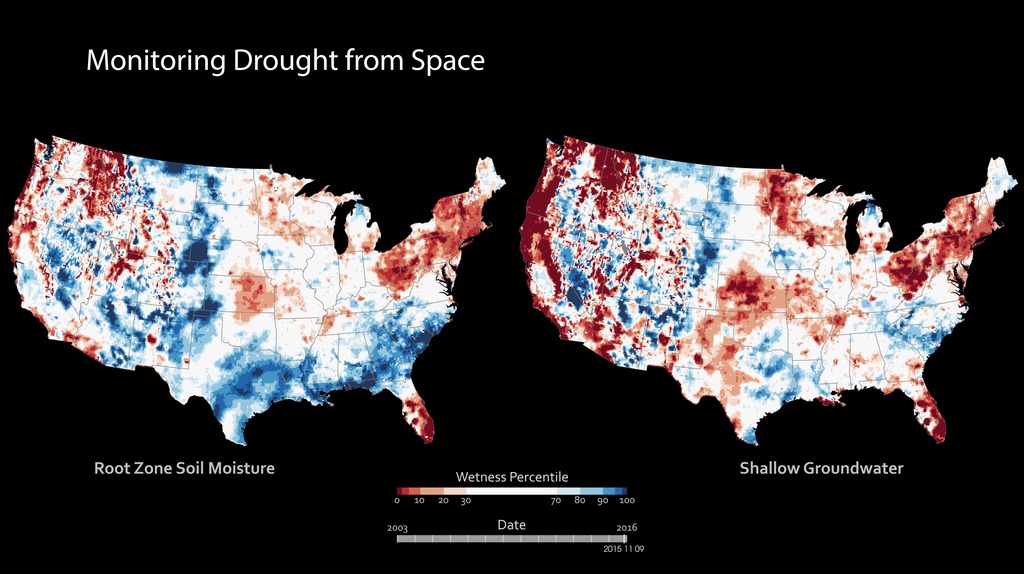
Root zone soil moisture compared to shallow groundwater
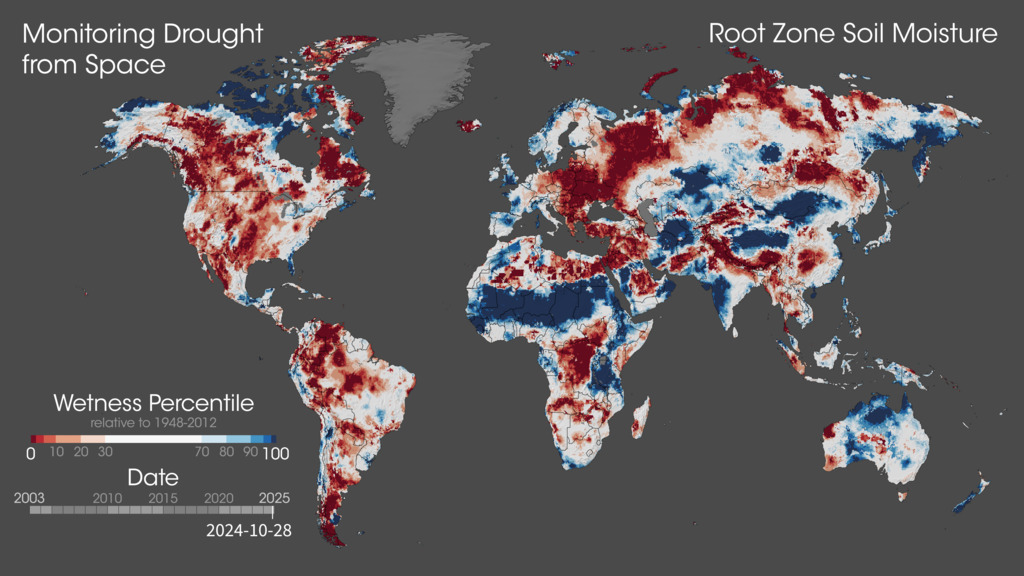
These maps combine data from the Gravity Recovery and Climate Experiment (GRACE) and GRACE Follow-On (GRACE-FO) with other satellite and ground-based measurements to model the relative amount of water stored at three different depths: at the surface, at plant root level and underground. The wetness, or water content, of each layer is compared to the distribution between 1948 and 2014. The darkest red regions represent dry conditions that should occur only 2 percent of the time (about once every 50 years). All of the maps are experimental products developed by scientists at NASA’s Goddard Space Flight Center and the National Drought Mitigation Center. The maps do not attempt to represent human consumption of water; but rather, they show changes in water storage related to weather, climate, and seasonal patterns.
Shallow groundwater
Root zone soil moisture
Surface soil moisture
For More Information
- Agricultural science
- Agriculture
- Climate Indicators
- Droughts
- Earth Science
- Grace
- GRACE-FO
- Ground Water
- HDTV
- Human Dimensions
- Hydrology
- Hydrosphere
- Hyperwall
- Land Surface
- Land Surface/agriculture Indicators
- Natural hazards
- soil moisture
- Soil Moisture/Water Content
- Soils
- Terrestrial Hydrosphere
- Terrestrial Water Storage
Credits
This research was funded by NASA’s Terrestrial Hydrology, GRACE-FO Science Team, and Applied Sciences – Water Resources Programs
Please give credit for this item to:
NASA
-
Scientists
- Matthew Rodell (NASA/GSFC)
- Bailing Li (University of Maryland College Park)
-
Scientific data support
- Hiroko Kato Beaudoing (University of Maryland)
-
Animator
Release date
This page was originally published on Monday, February 10, 2025.
This page was last updated on Monday, March 10, 2025 at 12:02 AM EDT.
Missions
This page is related to the following missions:Related
- ID: 31178
 Hyperwall Visual
Older Versions
- ID: 30730
 Hyperwall Visual