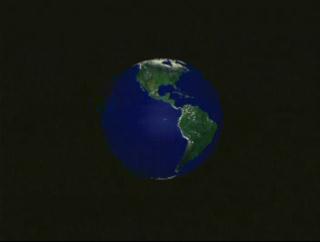
TRMM Rainmap for September 1998: Rotating Globe
A rotating globe showing the monthly average rainmap for September 1998 as measured by TRMM. High rainfall rates are in red.
\".")
Video slate image reads "TRMM Global Rainmap Global September 1998 (Higher ainfall rates are in red)".
Credits
Please give credit for this item to:
NASA/Goddard Space Flight Center
Scientific Visualization Studio
-
Animator
- Greg Shirah (NASA/GSFC)
-
Scientist
- Chris Kummerow (NASA/GSFC)
Release date
This page was originally published on Monday, December 7, 1998.
This page was last updated on Wednesday, May 3, 2023 at 1:59 PM EDT.
Missions
This page is related to the following missions:Series
This page can be found in the following series:Datasets used
-
Monthly Average Precipitation [TRMM: PR and TMI]
ID: 516This dataset can be found at: http://disc.sci.gsfc.nasa.gov/data/datapool/TRMM/01_Data_Products/index.html
See all pages that use this dataset
Note: While we identify the data sets used on this page, we do not store any further details, nor the data sets themselves on our site.
Alternate Versions
- ID: 315
 Visualization