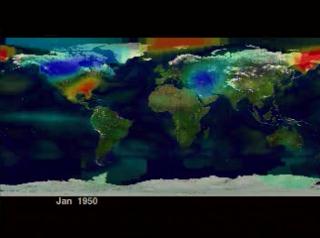
Seasonal Global Surface Temperature Anomaly: January 1950 through October 1998 (Fast)
Global surface temperatures in 1998 set a new record for the period of instrumental measurements, report researchers at the NASA Goddard Institute for Space Studies who analyze data collected from several thousand meteorological stations around the world. This visualization shows surface temperature anomalies from 1950 through November, 1998. The 1998 warmth was associated partly with a strong El Niño that warmed the air over the eastern tropical Pacific Ocean in the first half of the year and in turn affected weather around the world. Red and yellow colors indicate warmer than normal conditions and blue colors indicates cooler than normal conditions.
Seasonal global temperature anomalies from January 1950 through October 1998

Video slate image reads "Surface Temperature Anomaly
Global
Seasonal - fast
Jan. 1950 - Oct. 1998".
Credits
Please give credit for this item to:
NASA/Goddard Space Flight Center
Scientific Visualization Studio
-
Animator
- Jesse Allen (Raytheon)
-
Scientist
- James Hansen (NASA/GSFC GISS)
Release date
This page was originally published on Sunday, November 1, 1998.
This page was last updated on Wednesday, May 3, 2023 at 1:59 PM EDT.
Series
This page can be found in the following series:Datasets used
-
Surface Temperature Anomalies (Seasonal Global Surface Temperature Anomalies)
ID: 634Meterological stations, ship, and satellite measurements of sea surface temperature
This dataset can be found at: http://data.giss.nasa.gov/gistemp/2005
See all pages that use this dataset
Note: While we identify the data sets used on this page, we do not store any further details, nor the data sets themselves on our site.
Alternate Versions
- ID: 391