July mean Sargassum in the Atlantic: 2010 - 2023
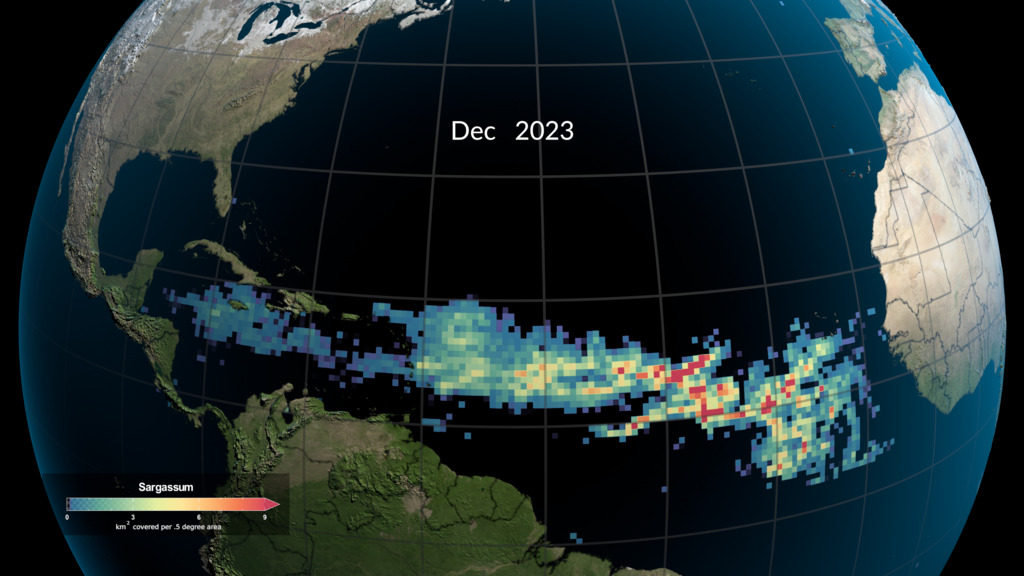
This visualization shows the July mean Sargassum observed in the Atlantic Ocean by the MODIS instruments on NASA's TERRA and AQUA satellites from 2010 to 2023. Each square box of color represents an area 0.5 x 0.5 degrees, roughly 3025 square kilometers in size. The color represents the mean amount of Sargassum observed in that box during the month of July. Blue shades indicate that this area had on average less than 3 square kilomenters of Sargassum, while red indicates that the region had an average of 9 square kilometers or more.
The islands in the Caribbean have long been known for their crystal clear water and white sand beaches. But in the spring of 2011, something unusual occurred. Thousands of tons of brown alga, known as Sargassum, started washing up on beaches around the Caribbean. Sargassum has historically been found primarily in the Gulf of Mexico and in the North Atlantic Ocean bound by a spiral of currents including the Gulf Stream, North Atlantic Current, the Canary Current and the North Atlantic Equatorial Current.
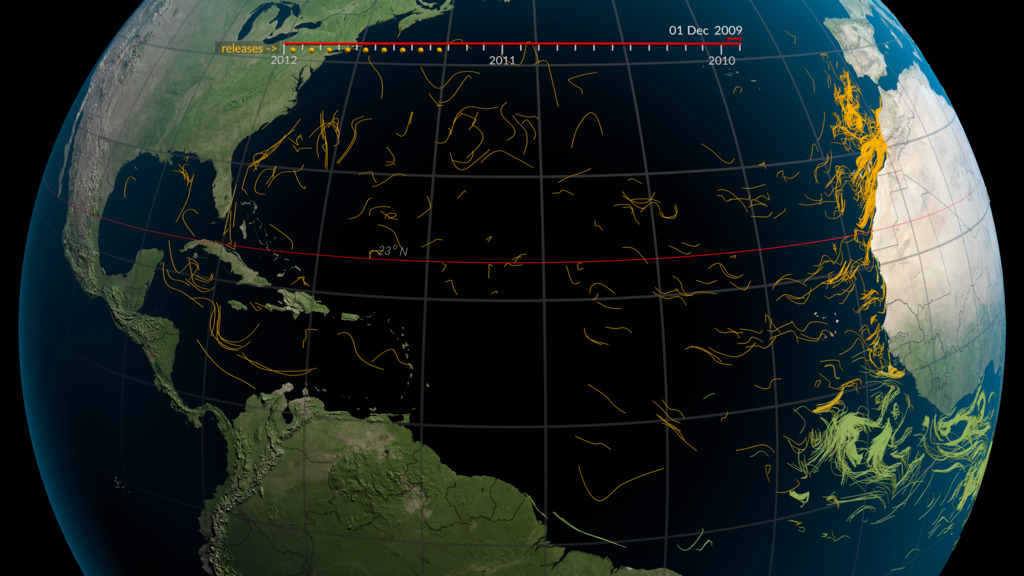
After extensive analysis, researchers found that in the winter of 2009 – 2010 unusually strong westerly winds in the Atlantic Ocean caused some of the floating Sargassum to be pushed from the middle Atlantic Ocean towards Gibraltar where currents eventually carried it south down the coast of Africa and back across the Atlantic Ocean towards the Caribbean. With the exception of 2013, the Sargassum has continued to wash up on Caribbean beaches each year since 2011. The Sargassum has flourished in the warm equatorial waters, being nourished by the dust from Africa and upwelling as well as with the nutrient-rich discharge from the Amazon and Orinoco rivers in South America.
This visualization shows the July mean Sargassum observed in the Atlantic Ocean by the MODIS instruments on NASA's TERRA and AQUA satellites from 2010 to 2023. Each square box of color represents an area 0.5 x 0.5 degrees, roughly 3025 square kilometers in size. The color represents the mean amount of Sargassum observed in that box during the month of July. Blue shades indicate that this area had on average less than 3 square kilomenters of Sargassum, while red indicates that the region had an average of 9 square kilometers or more.
This visualization shows the July mean Sargassum observed in the Atlantic Ocean by the MODIS instruments on NASA's TERRA and AQUA satellites from 2010 to 2023 without the colorbar and date. Each square box of color represents an area 0.5 x 0.5 degrees, roughly 3025 square kilometers in size. The color represents the mean amount of Sargassum observed in that box during the month of July. Blue shades indicate that this area had on average less than 3 square kilomenters of Sargassum, while red indicates that the region had an average of 9 square kilometers or more.

The colorbar and date overlay with transparency
Credits
Please give credit for this item to:
NASA's Scientific Visualization Studio
-
Visualizers
- Cindy Starr (Global Science and Technology, Inc.)
- Greg Shirah (NASA/GSFC)
- Kel Elkins (USRA)
-
Scientists
- Roy Armstrong (University of Puerto Rico)
- Brian Barnes (University of South Florida (USF))
-
Producers
- Katie Jepson (eMITS)
- Jefferson Beck (eMITS)
-
Technical support
- Laurence Schuler (ADNET Systems, Inc.)
- Ian Jones (ADNET Systems, Inc.)
Release date
This page was originally published on Monday, September 30, 2024.
This page was last updated on Wednesday, May 29, 2024 at 11:49 AM EDT.
Related papers
Datasets used
-
July mean Sargassum Density (July mean Sargassum Density in the Atlantic Ocean) [Aqua and Terra: MODIS]
ID: 1211This data shows the percent covered by Sargassum for each 0.5 x 0.5 degree area
Credit: Data courtesy of Brian Barnes at the University of South Florida (USF), Optical Oceanography Lab and Wang, M., et al. (2019).
See all pages that use this dataset
Note: While we identify the data sets used on this page, we do not store any further details, nor the data sets themselves on our site.


