1999 Hurricane Season
Visuals
Satellite Imagery of Hurricane Dennis (WMS)
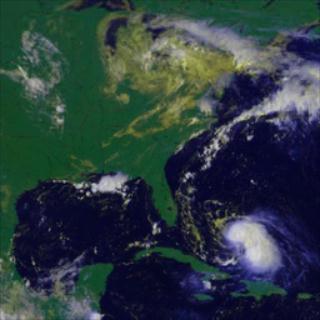
Go to this pageHurricane Dennis started as a tropical depression on August 23, 1999, became a tropical storm on August 24, and was classified as a hurricane early on August 26, near the Bahamas. From August 26 through August 31, Dennis proceeded up the coast of the United States until it stalled off the coast of North Carolina for four days because the pressure trough that was pushing it out to sea left it behind. This animation shows images of Dennis during its hurricane period from August 26 through August 31, 1999, when the stall began. The images were taken by the GOES-8 satellite, a weather satellite in geostationary orbit above the western hemisphere. The continuous white cloud progression came from infrared images from GOES, and the yellowish clouds that come and go with the daylight came from data taken in the visible spectrum, also from GOES. The GOES images were not taken at regular times, so the hurricane appears to slow down when the time between images gets small and speed up when the time between images gets large. ||
Hurricane Floyd: September 13, 1999
Go to this pageTRMM's view of Hurricane Floyd in 1999. Isosurfaces are: Yellow=0.5 inches/hour, Green=1.0 inches/hour, Red=2.0 inches/hour on rainfall rates. The vertical scale is exaggerated. ||
TRMM: Covering Hurricane Floyd over North Carolina Using Monthly Average Rainfall Measurements
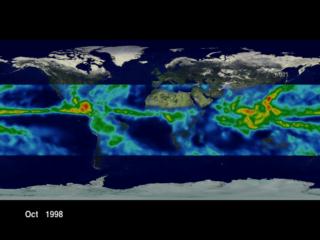
Go to this pageMonthly average rainfall measurements covering the East Coast (especially North Carolina) during Hurricane Floyd, from October 1998 through September 1999. ||
TRMM: Covers Hurricane Floyd over North Carolina Using Daily Rainfall Measurements
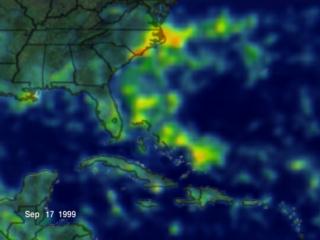
Go to this pageTRMM daily rainfall measurements over the east coast (i.e., North Carolina) during Hurricane Floyd from 2/19/99 through 9/17/99. Red indicates areas of high rainfall. Blue indicates areas of low rainfall. North Carolina experienced major flooding during this time period. ||
Hurricane Bonnie (1998) 'Crystal Cathedral' View of Precipitation with TRMM Data
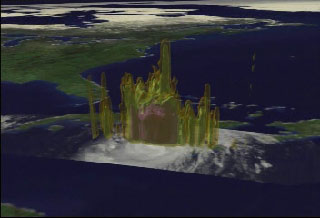
Go to this pageThis animation is an early experiment in using transparency for representing precipitation isosurfaces with TRMM data. ||


