2005 Hurricane Season
Overview
Visualizations on hurricanes and tropical storms from the 2005 hurricane season.
Multi-Hurricane Visualizations
27 Storms: Arlene to Zeta
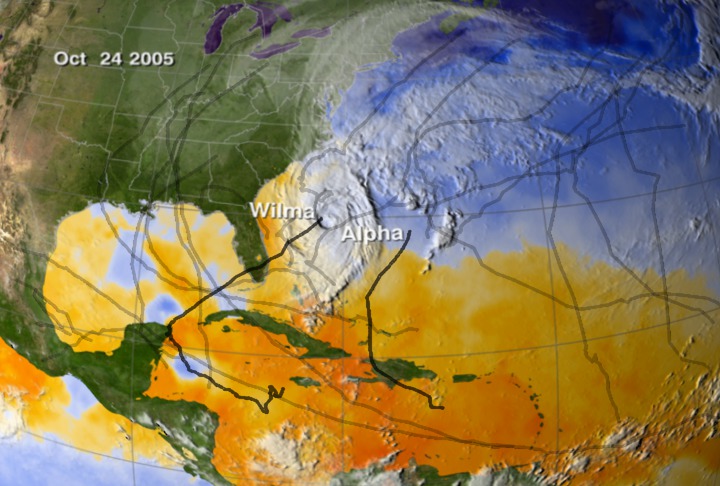
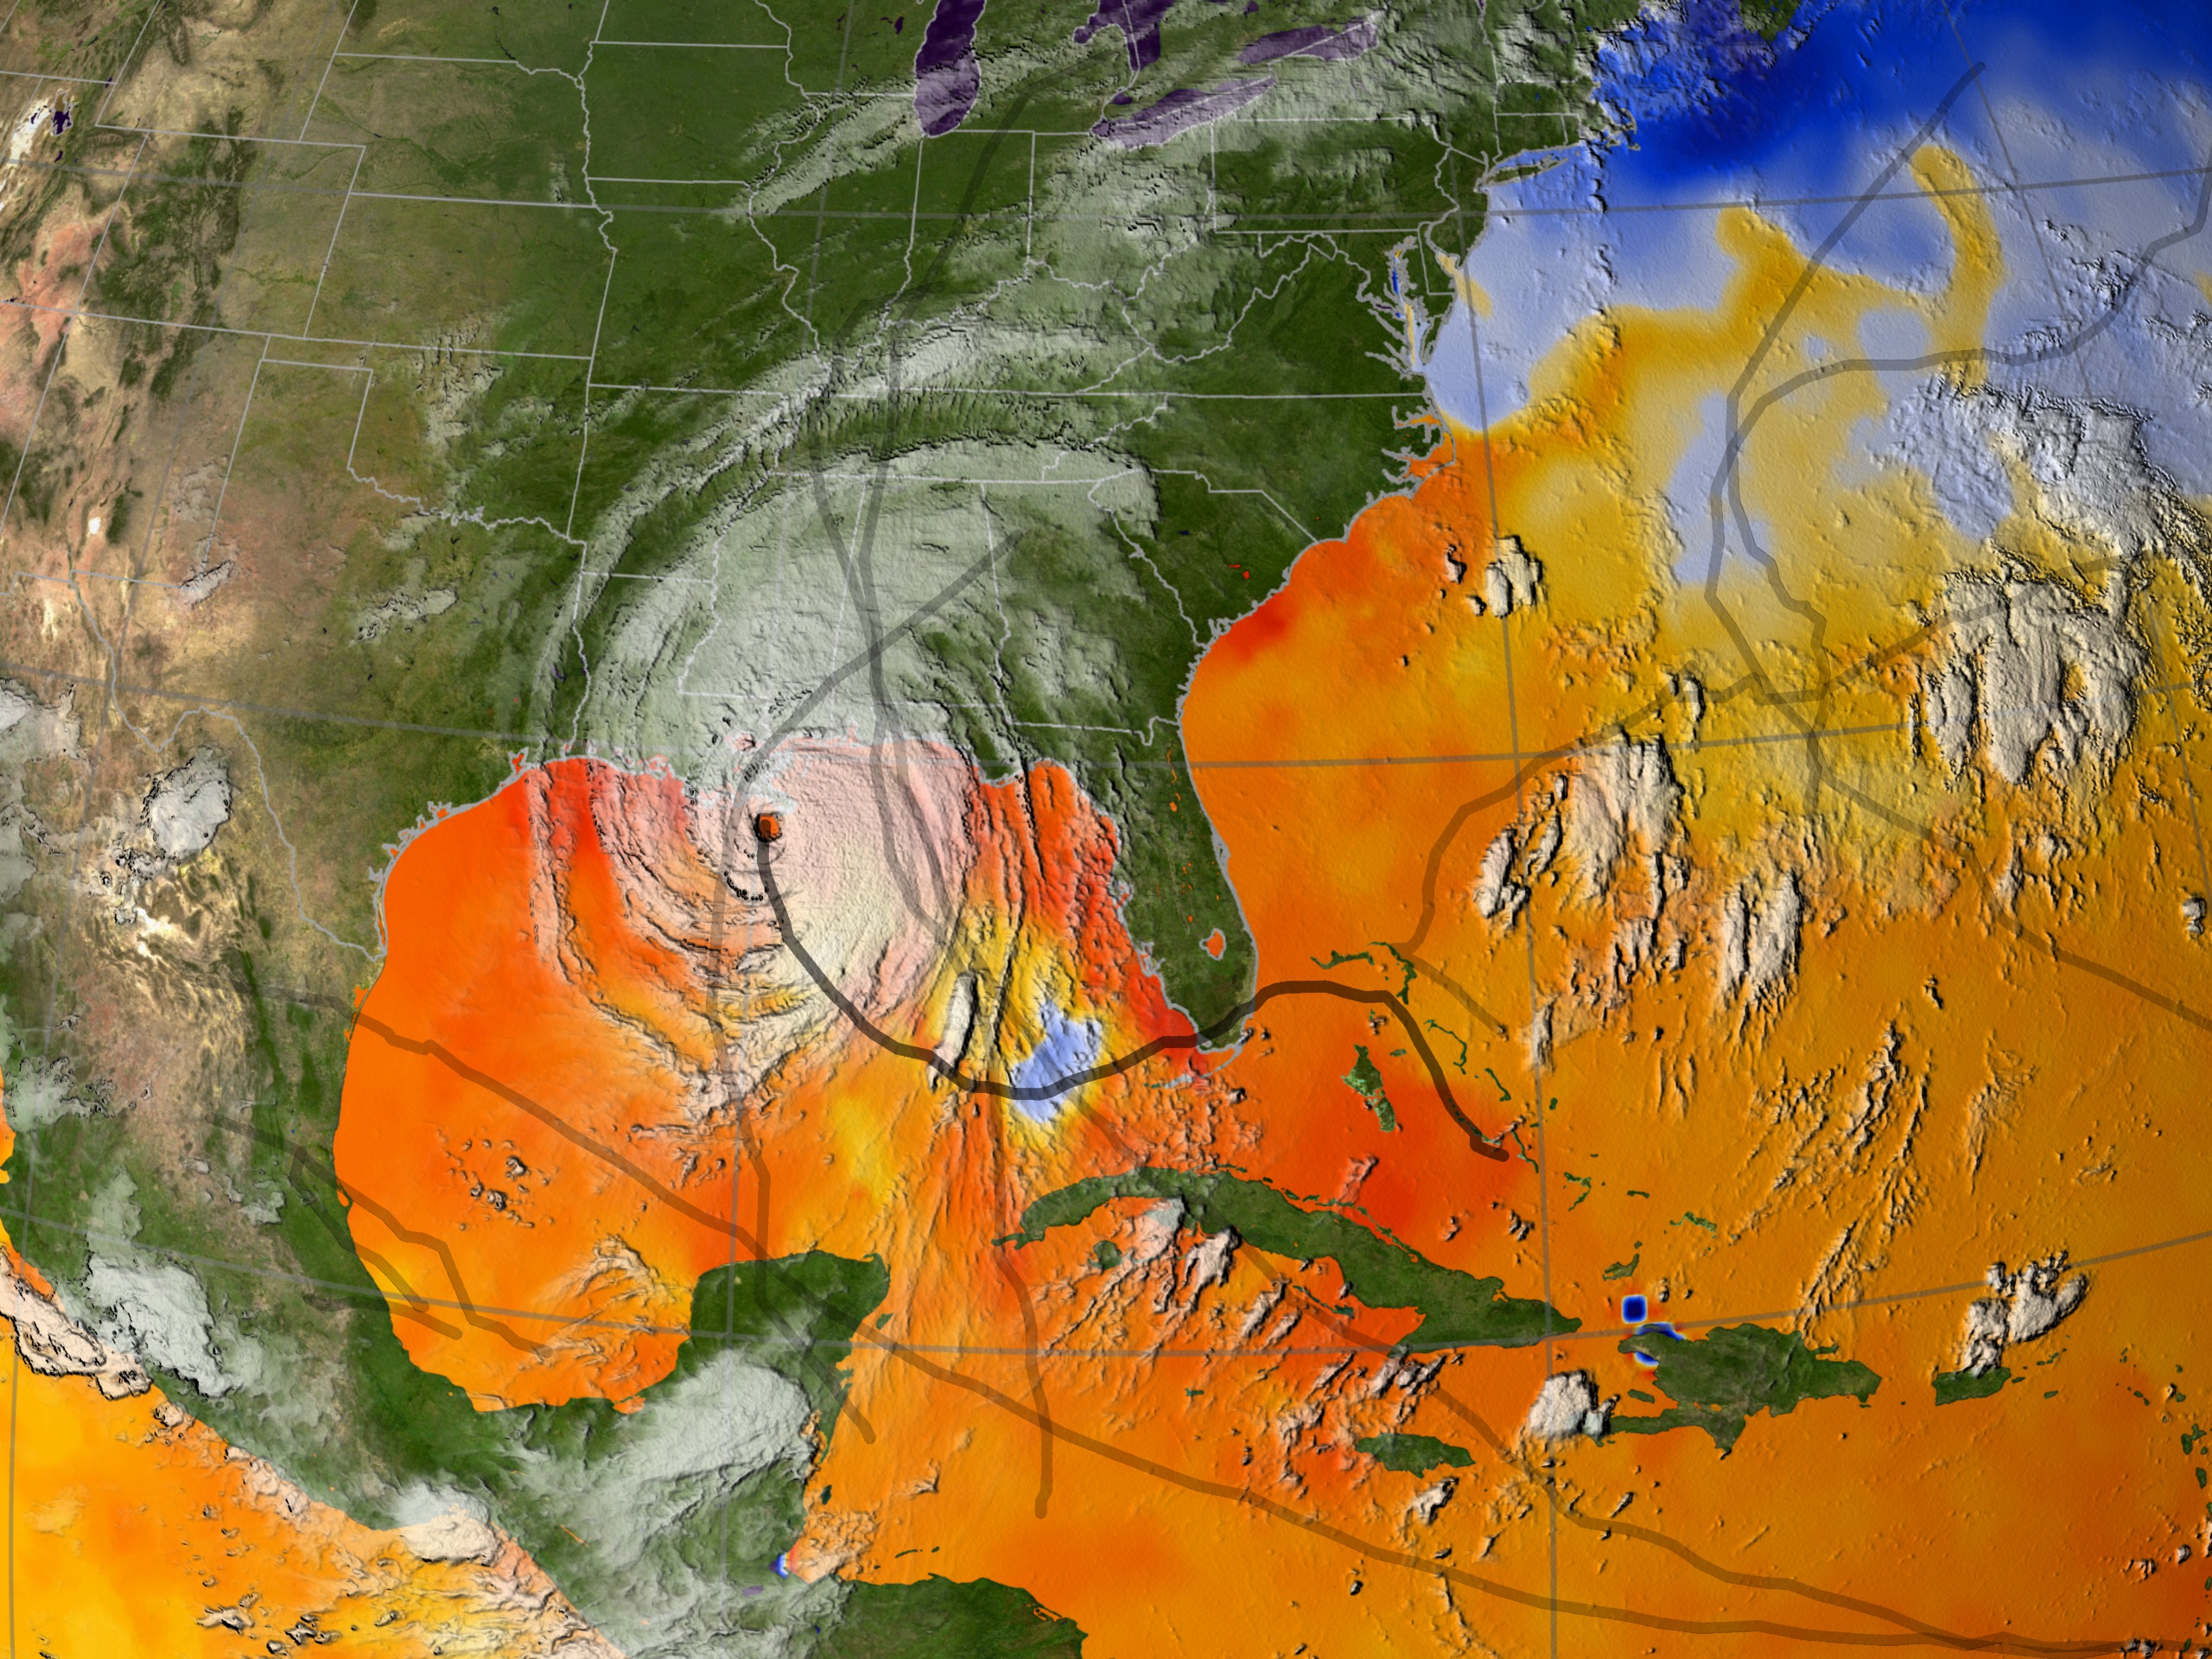
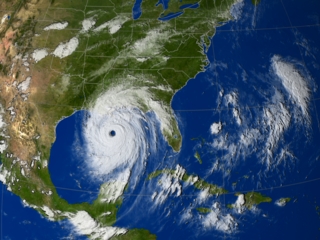
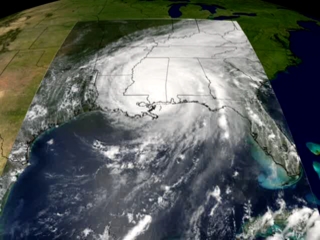
Go to this pageMany records were broken during the 2005 Atlantic hurricane season including the most hurricanes ever, the most category 5 hurricanes, and the most intense hurricane ever recorded in the Atlantic as measured by atmospheric pressure. This visualization shows all 27 named storms that formed in the 2005 Atlantic hurricane season and examines some of the conditions that made hurricane formation so favorable.The animation begins by showing the regions of warm water that are favorable for storm development advancing northward through the peak of hurricane season and then receding as the waters cool. The thermal energy in these warm waters powers the hurricanes. Strong shearing winds in the troposphere can disrupt developing young storms, but measurements indicate that there was very little shearing wind activity in 2005 to impede storm formation.Sea surface temperatures, clouds, storm tracks, and hurricane category labels are shown as the hurricane season progresses.This visualization shows some of the actual data that NASA and NOAA satellites measured in 2005 — data used to predict the paths and intensities of hurricanes. Satellite data play a vital role in helping us understand the land, ocean, and atmosphere systems that have such dramatic effects on our lives.NOTE: This animation shows the named storms from the 2005 hurricane season. During a re-analysis of 2005, NOAA's Tropical Prediction Center/National Hurricane Center determined that a short-lived subtropcial storm developed near the Azores Islands in late September, increasing the 2005 tropical storm count from 27 to 28. This storm was not named and is not shown in this animation.'27 Storms: Arlene to Zeta' played in the SIGGRAPH 2007 Computer Animation Festival in August 2007. It was also a finalist in the 2006 NSF Science and Engineering Visualization Challenge. ||
2005 Hurricanes: Clouds and Sea Surface Temperature
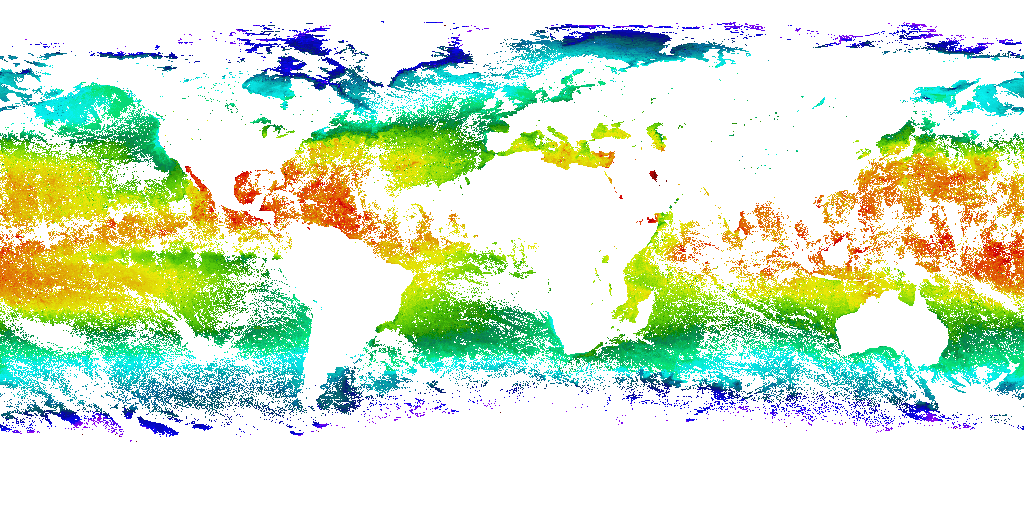
Go to this pageThis visualization shows sea surface temperatures during most of the 2005 hurricane season. Overlaid are infrared cloud data, storm track data, and storm name labels. Warm ocean waters provide the heat energy that fuels hurricanes. Notice the correspondence between the storm tracks and the sea surface temperature response; this is particulary noticeable for hurricanes Dennis, Emily, and Katrina, where the hurricanes churn up the ocean so that cooler water rises to the surface. This version shows the entire Atlantic hurricane region and depicts all of the 2005 hurricanes except Zeta, which appeared at the very end of the year. ||
Named Storms from the 2005 Atlantic Hurricane Season (Wide Shot)
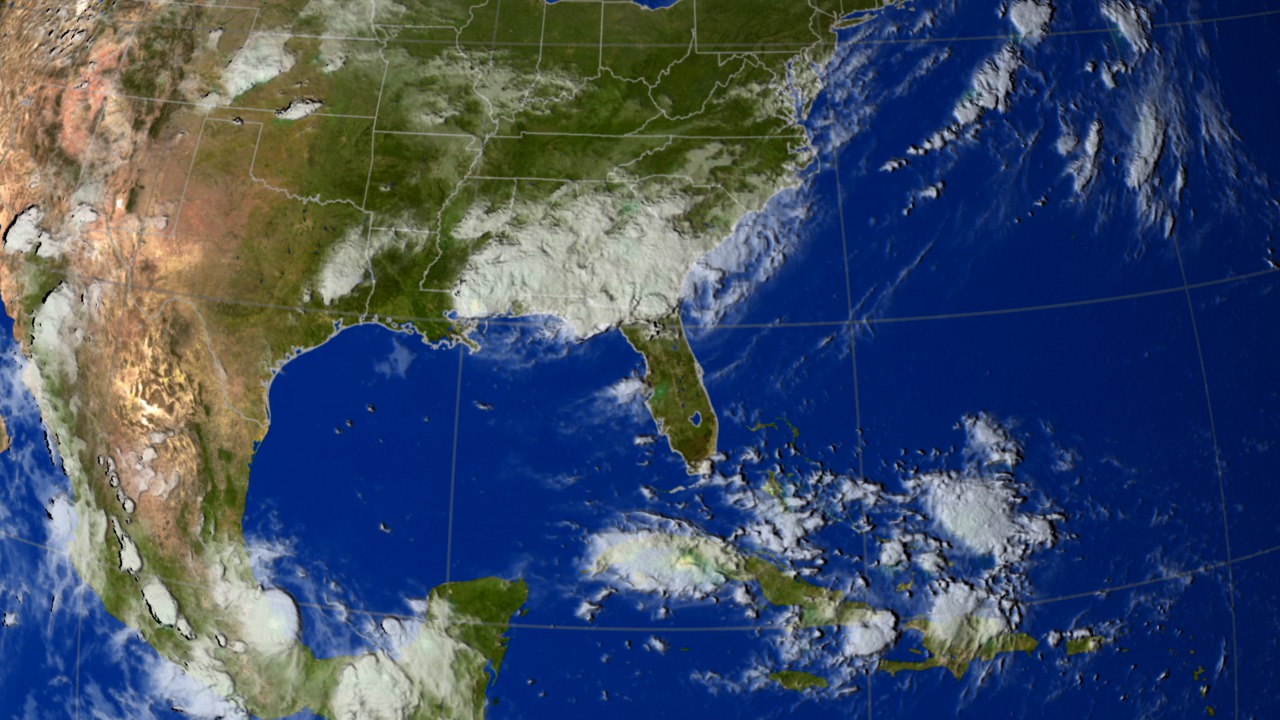
Go to this pageAn updated version of this visualization is available. Please see animation identification number 3354.This visualization shows sea surface temperatures during most of the 2005 hurricane season. Overlaid are infrared cloud data, storm track data, and storm name labels. Ocean temperatures are the fuel that drive hurricanes. Notice the correspondence between the storm tracks and the sea surface temperature response; this is particulary noticeable for hurricanes Dennis, Emily, and Katrina. This versions shows a wide view of the Gulf of Mexico and Western Atlantic Ocean.This visualization includes all of the named storms from Arlene though Wilma; however, Vince is not within the camera's view since it was in the Portugal/Spain region. Wilma tied the record for the most named Atlantic tropical storms in recorded history; and, the list of seleced names for this season is exhausted. Other storms that have formed after Wilma, have been named after the Greek alphabet. ||
Sea Surface Temperature from June 1, 2005 to September 18, 2005
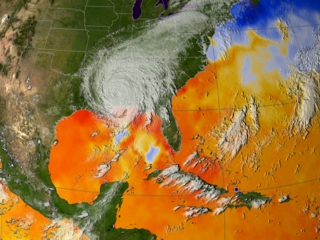
Go to this pageThis visualization shows the sea surface temperatures for the 2005 Atlantic hurricane season from June 1, 2005 through September 18, 2005. The ocean colors represent the sea surface temperatures. Orange and red depict regions that are 82 degrees F and higher, where the ocean is warm enough for hurricanes to form. Hurricane winds are sustained by the heat energy of the ocean, so the ocean is cooled as the hurricane passes and the energy is extracted to power the winds. The sea surface temperatures were measured by the AMSR-E instrument on the Aqua satellite. Several hurricane color water trails can be seen through this animation - particulary hurricanes Dennis, Emily, and Katrina. ||
Behold, A Whirlwind Came: The Science of Tracking Hurricanes
Go to this pageThis documentary-style video shows how NASA computer modeling research is contributing to an improved understanding and forecasts of hurricanes. It weaves interviews of three Goddard Space Flight Center scientists with scientific visualizations and live-action footage of hurricanes and the scientists studying them. The video focuses on application of the NASA finite-volume General Circulation Model (fvGCM) to the 2004 Atlantic Ocean hurricane season. Over the last 20 years, the National Oceanic and Atmospheric Administration's National Hurricane Center and National Weather Service have produced enormous improvements in hurricane forecasting. However, by running at ~25-kilometer resolution (twice that of current operational forecasts), the NASA fvGCM has shown in some cases an accuracy of landfall prediction on the order of 100 kilometers up to 5 days in advance. Initial evaluation suggests that the potential exists for dramatic improvements in warning time and intensity forecasts for tropical cyclones around the globe. NASA has begun collaborating with the National Weather Service and other agencies worldwide to improve forecasts so that, among other advantages, local authorities can narrow areas for evacuation. The video was produced for the TerraLink exhibit at the Maryland Science Center in Baltimore.Winner of the 2005 Video Competition Crystal Award of Excellence. ||
Sea Surface Temperature, Clouds, and Tropical Depression/Storm/Hurricane Tracks from June 1, 2005 to August 29, 2005
Go to this pageThis visualization shows sea surface temperatures during the early part of the 2005 hurricane season. Overlaid are infrared cloud data and storm track data. Ocean temperatures are the fuel that drive hurricanes. Notice the correspondence between the storm tracks and the sea surface temperature response; this is particulary noticeable for hurricanes Dennis, Emily, and Katrina. ||
Sea Surface Temperature from June 1, 2005 to August 29, 2005
Go to this pageThis visualization shows the sea surface temperatures for the 2005 Atlantic hurricane season from June 1, 2005 through August 29, 2005. The ocean colors represent the sea surface temperatures. Orange and red depict regions that are 82 degrees F and higher, where the ocean is warm enough for hurricanes to form. Hurricane winds are sustained by the heat energy of the ocean, so the ocean is cooled as the hurricane passes and the energy is extracted to power the winds. The sea surface temperatures were measured by the AMSR-E instrument on the Aqua satellite. Several hurricane color water trails can be seen through this animation - particulary hurricanes Dennis, Emily, and Katrina. ||
Atlantic Hurricane/Storm Summary
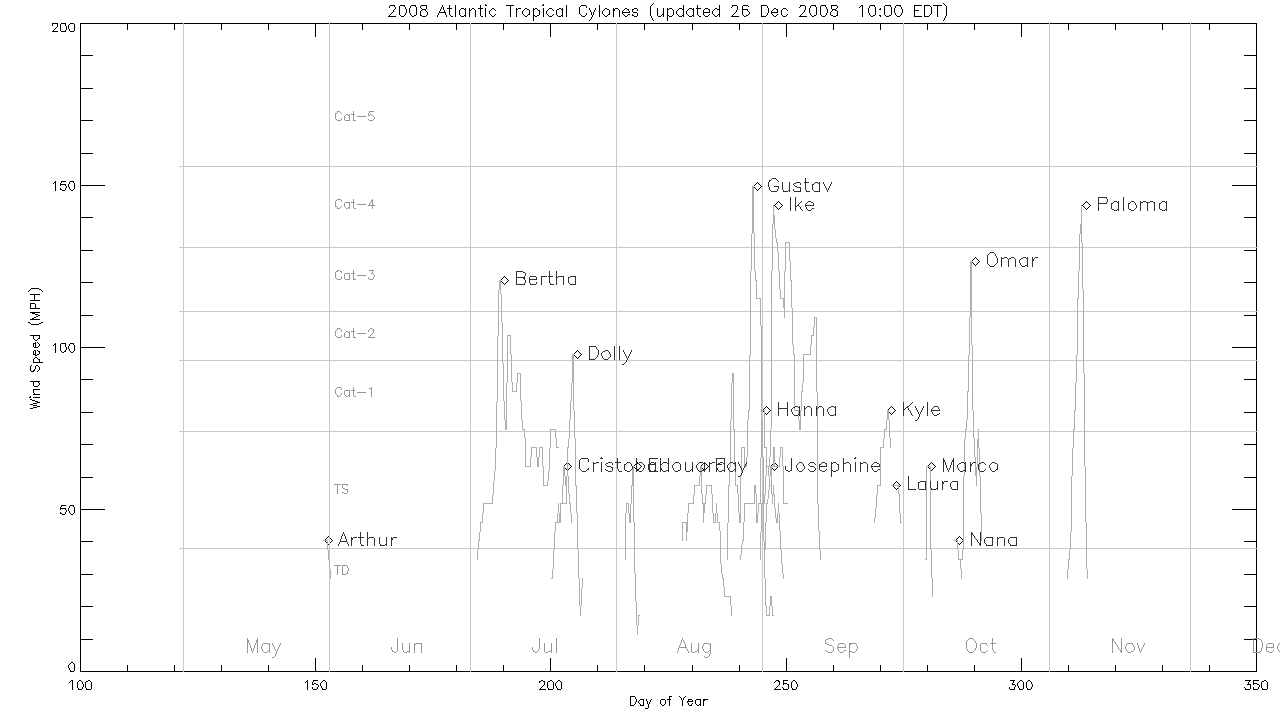
Go to this pageThese still images shows plots of time vs. wind speed for each tropical storm/hurricane of the Atlantic Hurricane seasons. Horizontal lines indicate wind speed category thresholds. A line plot for each storm shows the storm's name and a marker at the peak wind speed.The plot for the current year automatically updates every 2 hours during hurricane season. || 2018 Atlantic hurricanes and storms || hurricane_plot2018.gif (1280x720) [15.0 KB] ||
Katrina
- Visualization
- Visualization
- Visualization
- Visualization
- Visualization
- Visualization
- Visualization
- Visualization
- Visualization
- Visualization
- Visualization
- Visualization
- Visualization
- Visualization
- Visualization
- Visualization
- Visualization
- Visualization
Wilma
NASA's TRMM Satellite Captures Hurricane Wilma Data on October 20, 2005
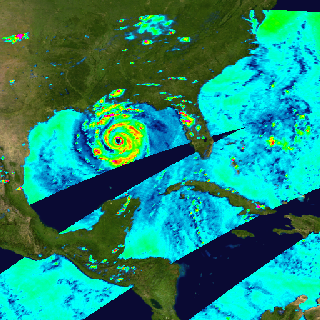
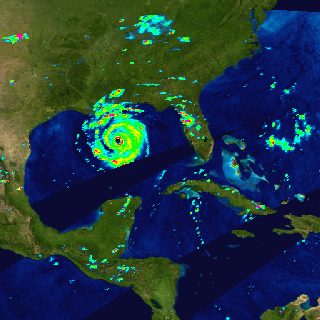
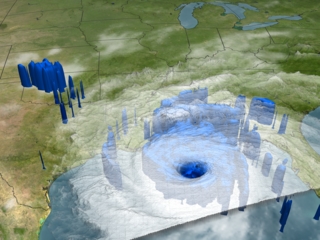
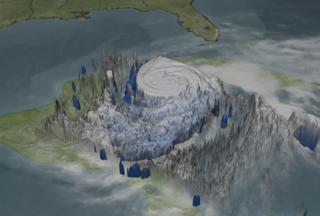
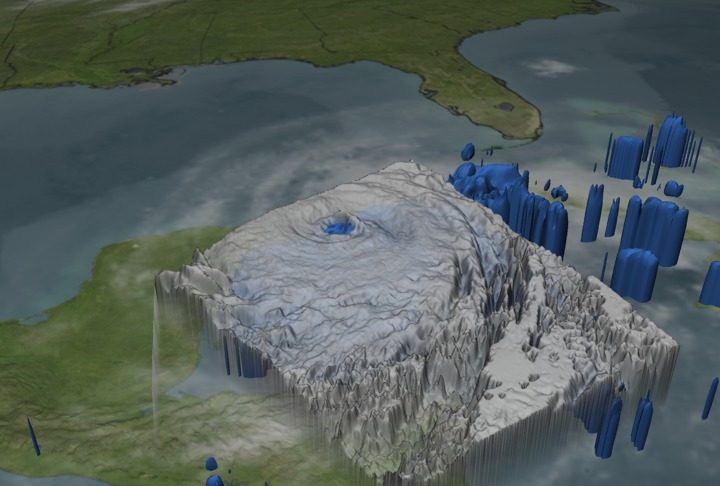
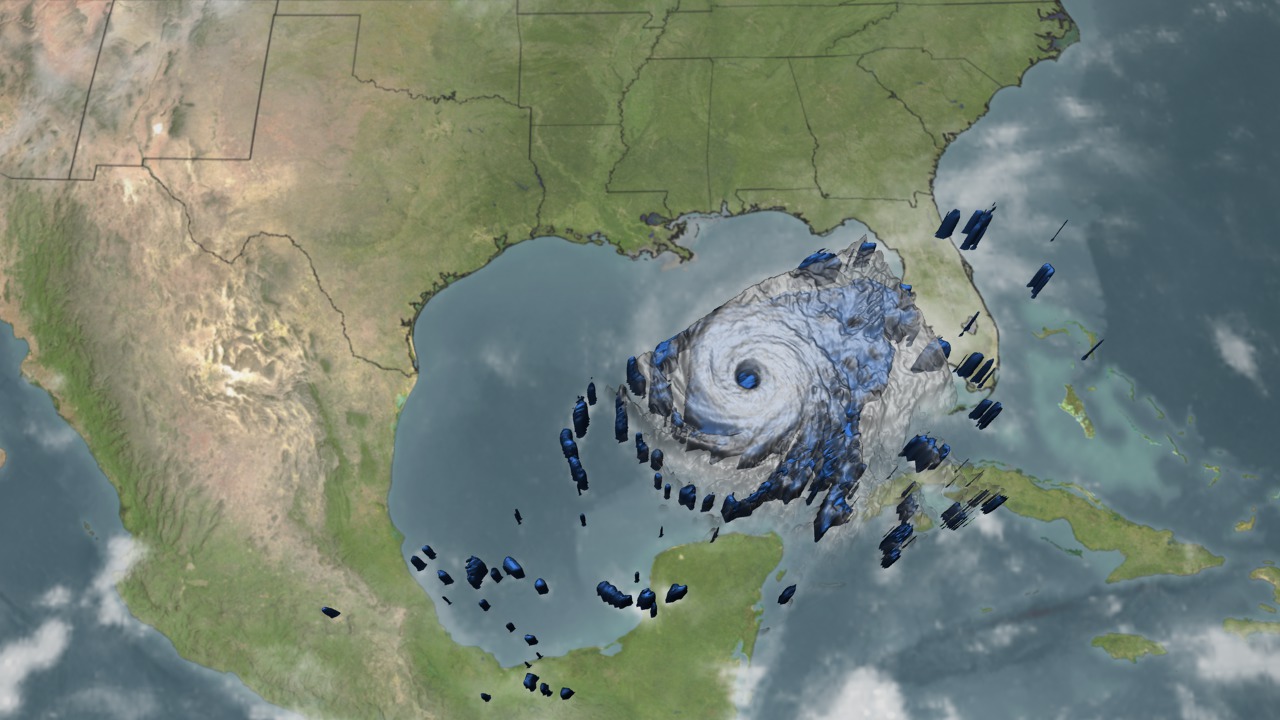
Go to this pageNASA's TRMM spacecraft observed this view of Hurricane Wilma on October 20, 2005 at 0152Z. At this time the storm was classified as the most dangerous category five. Wilma had record low minimum pressure readings of 892 mb and sustained winds of 140 knots. The cloud cover is taken by TRMM's Visible and Infrared Scanner(VIRS) and the GOES spacecraft. The rain structure is taken by TRMM's Tropical Microwave Imager (TMI) and TRMM's Precitation Radar(PR) instruments. TRMM looks underneath of the storm's clouds to reveal the underlying rain structure. Blue represents areas with at least 0.25 inches of rain per hour. Green shows at least 0.5 inches of rain per hour. Yellow is at least 1.0 inches of rain and red is at least 2.0 inches of rain per hour. ||
Hurricane Wilma on October 20, 2005
Go to this pageNASA's TRMM spacecraft observed this view of Hurricane Wilma on October 20, 2005 at 1645Z. At this time the storm was classified as a dangerous category four with sustained winds of 125 knots (138 mph). The cloud cover is taken by TRMM's Visible and Infrared Scanner(VIRS) and the GOES spacecraft. The rain structure is taken by TRMM's Tropical Microwave Imager (TMI) and TRMM's Precitation Radar(PR) instruments. TRMM looks underneath of the storm's clouds to reveal the underlying rain structure. Blue represents areas with at least 0.25 inches of rain per hour. Green shows at least 0.5 inches of rain per hour. Yellow is at least 1.0 inches of rain and red is at least 2.0 inches of rain per hour. ||
TRMM captures Hot Towers Igniting Hurricane Wilma's Heat Engine
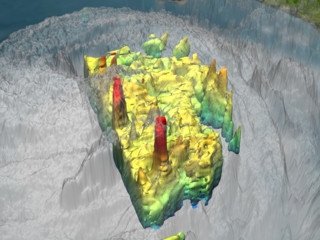
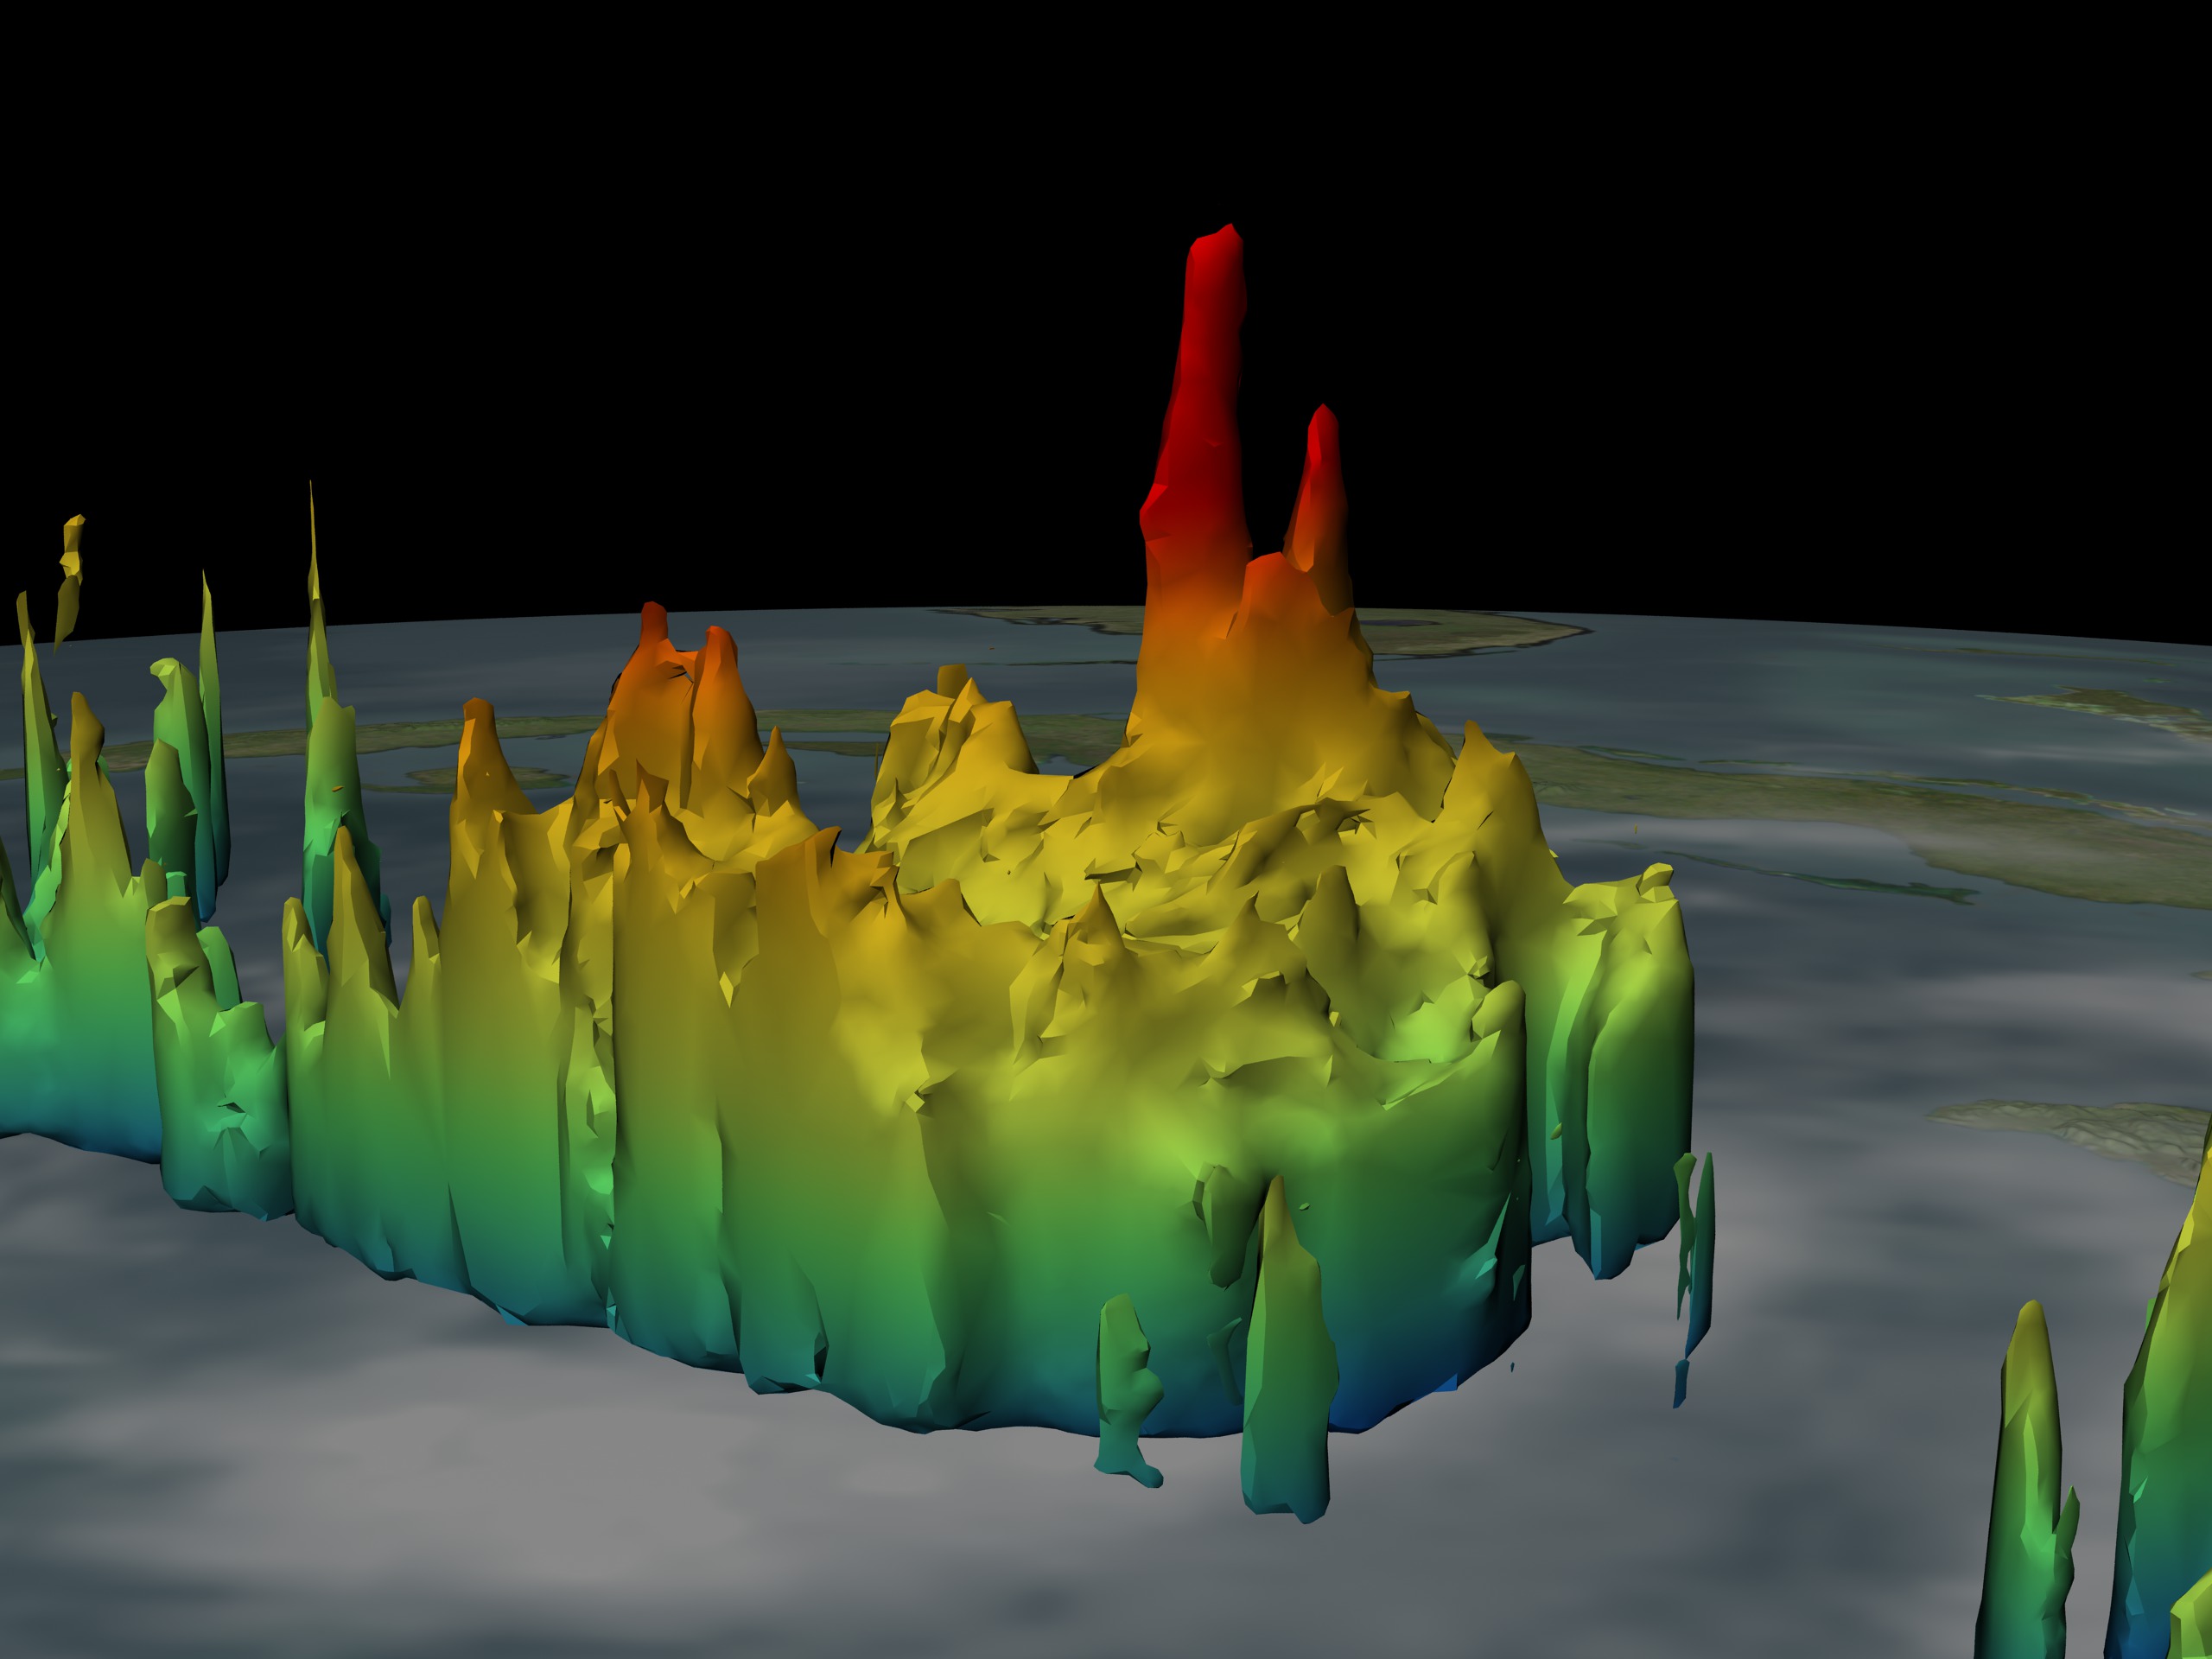
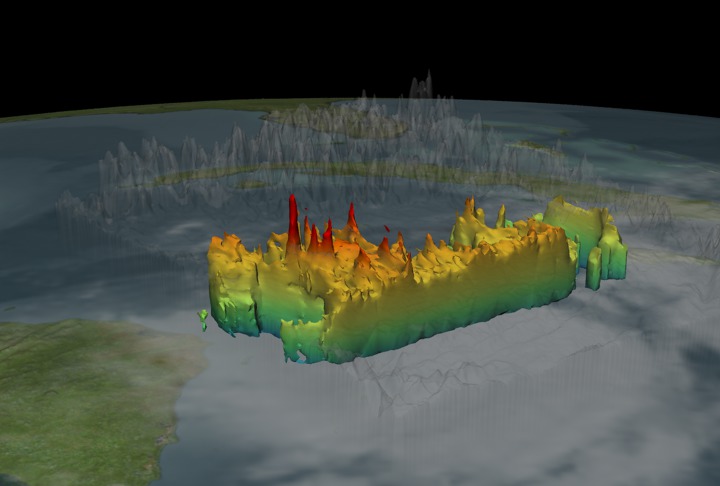
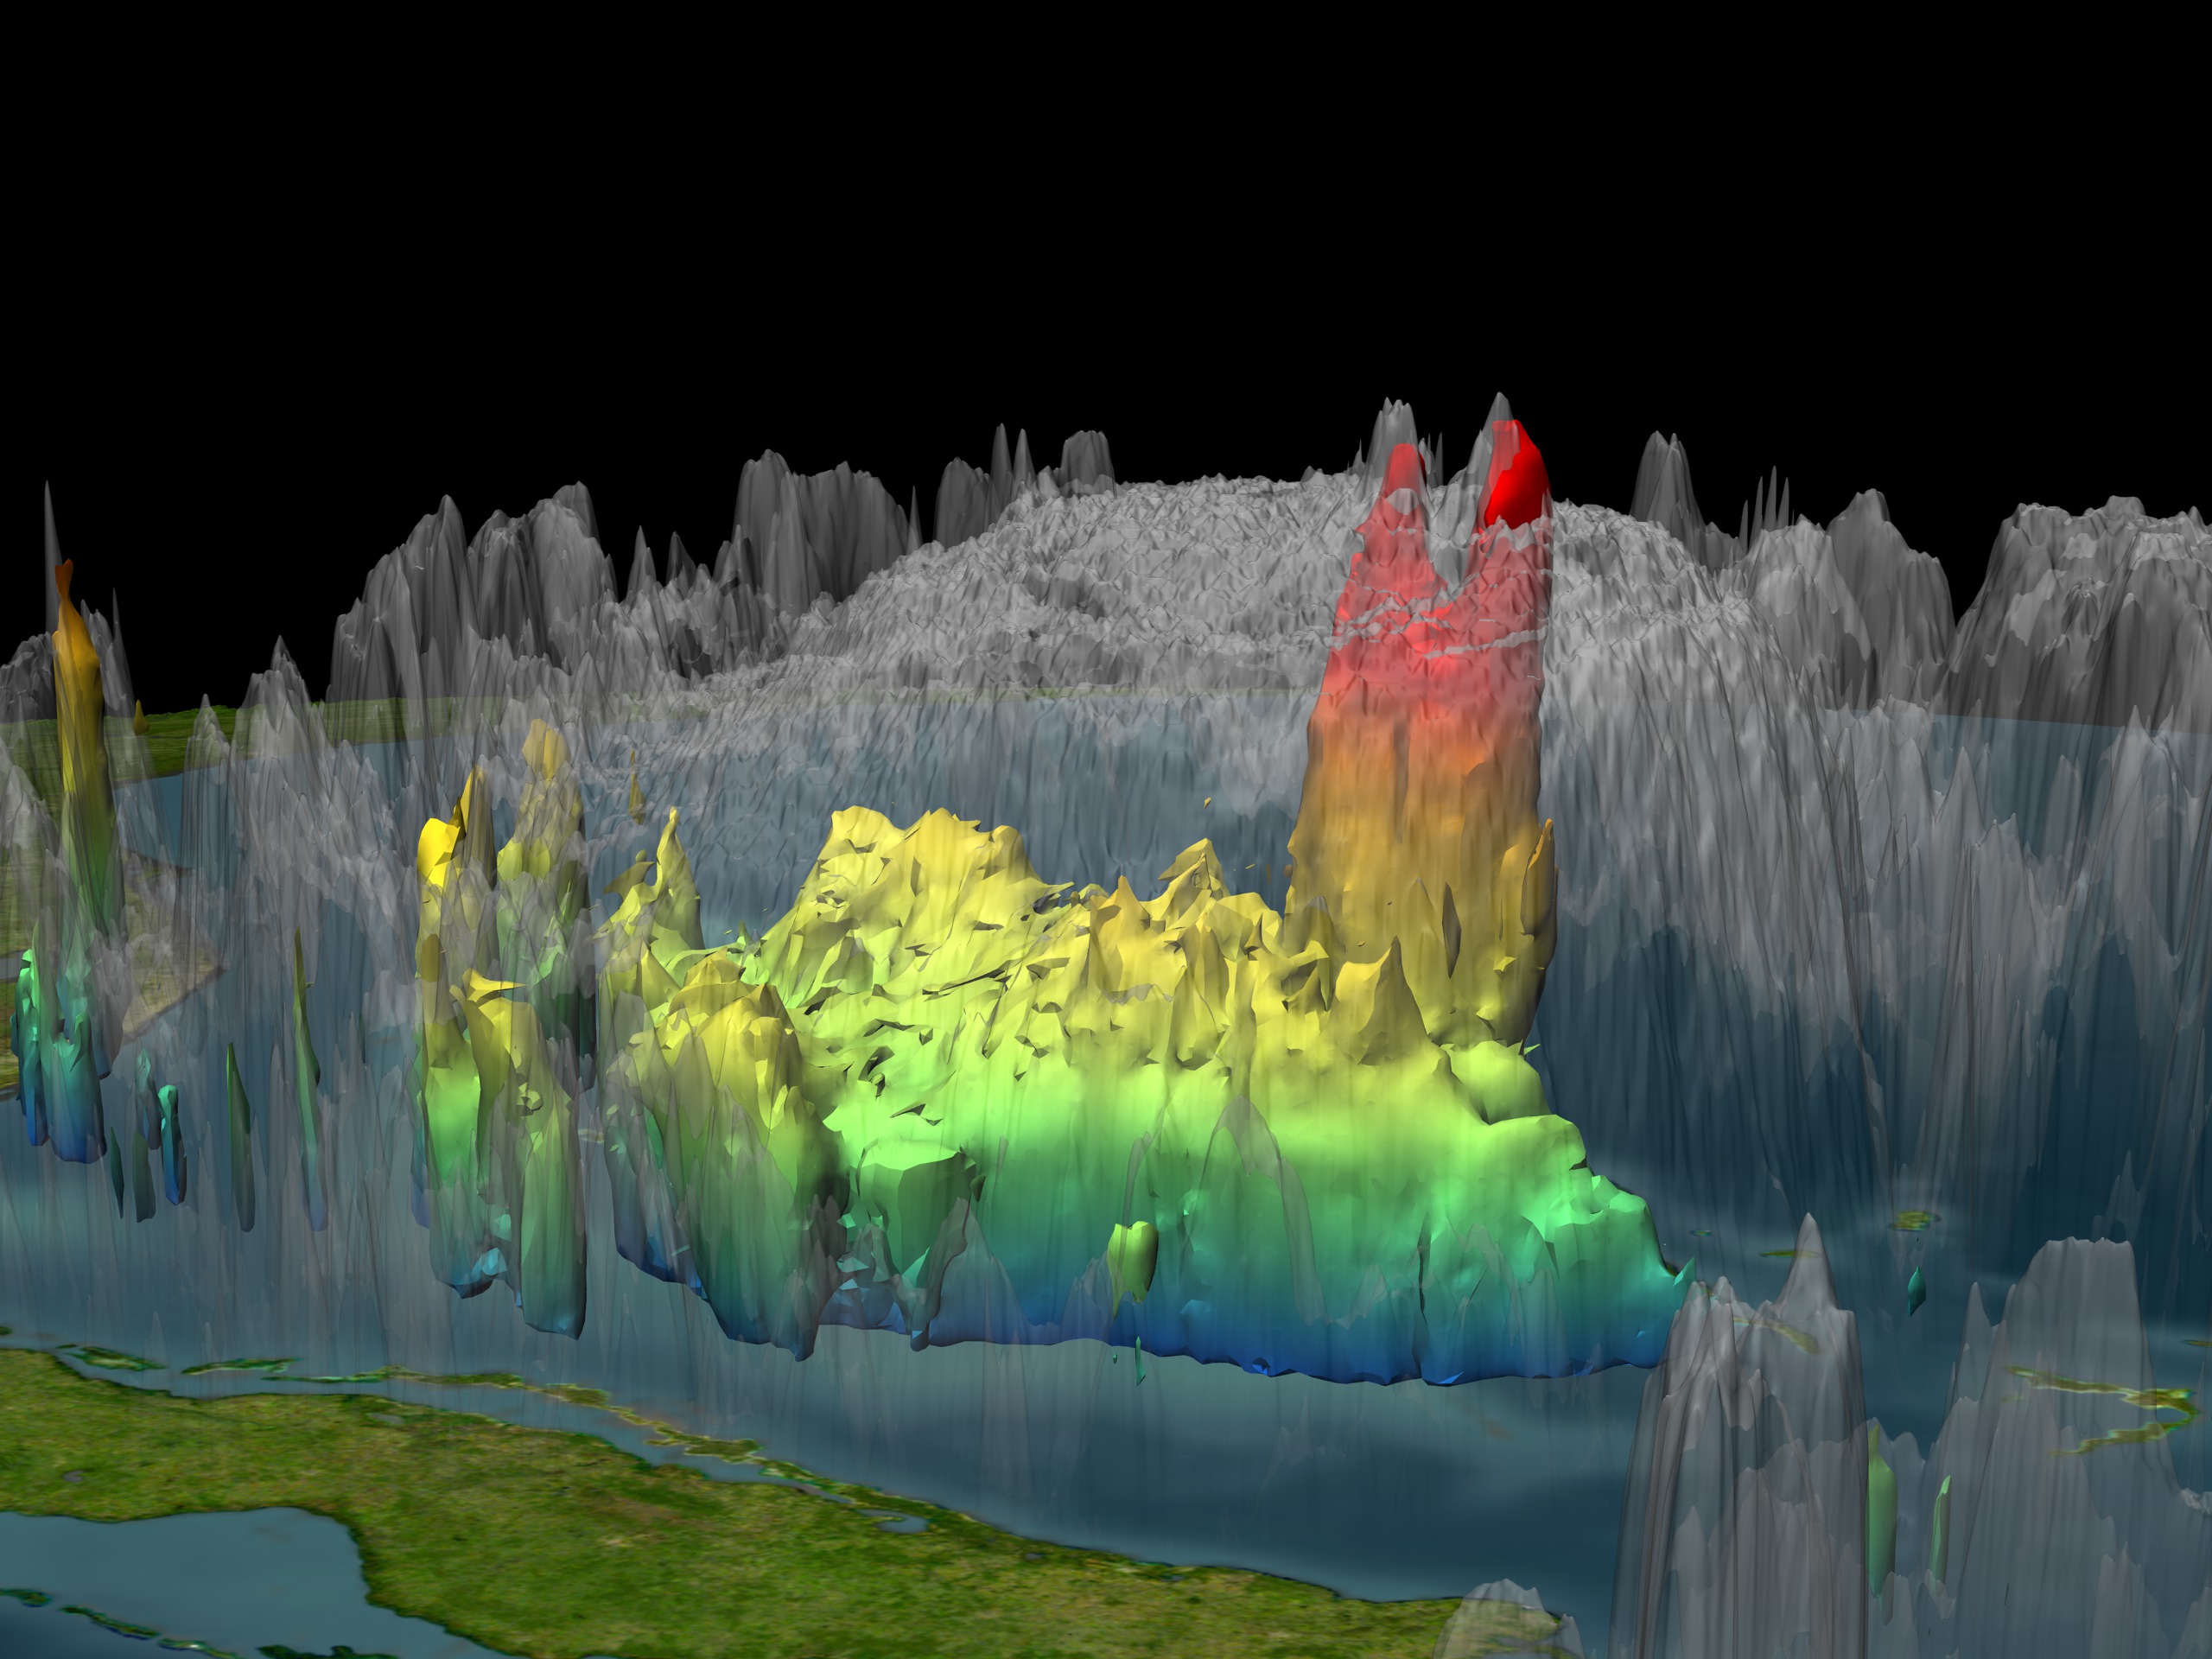
Go to this pageOn October 17, 2005 at 0302 Zulu (11:02 EDT on October 16, 2005), Wilma was classified as a Tropical Storm with sustained wind speeds of only 30 knots (34 mph) and pressure reading of 1001 mb. Forty-Eight hours later the storm had increased its intensity to category five status with sustained winds of 150 knots (172 mph). The tall towers (in red) near the center of the circulation often indicate further strengthening. Because of the size (1-20 km) and short duration (30 minute to 2 hours) of these hot towers, studies of these events have been limited to descriptive studies from aircraft observations, although a few have attempted to use the presence of hot towers in a predictive capacity. Before TRMM, no data set existed that could show globally and definitively the presence of these hot towers in cyclone systems. Aircraft radar studies of individual storms lack global coverage. Global microwave or infrared sensor observations do not provide the needed spatial resolution. With a ground resolution of 5 km, the TRMM Precipitation Radar provided the needed data set for examining the predictive value of hot towers in cyclone intensification. ||
Hurricane Wilma MODIS Progression
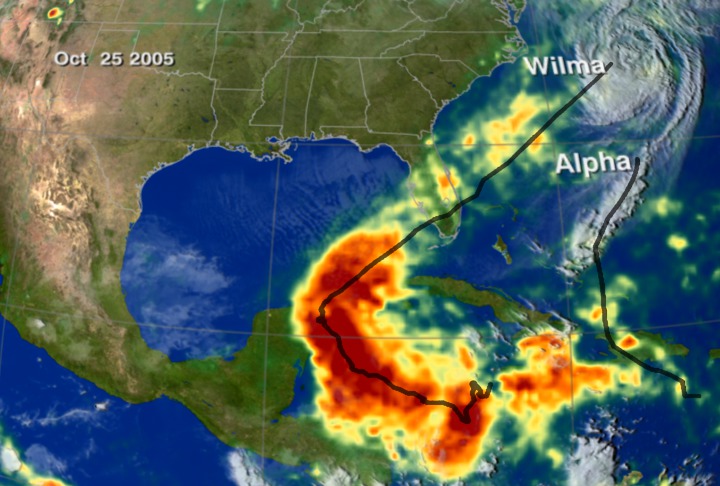
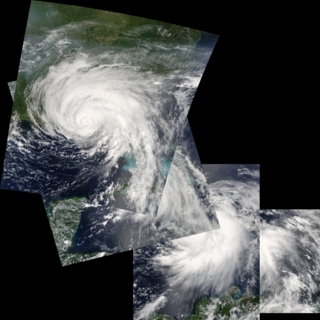
Go to this pageA progression of Hurricane Wilma from 10/19/05 to 10/25/05 using Aqua/MODIS, Terra/MODIS and NOAA/GOES data. Hurricane Wilma followed in the wake of Hurricane Katrina and Hurricane Rita through the Gulf of Mexico. ||
Hurricane Wilma Rain Accumulation
Go to this pageThis animation shows rain accumulation from Hurricane Wilma from October 15 through 25, 2005 based on data from the Tropical Rainfall Measuring Mission (TRMM) Multisatellite Precipitation Analysis. Satellite cloud data from NOAA/GOES is overlaid for context. The accumulation is shown in colors ranging from green (less than 30 mm of rain) through red (80 mm or more). The TRMM satellite, using the world's only spaceborne rain radar and other microwave instruments, measures rainfall over the ocean. ||
TRMM Observes Hurricane Wilma on October 19, 2005
Go to this pageNASA's TRMM spacecraft observed this view of Hurricane Wilma on October 19, 2005 at 1740Z. At this time the storm was classified as the most dangerous category five. Wilma had record low minimum pressure readings of 893 mb and sustained winds of 140 knots (161 mph). The cloud cover is taken by TRMM's Visible and Infrared Scanner(VIRS) and the GOES spacecraft. The rain structure is taken by TRMM's Tropical Microwave Imager (TMI) and TRMM's Precitation Radar(PR) instruments. TRMM looks underneath of the storm's clouds to reveal the underlying rain structure. Blue represents areas with at least 0.25 inches of rain per hour. Green shows at least 0.5 inches of rain per hour. Yellow is at least 1.0 inches of rain and red is at least 2.0 inches of rain per hour. ||
Hurricane Wilma — SSTs and Clouds
Go to this pageThis visualization shows sea surface temperatures and clouds for Hurricane Wilma. The data is from October 15 through 20, 2005. The colors on the ocean represent the sea surface temperatures, and satellite images of the hurricane clouds are laid over the temperatures to clearly show the hurricane positions. Orange and red depict regions that are 82 degrees F and higher, where the ocean is warm enough for hurricanes to form. Hurricane winds are sustained by the heat energy of the ocean, so the ocean is cooled as the hurricane passes and the energy is extracted to power the winds. The sea surface temperatures are 3-day moving averages based on the AMSR-E instrument on the Aqua satellite, while the cloud images were taken by the Imager on the GOES-12 satellite. ||
Hurricane Wilma's Hot Towers seen by TRMM 10/17/2005 at 1754Z
Go to this pageOn October 17, 2005 at 1754 Zulu, Wilma was classified as a Tropical Storm with sustained wind speeds of only 45 knots. Forty hours later the storm had increased its intensity to category five status with sustained winds of 150 knots. Spikes in the rain structure known as 'Hot Towers' indicate storm intensity. 'Hot Towers' refers to tall cumulonimbus clouds and has been seen as one of the mechanisms by which the intensity of a tropical cyclone is maintained. Because of the size (1-20 km) and short duration (30 minute to 2 hours) of these hot towers, studies of these events have been limited to descriptive studies from aircraft observations, although a few have attempted to use the presence of hot towers in a predictive capacity. Before TRMM, no data set existed that could show globally and definitively the presence of these hot towers in cyclone systems. Aircraft radar studies of individual storms lack global coverage. Global microwave or infrared sensor observations do not provide the needed spatial resolution. With a ground resolution of 5 km, the TRMM Precipitation Radar provided the needed data set for examining the predictive value of hot towers in cyclone intensification. ||
Hurricane Wilma from TRMM: October 17, 2005
Go to this pageNASA's TRMM spacecraft observed this view of Hurricane Wilma on October 17, 2005 at 1754Z. At this time the storm was classified as a Tropical Storm with a minimum pressure of 997 mb, and sustained winds of 45 knots. The cloud cover is taken by TRMM's Visible and Infrared Scanner(VIRS) and the GOES spacecraft. The rain structure is taken by TRMM's Tropical Microwave Imager (TMI) and TRMM's Precitation Radar(PR) instruments. TRMM looks underneath of the storm's clouds to reveal the underlying rain structure. Blue represents areas with at least 0.25 inches of rain per hour. Green shows at least 0.5 inches of rain per hour. Yellow is at least 1.0 inches of rain and red is at least 2.0 inches of rain per hour. ||
Rita
Hurricane Rita Push In
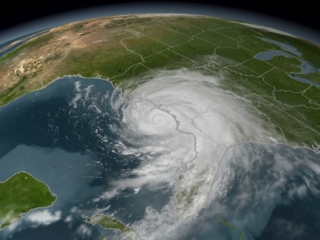
Go to this pageThis animation is a simple push in to GOES-based clouds showing Hurricane Rita make its way through the Gulf of Mexico and then inland. This animation was created in support of the 'Exploring Time' show produced by Red Hill Studios and Tom Lucas Productions. For more information go to http://exploringtime.org. ||
Hurricane Rita Rain Accumulation
Go to this pageThis animation shows rain accumulation from Hurricane Rita from September 18 through 25, 2005 based on data from the Tropical Rainfall Measuring Mission (TRMM) Multisatellite Precipitation Analysis. Satellite cloud data from NOAA/GOES is overlaid for context. The accumulation is shown in colors ranging from green (less than 30 mm of rain) through red (80 mm or more). The TRMM satellite, using the world's only spaceborne rain radar and other microwave instruments, measures rainfall over the ocean. ||
Hurricane Rita MODIS Progression
Go to this pageA progression of Hurricane Rita from 9/19/05 to 9/24/05 using Aqua/MODIS and NOAA/GOES data. Hurricane Rita followed in the wake of Hurricane Katrina, through the Gulf of Mexico, threatening Louisiana residents yet again. Although the city of New Orleans was mostly spared from this second Gulf hurricane, large areas of rural Texas and Louisiana were flooded. ||
Hurricane Rita from TRMM: September 23, 2005
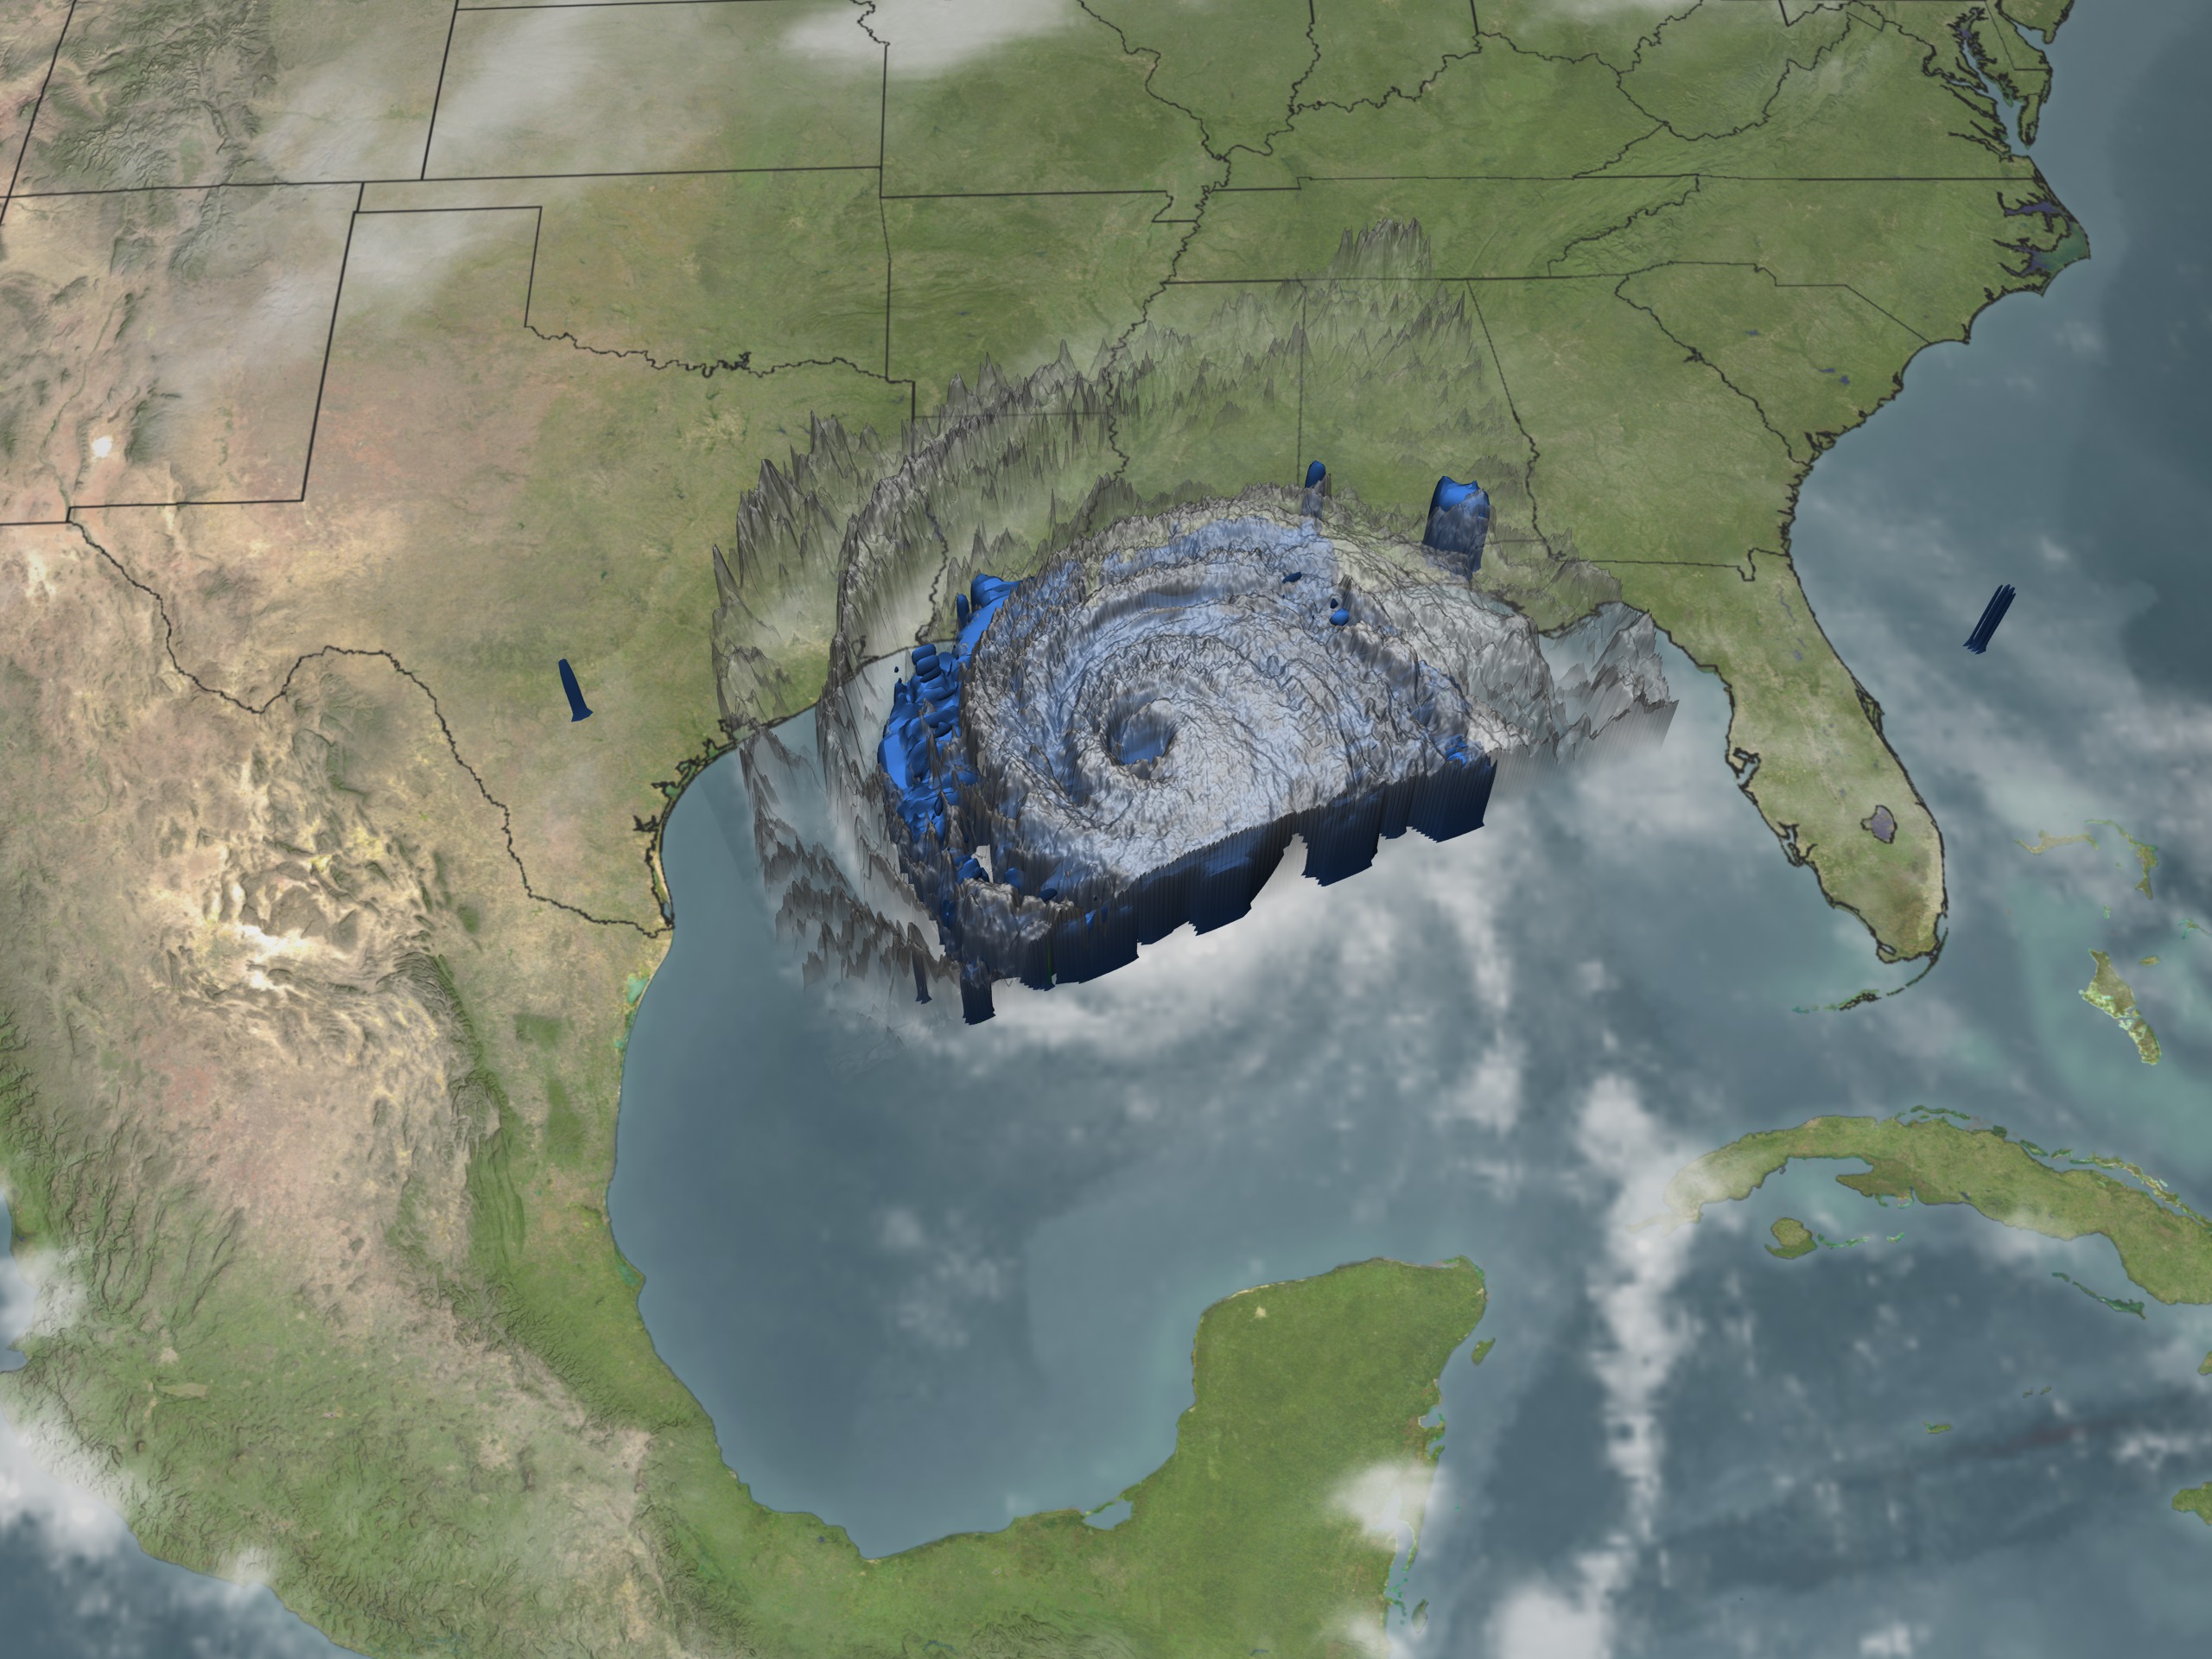
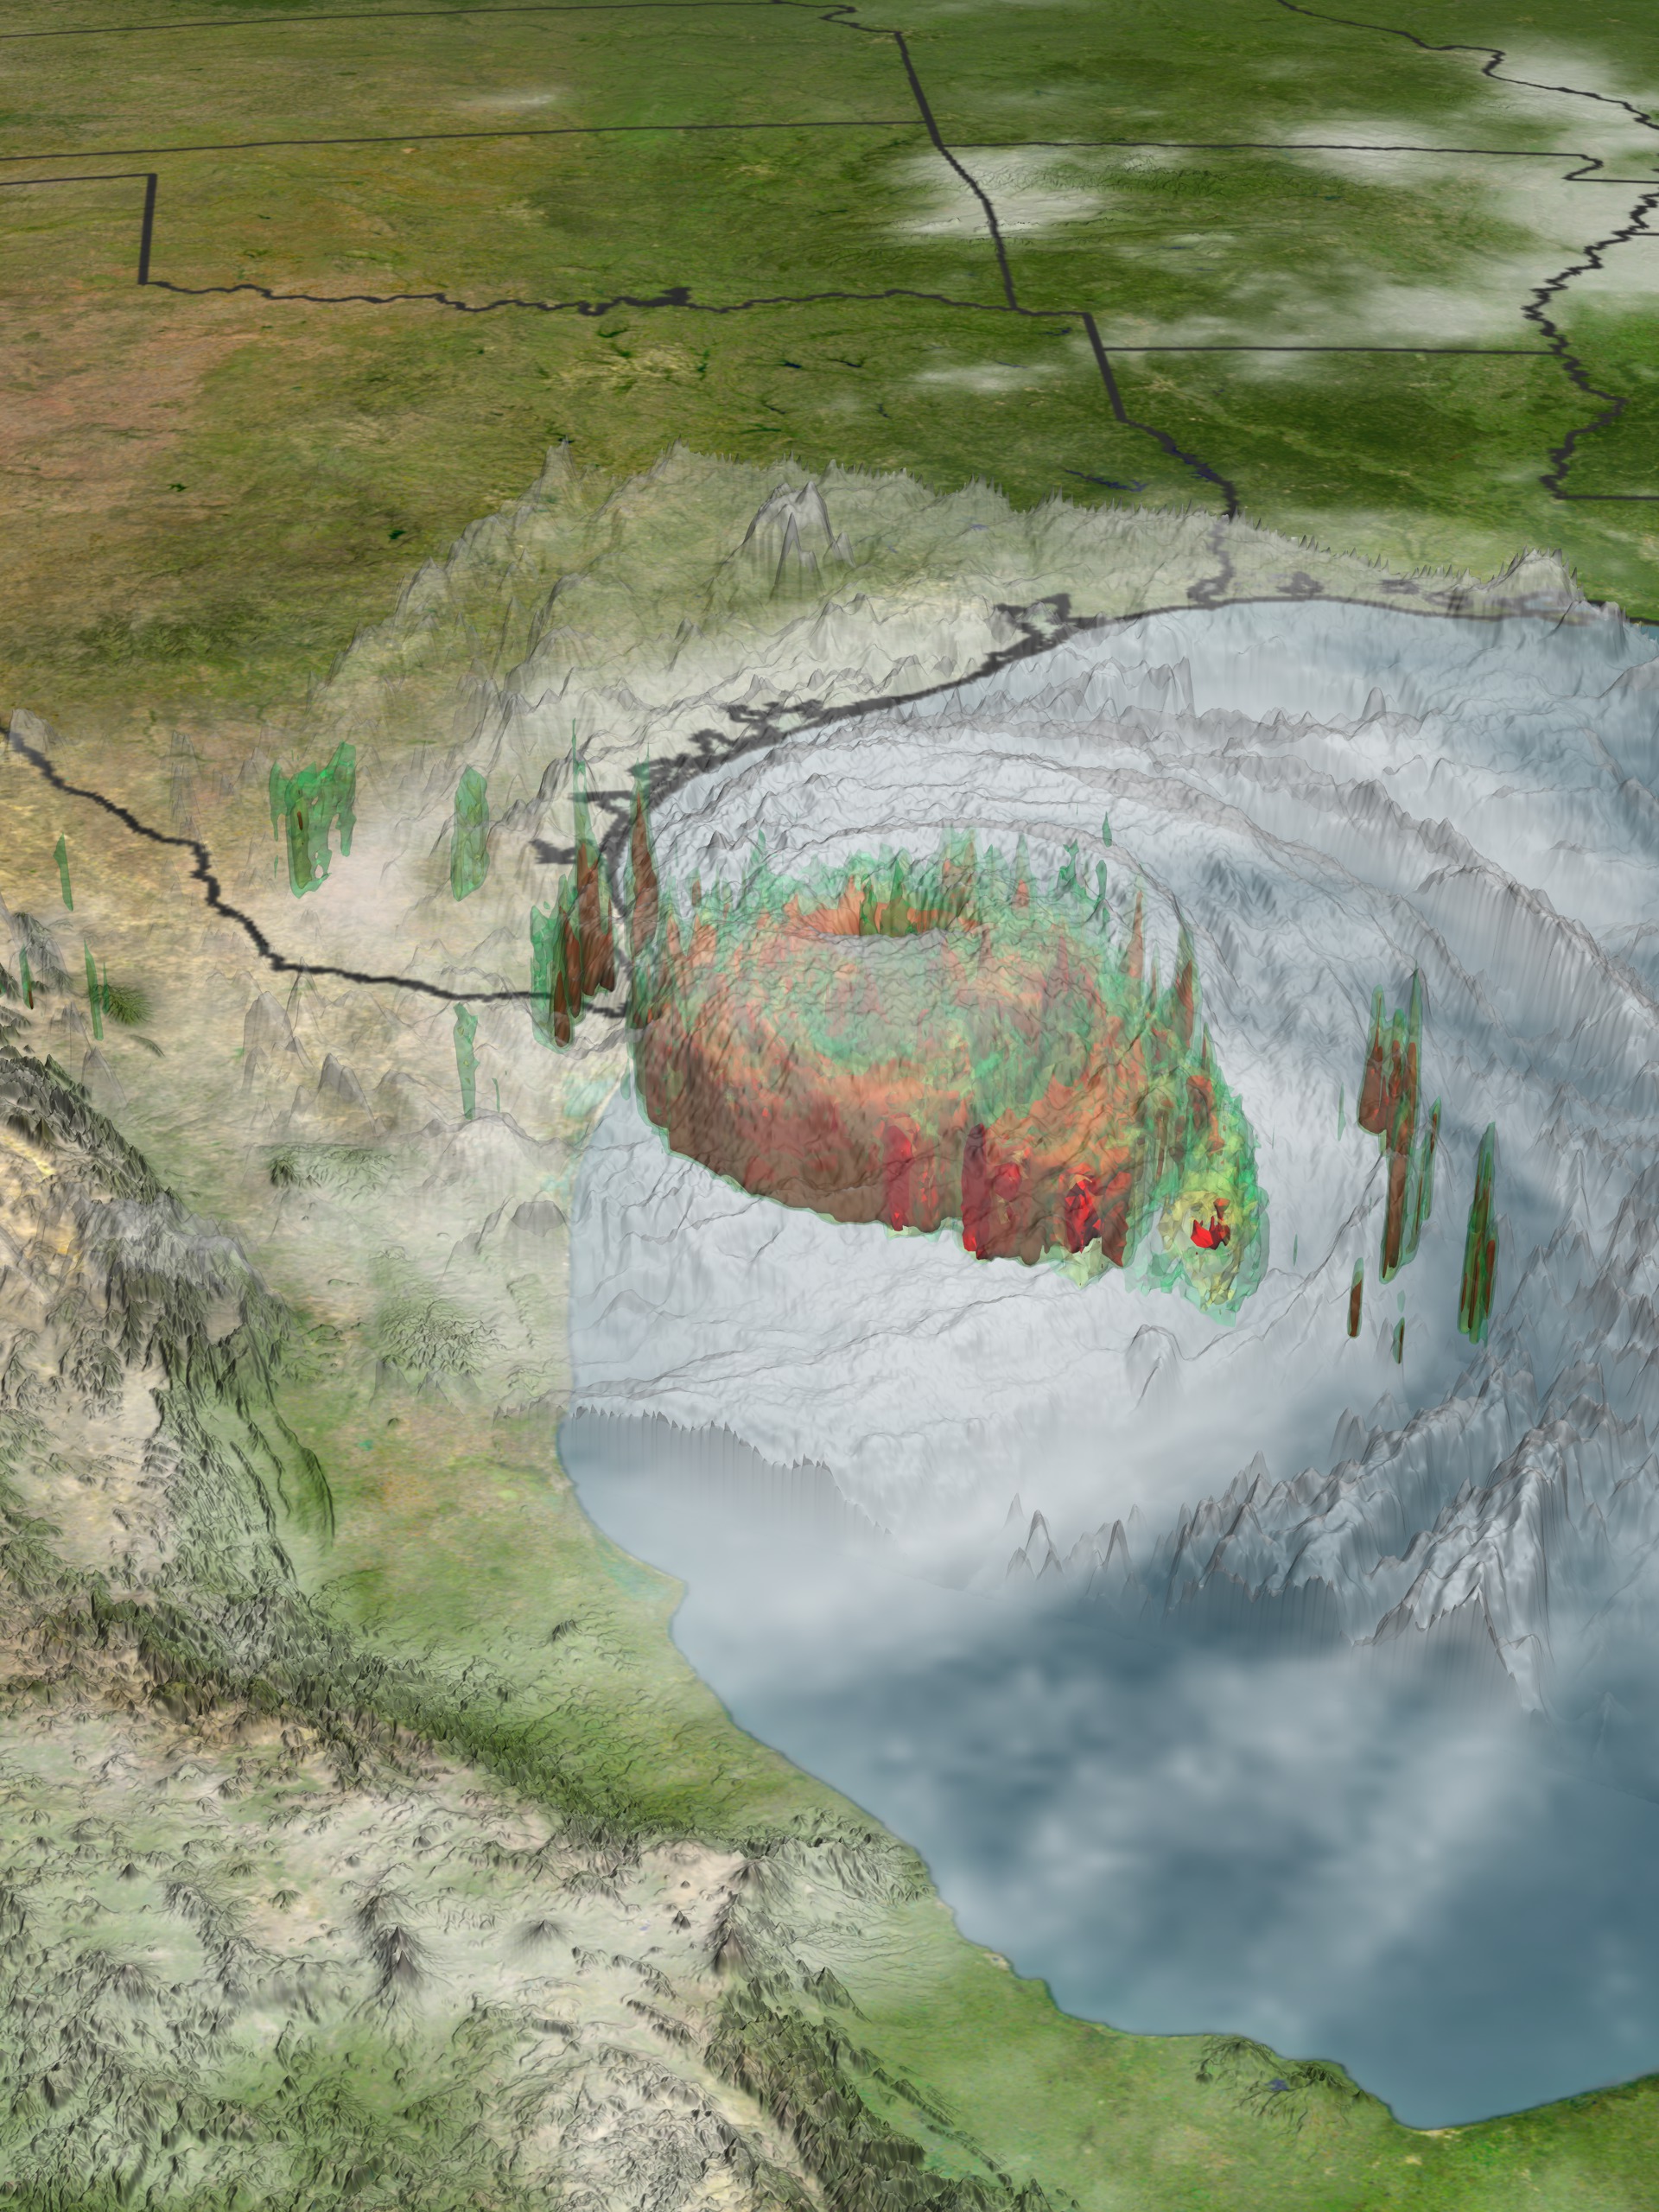
Go to this pageNASA's TRMM spacecraft observed this view of Hurricane Rita on September 23, 2005 at 0852Z. At this time the storm was a category 4 hurricane with a minimum pressure of 924 mb, and sustained winds of 120 knots. The cloud cover is taken by TRMM's Visible and Infrared Scanner(VIRS) and the GOES spacecraft. The rain structure is taken by TRMM's Tropical Microwave Imager (TMI). It looks underneath of the storm's clouds to reveal the underlying rain structure. Blue represents areas with at least 0.25 inches of rain per hour. Green shows at least 0.5 inches of rain per hour. Yellow is at least 1.0 inches of rain and red is at least 2.0 inches of rain per hour. ||
Hurricane Rita from TRMM: September 22, 2005
Go to this pageNASA's TRMM spacecraft observed this view of Hurricane Rita on September 22, 2005 at 0810Z. At this time the storm was the most destructive category 5 hurricane with a minimum pressure of 898mb, sustained winds of 150 knots, and a 15 nautical mile eye diameter. The cloud cover is taken by TRMM's Visible and Infrared Scanner(VIRS) and the GOES spacecraft. The rain structure is taken by TRMM's Tropical Microwave Imager (TMI). It looks underneath of the storm's clouds to reveal the underlying rain structure. Blue represents areas with at least 0.25 inches of rain per hour. Green shows at least 0.5 inches of rain per hour. Yellow is at least 1.0 inches of rain and red is at least 2.0 inches of rain per hour. ||
Hurricane Rita Sea Surface Temperature and Clouds
Go to this pageThis visualization shows the sea surface temperatures during Hurricane Rita. The data is from Septemeber 17 through 22, 2005. The colors on the ocean represent the sea surface temperatures, and satellite images of the hurricane clouds are laid over the temperatures to clearly show the hurricane positions. Orange and red depict regions that are 82 degrees F and higher, where the ocean is warm enough for hurricanes to form. Hurricane winds are sustained by the heat energy of the ocean, so the ocean is cooled as the hurricane passes and the energy is extracted to power the winds. The sea surface temperatures are 3-day moving averages based on the AMSR-E instrument on the Aqua satellite, while the cloud images were taken by the Imager on the GOES-12 satellite. ||
Hurricane Rita from TRMM: September 21, 2005
Go to this pageNASA's TRMM spacecraft is used to understand Hurricane Rita. TRMM observed this view of Hurricane Rita on September 21, 2005 at 0909Z. At this time the storm was a category 3 hurricane with a minimum pressure of 956mb, sustained winds of 105 knots, and a 25 nautical mile eye diameter. The cloud cover is taken by TRMM's Visible and Infrared Scanner(VIRS) and the GOES spacecraft. The rain structure is taken by TRMM's Tropical Microwave Imager (TMI). It looks underneath of the storm's clouds to reveal the underlying rain structure. Blue represents areas with at least 0.25 inches of rain per hour. Green shows at least 0.5 inches of rain per hour. Yellow is at least 1.0 inches of rain and red is at least 2.0 inches of rain per hour. ||
Hurricane Rita's Hot Towers
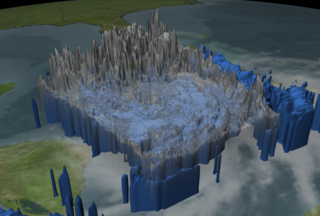
Go to this pageNASA's TRMM spacecraft allows us to look under Hurricane Rita's clouds to see the rain structure on September 19, 2005 at 15Z. Spikes in the rain structure known as 'hot towers' indicate storm intensity. 'Hot Towers' refers to tall cumulonimbus clouds and has been seen as one of the mechanisms by which the intensity of a tropical cyclone is maintained. Because of the size (1-20 km) and short duration (30 minute to 2 hours) of these hot towers, studies of these events have been limited to descriptive studies from aircraft observations, although a few have attempted to use the presence of hot towers in a predictive capacity. Before TRMM, no data set existed that could show globally and definitively the presence of these hot towers in cyclone systems. Aircraft radar studies of individual storms lack global coverage. Global microwave or Infrared sensor observations do not provide the needed spatial resolution. With a ground resolution of 5 km, the TRMM Precipitation Radar provided the needed data set for examining the predictive value of hot towers in cyclone intensification. At the time the data was taken, this storm was classified as a Tropical Storm with winds off 55 knots and a pressure of 994mb. The existence of these 18 km towers in the eye wall alerted researchers that this storm was going to rapidly intensify. Within 48 hours of this data set, the storm was a very strong category 4 hurricane. ||
Hurricane Rita from TRMM: September 20, 2005
Go to this pageNASA's TRMM spacecraft is used to understand Hurricane Rita. TRMM observed this view of Hurricane Rita just before the storm made landfall on September 20, 2005. The cloud cover is taken by TRMM's Visible and Infrared Scanner(VIRS) and the GOES spacecraft. The rain structure is taken by TRMM's Tropical Microwave Imager (TMI). It looks underneath of the storm's clouds to reveal the underlying rain structure. Blue represents areas with at least 0.25 inches of rain per hour. Green shows at least 0.5 inches of rain per hour. Yellow is at least 1.0 inches of rain and red is at least 2.0 inches of rain per hour. ||
Ophelia
Hurricane Ophelia
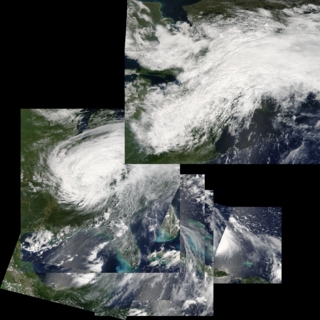
Go to this pageThe Moderate Resolution Imaging Spectroradiometer (MODIS) instrument on both the Aqua and Terra satellites captured images of Ophelia hanging off the coast of the Carolinas. ||
Hurricane Ophelia from TRMM: September 11, 2005 1826 Zulu
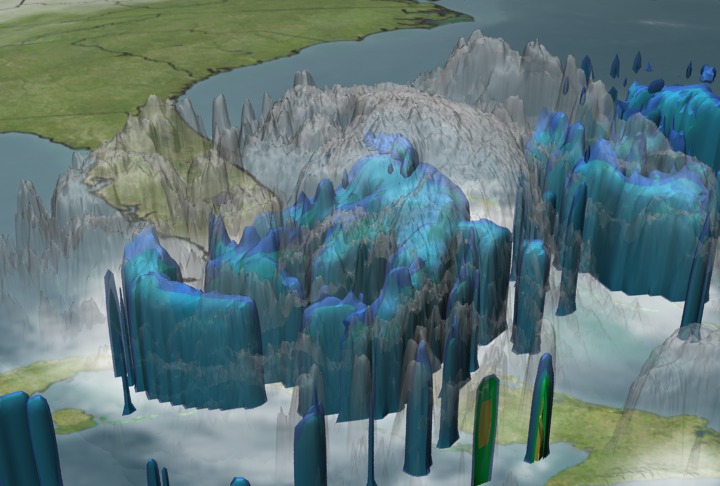
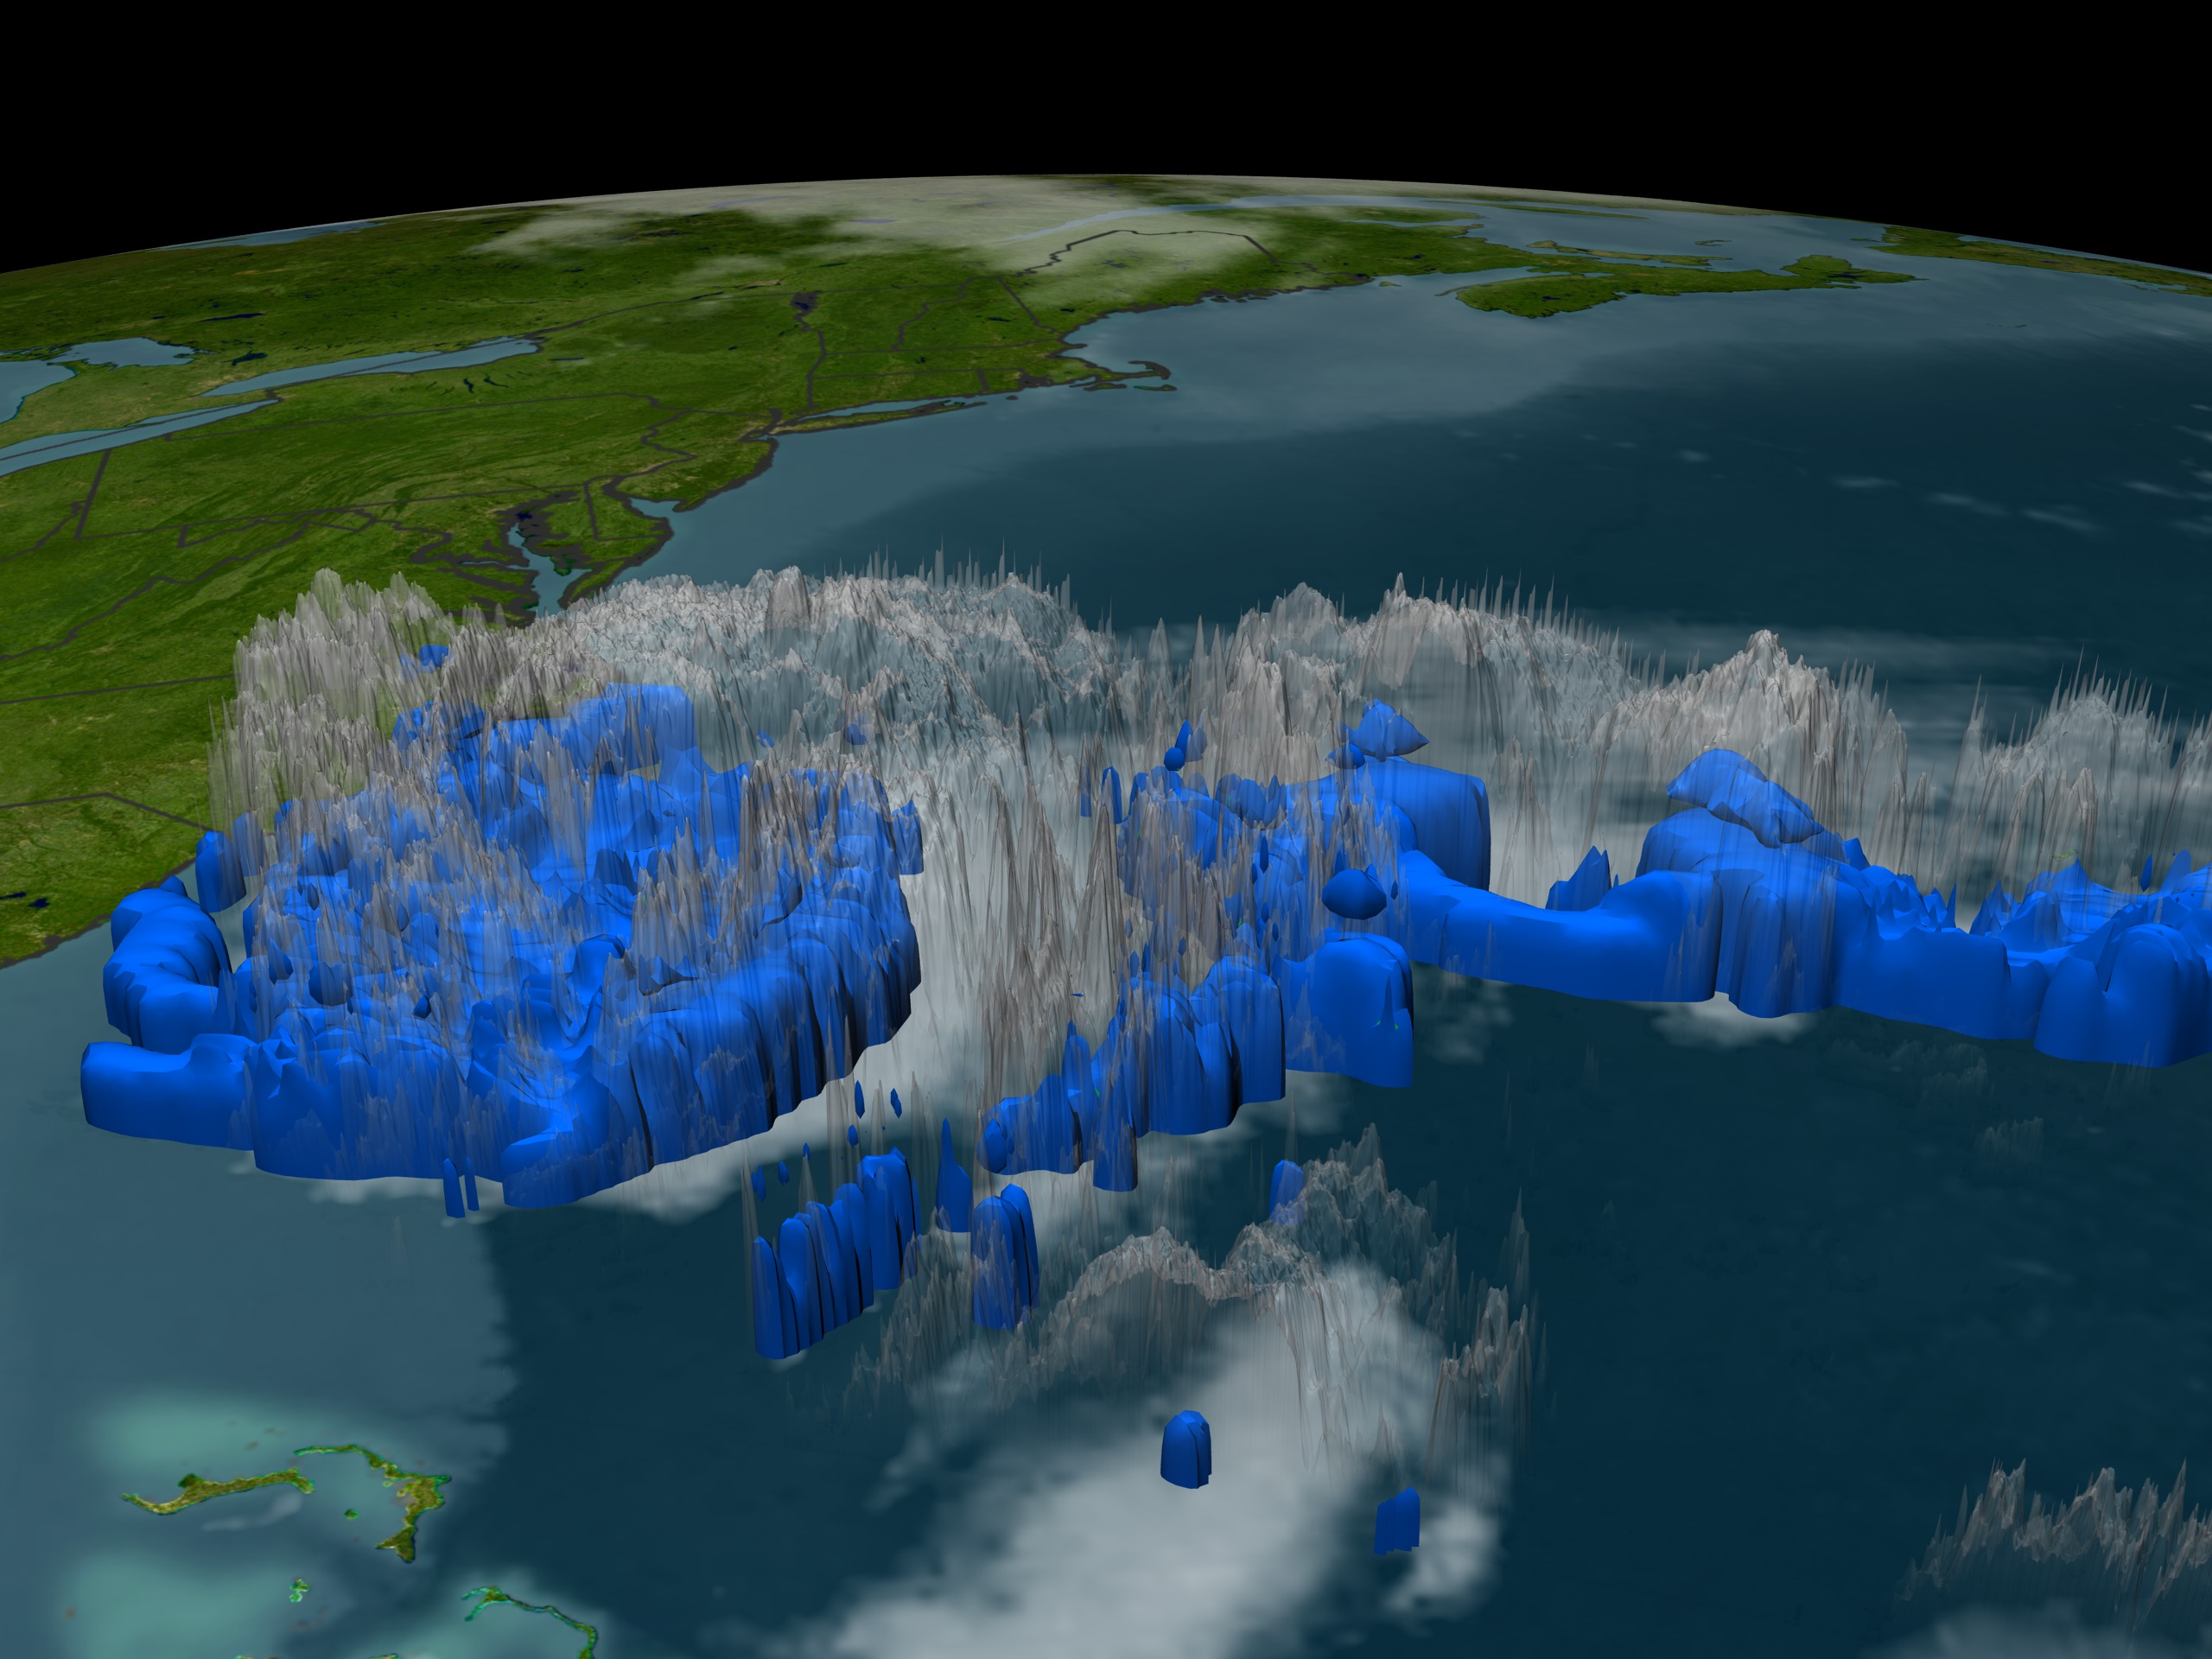
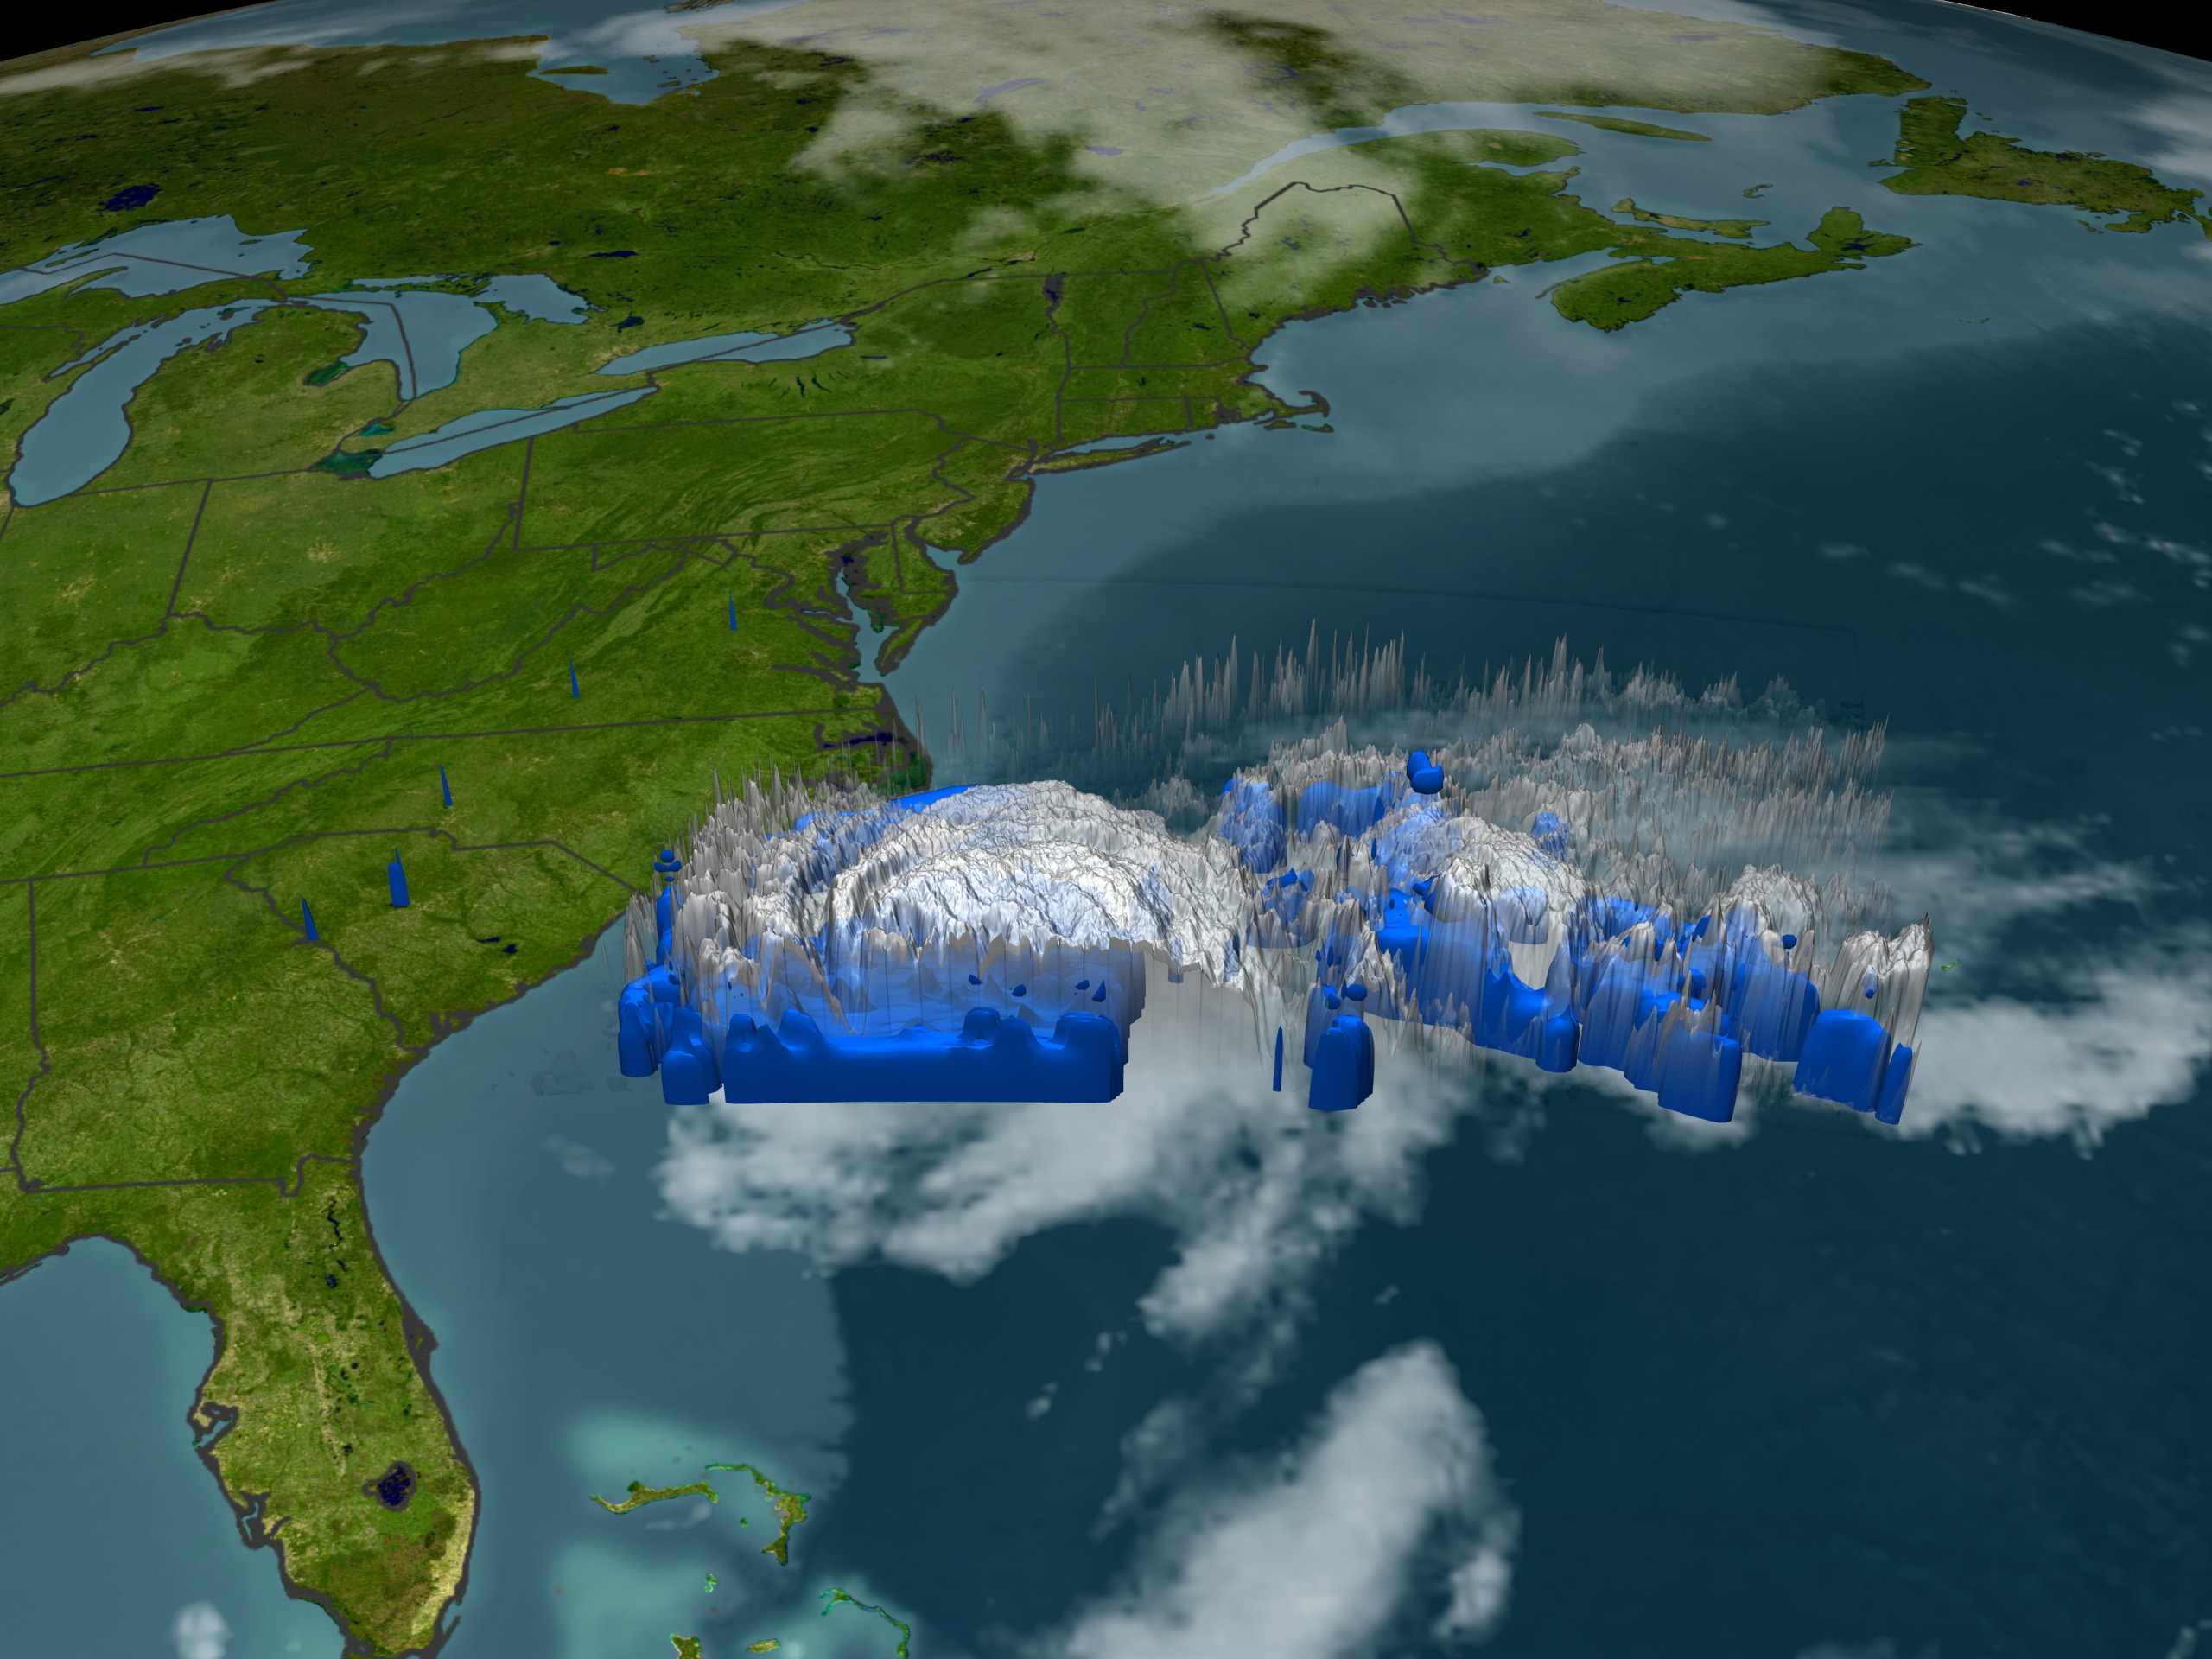
Go to this pageNASA's TRMM spacecraft observed this view of Hurricane Ophelia on September 11, 2005 at 1826 Zulu. At the time the data was taken, the hurricane was a Category 1 hurricane located 250 miles east-southeast of Charleston, South Carolina and about 255 miles south of Cape Hatteras, North Carolina. The storm had sustained winds of 75 mph. The cloud cover is taken by TRMM's Visible and Infrared Scanner (VIRS) and the GOES spacecraft. The rain structure is taken by TRMM's Tropical Microwave Imager (TMI). It looks underneath of the storm's clouds to reveal the underlying rain structure. ||
Hurricane Ophelia from TRMM: September 11, 2005 1648 Zulu
Go to this pageNASA's TRMM spacecraft observed this view of Hurricane Ophelia on September 11, 2005. At the time the data was taken, the hurricane was a Category 1 hurricane with winds of 70 KT. The cloud cover is taken by TRMM's Visible and Infrared Scanner (VIRS) and the GOES spacecraft. The rain structure is taken by TRMM's Tropical Microwave Imager (TMI). It looks underneath of the storm's clouds to reveal the underlying rain structure. ||
Emily
Hurricane Emily: July 20, 2005
Go to this pageNASA's TRMM spacecraft is used to understand Hurricane Emily. TRMM observed this view of Hurricane Emily just before the storm made landfall on July 20, 2005. The cloud cover is taken by TRMM's Visible and Infrared Scanner(VIRS) and the GOES spacecraft. The rain structure is taken by TRMM's Tropical Microwave Imager (TMI). It looks underneath of the storm's clouds to reveal the underlying rain structure. Blue represents areas with at least 0.25 inches of rain per hour. Green shows at least 0.5 inches of rain per hour. Yellow is at least 1.0 inches of rain and red is at least 2.0 inches of rain per hour. ||
Progression of Hurricane Emily, 2005 (WMS)
Go to this pageEmily was a record-setting storm for many reasons. When it formed on July 11, Emily became the earliest fifth named storm on record. As it moved through the Caribbean, Emily intensified into a powerful Category 4 storm with winds over 250 kilometers per hour (150 mph) and gusts as high as 300 kilometers per hour (184 mph), making it the most powerful storm to form before August. The previous record was set by Hurricane Dennis, which ripped through the Caribbean during the first week of July 2005. Emily's Category 4 status also made 2005 the only year to produce two Category 4 storms before the end of July. ||
Dennis
Hurricane Dennis
Go to this pageThe formation of Hurricane Dennis on July 5 made that the earliest date on record that four named storms formed in the Atlantic basin. Dennis proved to be a powerful and destructive storm in the Caribbean Sea and the Gulf of Mexico. It crossed over Cuba on July 8 and 9, leaving at least 10 dead, and caused additional deaths in Haiti. After re-emerging over open water, Dennis re-strengthened into a dangerous Category 4 hurricane with top wind speeds of 233 kilometers per hour (145 mph). The storm passed within 90 kilometers (55 miles) of Pensacola, Florida, and hit land about 80 kilometers (50 miles) east of where Hurricane Ivan struck in September, 2004. A large storm surge of more than 10 feet was created in certain areas, and many homes and businesses in low-lying areas were flooded. ||
Progression of Hurricane Dennis, 2005 (WMS)
Go to this pageThe formation of Hurricane Dennis on July 5 made that the earliest date on record that four named storms formed in the Atlantic basin. Dennis proved to be a powerful and destructive storm in the Caribbean Sea and the Gulf of Mexico. It crossed over Cuba on July 8 and 9, leaving at least 10 dead, and caused additional deaths in Haiti. After re-emerging over open water, Dennis re-strengthened into a dangerous Category 4 hurricane with top wind speeds of 233 kilometers per hour (145 mph). The storm passed within 90 kilometers (55 miles) of Pensacola, Florida, and hit land about 80 kilometers (50 miles) east of where Hurricane Ivan struck in September, 2004. A large storm surge of more than 10 feet was created in certain areas, and many homes and businesses in low-lying areas were flooded. ||
Hurricane Dennis on July 6, 2005
Go to this pageThe TRMM spacecraft captured this view of Hurricane Dennis as it passed just south of the Island of Hispaniola and headed for Cuba. || This is the view of Hurricane Dennis scene by the TRMM spacecraft on July 6, 2005 at 2i30Z. || TRMM_050706T21.jpg (720x486) [70.5 KB] || TRMM_050706T21_web.jpg (320x216) [42.1 KB] || TRMM_050706T21_thm.png (80x40) [5.9 KB] || TRMM_050706T21_web_searchweb.jpg (320x180) [100.8 KB] || TRMM_050706T21.tif (720x486) [419.4 KB] ||


