2006 Hurricane Season
Visuals
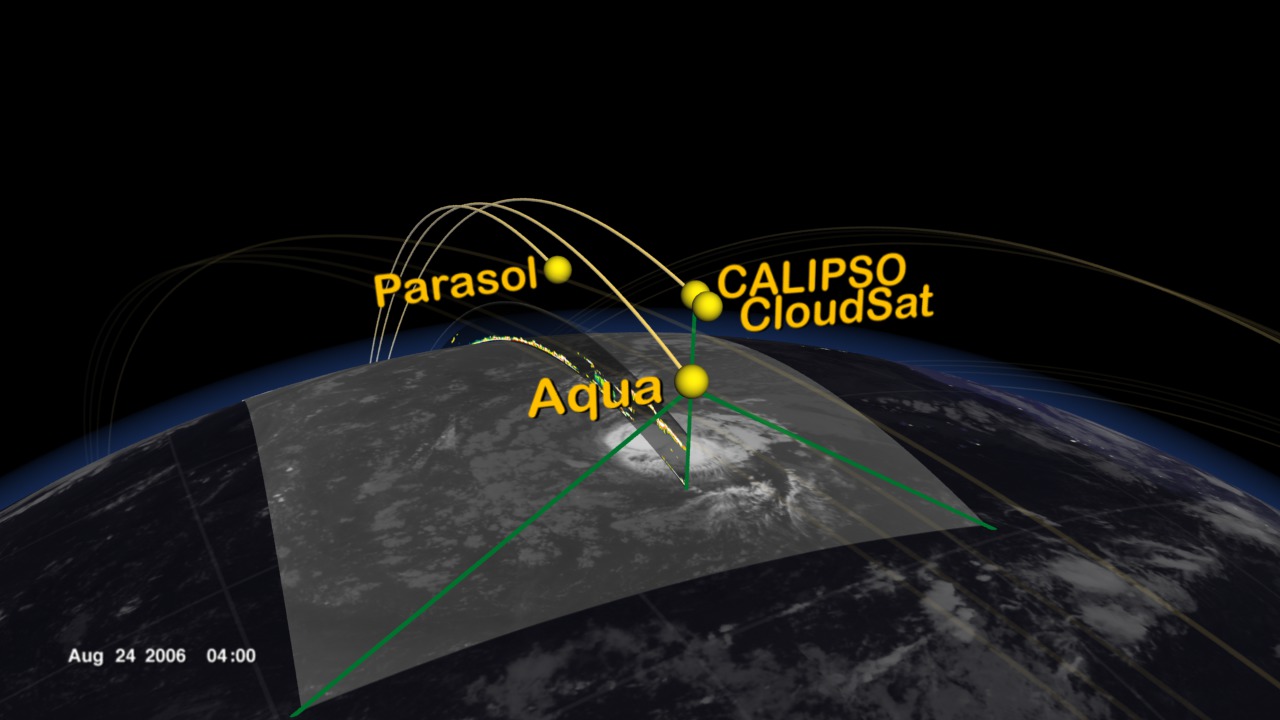
The A-Train Observes Tropical Storm Debby
Go to this pageThe A-Train is a group of spacecraft flying in close formation allowing data taken by each instrument to be correlated to the other instruments providing data synergy. The A-Train includes Aqua, CloudSat, CALIPSO, Parasol, and Aura. The animation begins showing the Earth with moving clouds and with a day/night terminator. Time slows down, and A-train spacecraft orbits are added during a daytime pass. The orbits progress around the globe for 12 hours. During a night time pass the camera zooms into Tropical Storm Debby as the A-train flies over on August 24, 2006. Data sets from some of the A-train's spacecraft/instruments are shown including Aqua/MODIS, CloudSat, CALIPSO, and Aqua/AIRS. This visualization was created to support an A-Train session at the 2007 International Geoscience and Remote Sensing Symposium (IGARSS). ||
CloudSat, Calipso and MODIS over Central America
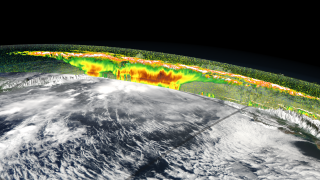
Go to this pageAssociated with tropical thunderstorms are broad fields of cirrus clouds that flow out of the tops of the vigorous storm systems that form over warm tropical oceans. These clouds play a role in how much infrared energy is trapped in Earth's atmosphere. NASA's Tropical Composition, Cloud and Climate Coupling (TC4) mission, which runs from July 16, 2007 through August 8, 2007, aims to document the full lifecycle of these clouds. Observations from four A-Train satellites flying in formation will complement the aircraft measurements with large-scale views of many different features of the atmosphere. Observations from this mission along with previous studies will improve our understanding of what effect a warming climate with rising ocean temperatures will have on these cloud systems. These images over Central America, produced in support of the TC4 mission, show a tropical storm system over Central and South America on August 2, 2006 as measured from multiple satellite sensors, including Aqua MODIS, CloudSat and CALIPSO. In this view from the Pacific Ocean, Panama is on the left and South America is shown on the right. In the following series of still images, each satellite's measurement is shown individually and in combination with the others from the same camera viewpoint. The profile showing CloudSat and CALIPSO data is truncated at a height of twenty kilometers and exaggerated ten times. The land topography is also exaggerated by a factor of ten. ||
Atlantic Hurricane/Storm Summary
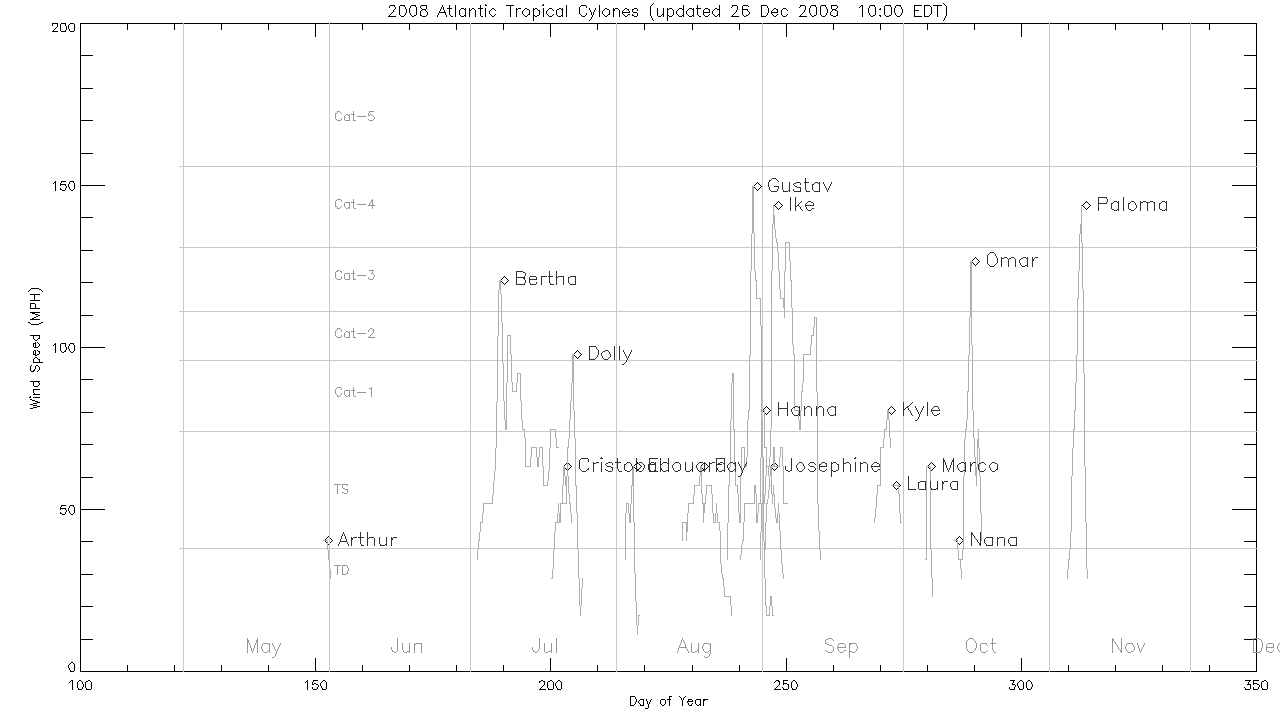
Go to this pageThese still images shows plots of time vs. wind speed for each tropical storm/hurricane of the Atlantic Hurricane seasons. Horizontal lines indicate wind speed category thresholds. A line plot for each storm shows the storm's name and a marker at the peak wind speed.The plot for the current year automatically updates every 2 hours during hurricane season. || 2018 Atlantic hurricanes and storms || hurricane_plot2018.gif (1280x720) [15.0 KB] ||


