2007 Hurricane Season
Visuals
Atlantic Hurricane/Storm Summary
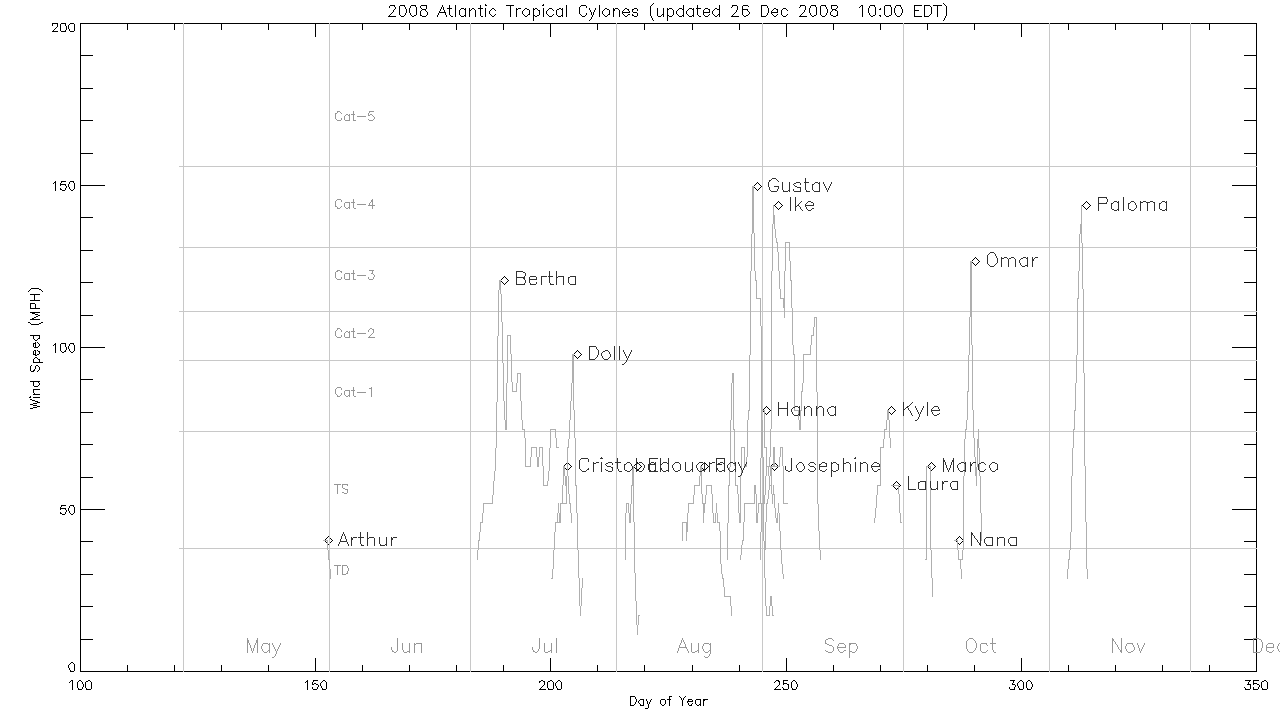
Go to this pageThese still images shows plots of time vs. wind speed for each tropical storm/hurricane of the Atlantic Hurricane seasons. Horizontal lines indicate wind speed category thresholds. A line plot for each storm shows the storm's name and a marker at the peak wind speed.The plot for the current year automatically updates every 2 hours during hurricane season. || 2018 Atlantic hurricanes and storms || hurricane_plot2018.gif (1280x720) [15.0 KB] ||
Hurricane Dean on August 21, 2007
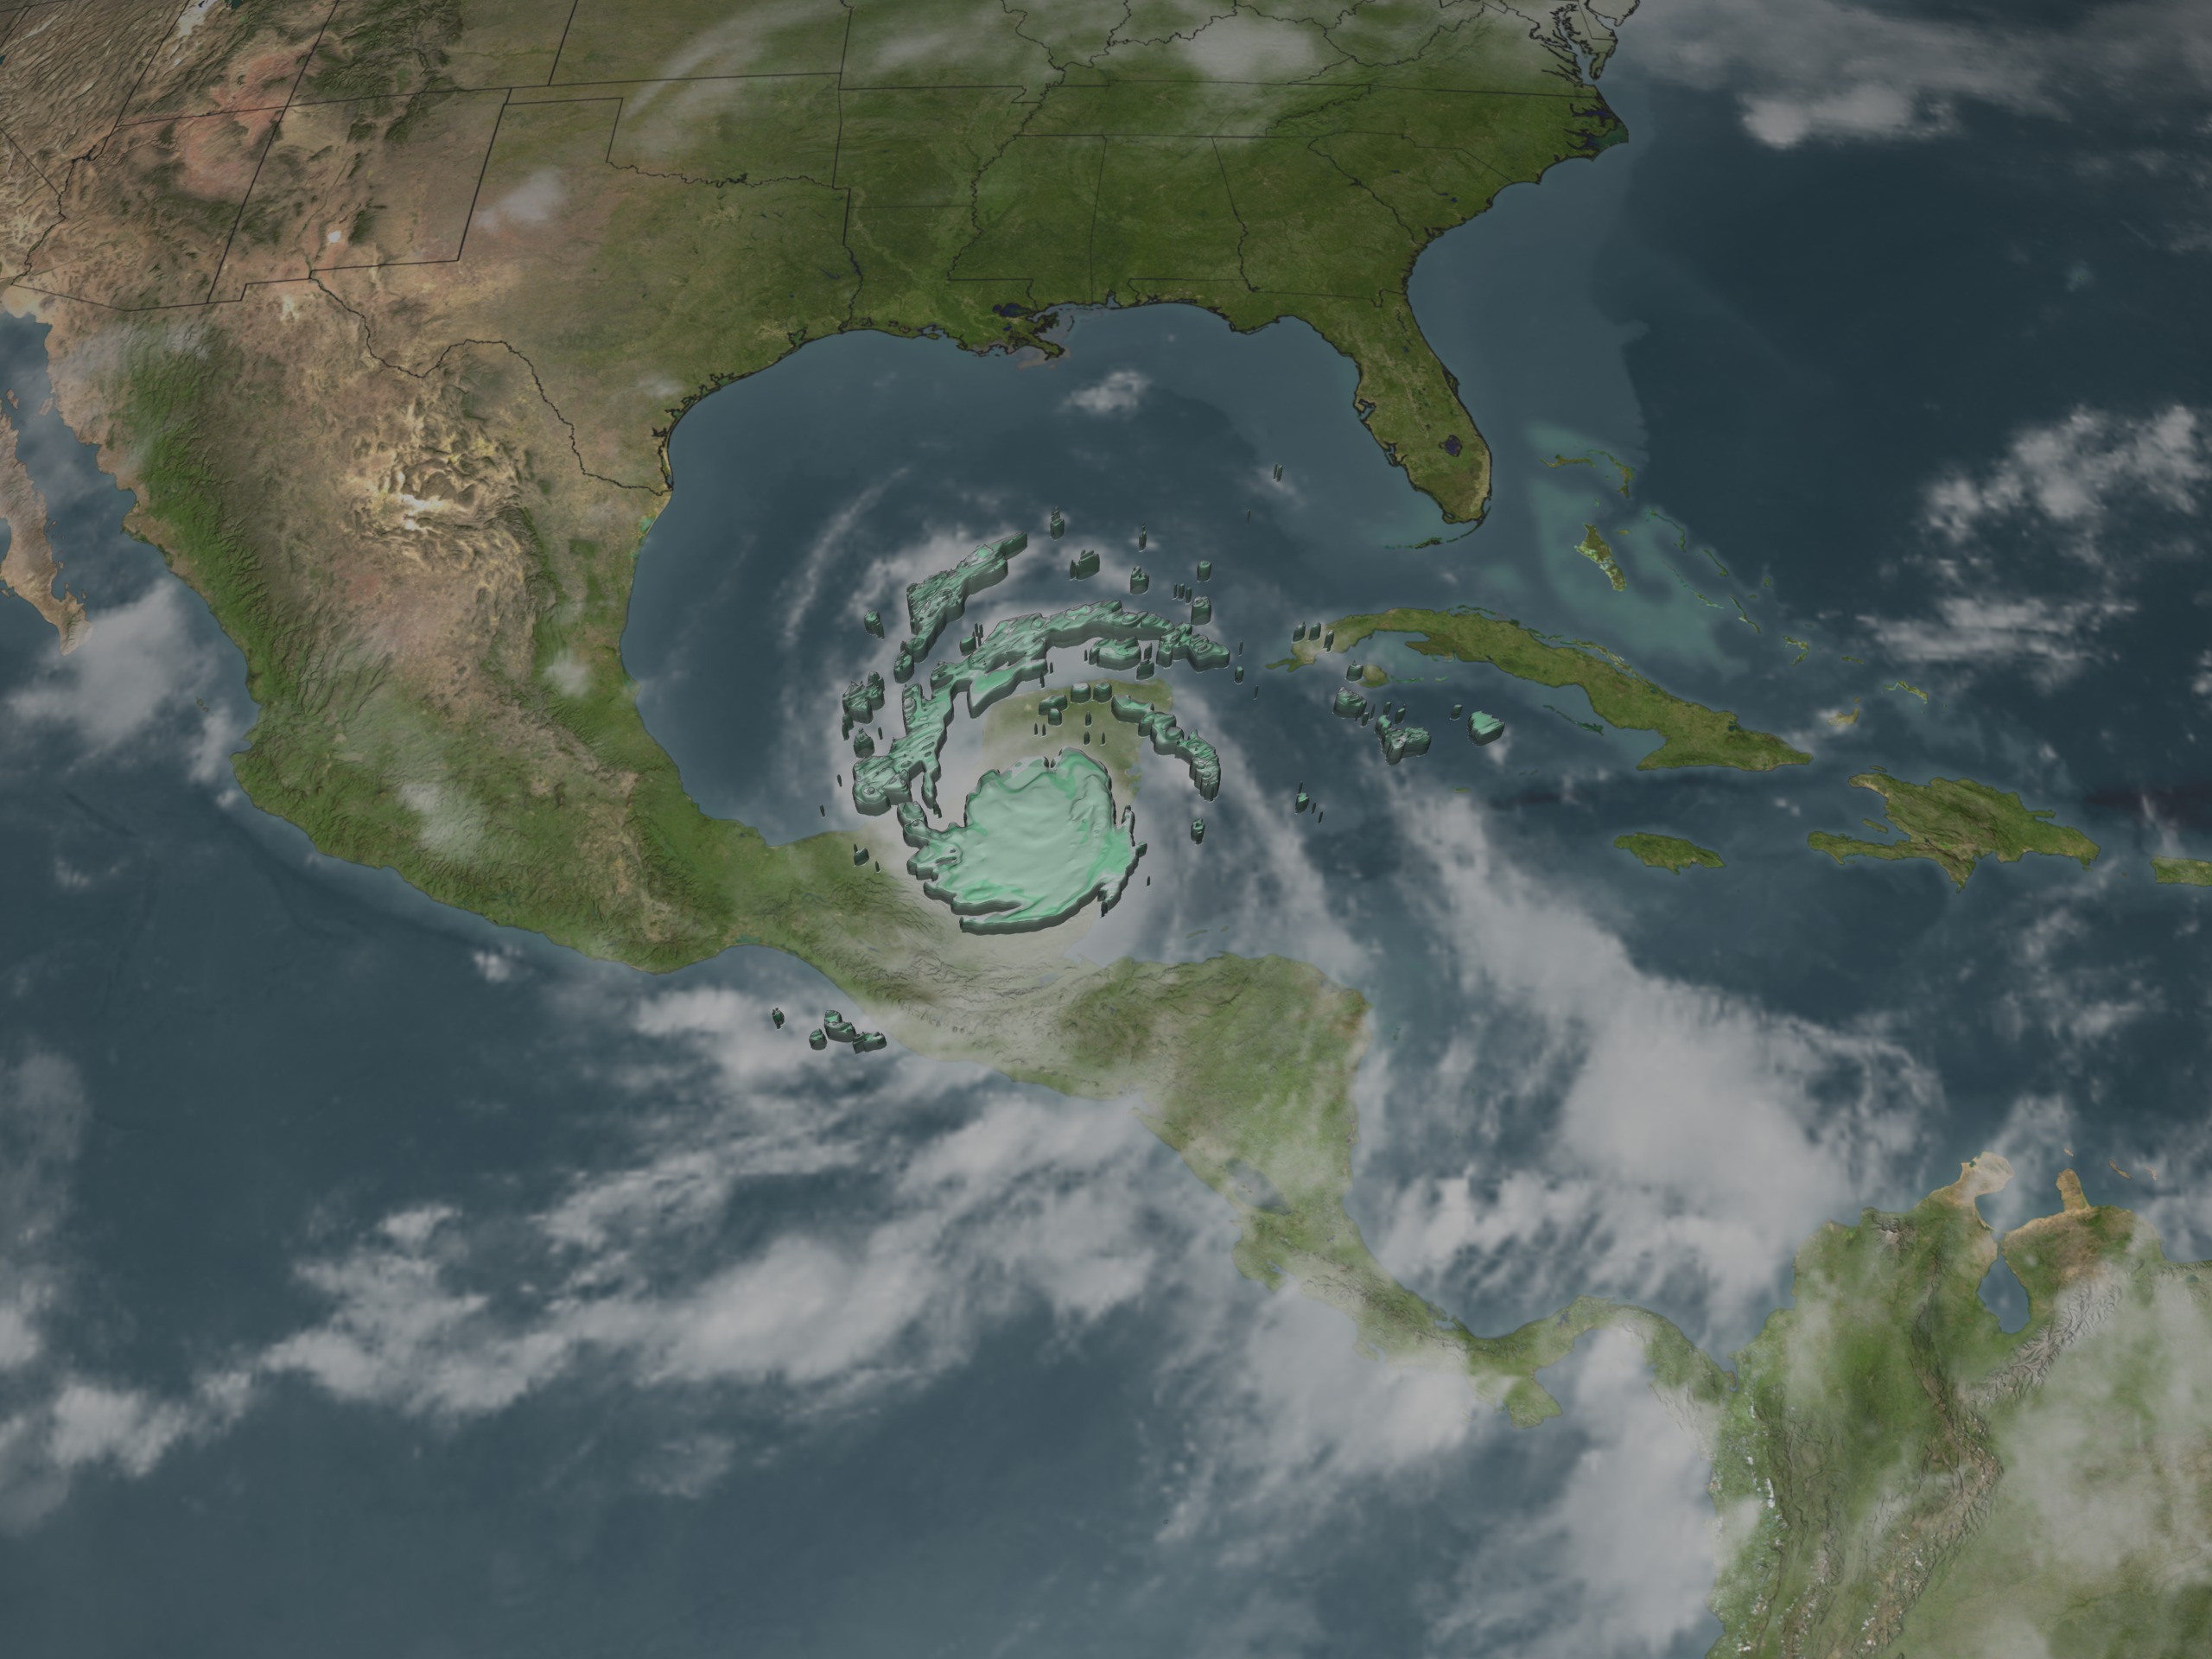
Go to this pageNASA's TRMM spacecraft observed this view of Hurricane Dean on August 21, 2007. At this time the storm was classified as a category two with sustained winds of 90 knots (103.7 mph). The cloud cover is taken by TRMM's Visible and Infrared Scanner (VIRS) and the GOES spacecraft. The rain structure is taken by TRMM's Tropical Microwave Imager (TMI) and TRMM's Precitation Radar (PR) instruments. TRMM looks underneath of the storm's clouds to reveal the underlying rain structure. Gray represents areas with at least 0.25 inches of rain per hour. Green shows at least 0.5 inches of rain per hour. Yellow is at least 1.0 inches of rain and red is at least 2.0 inches of rain per hour. ||
Hurricane Dean on August 19, 2007
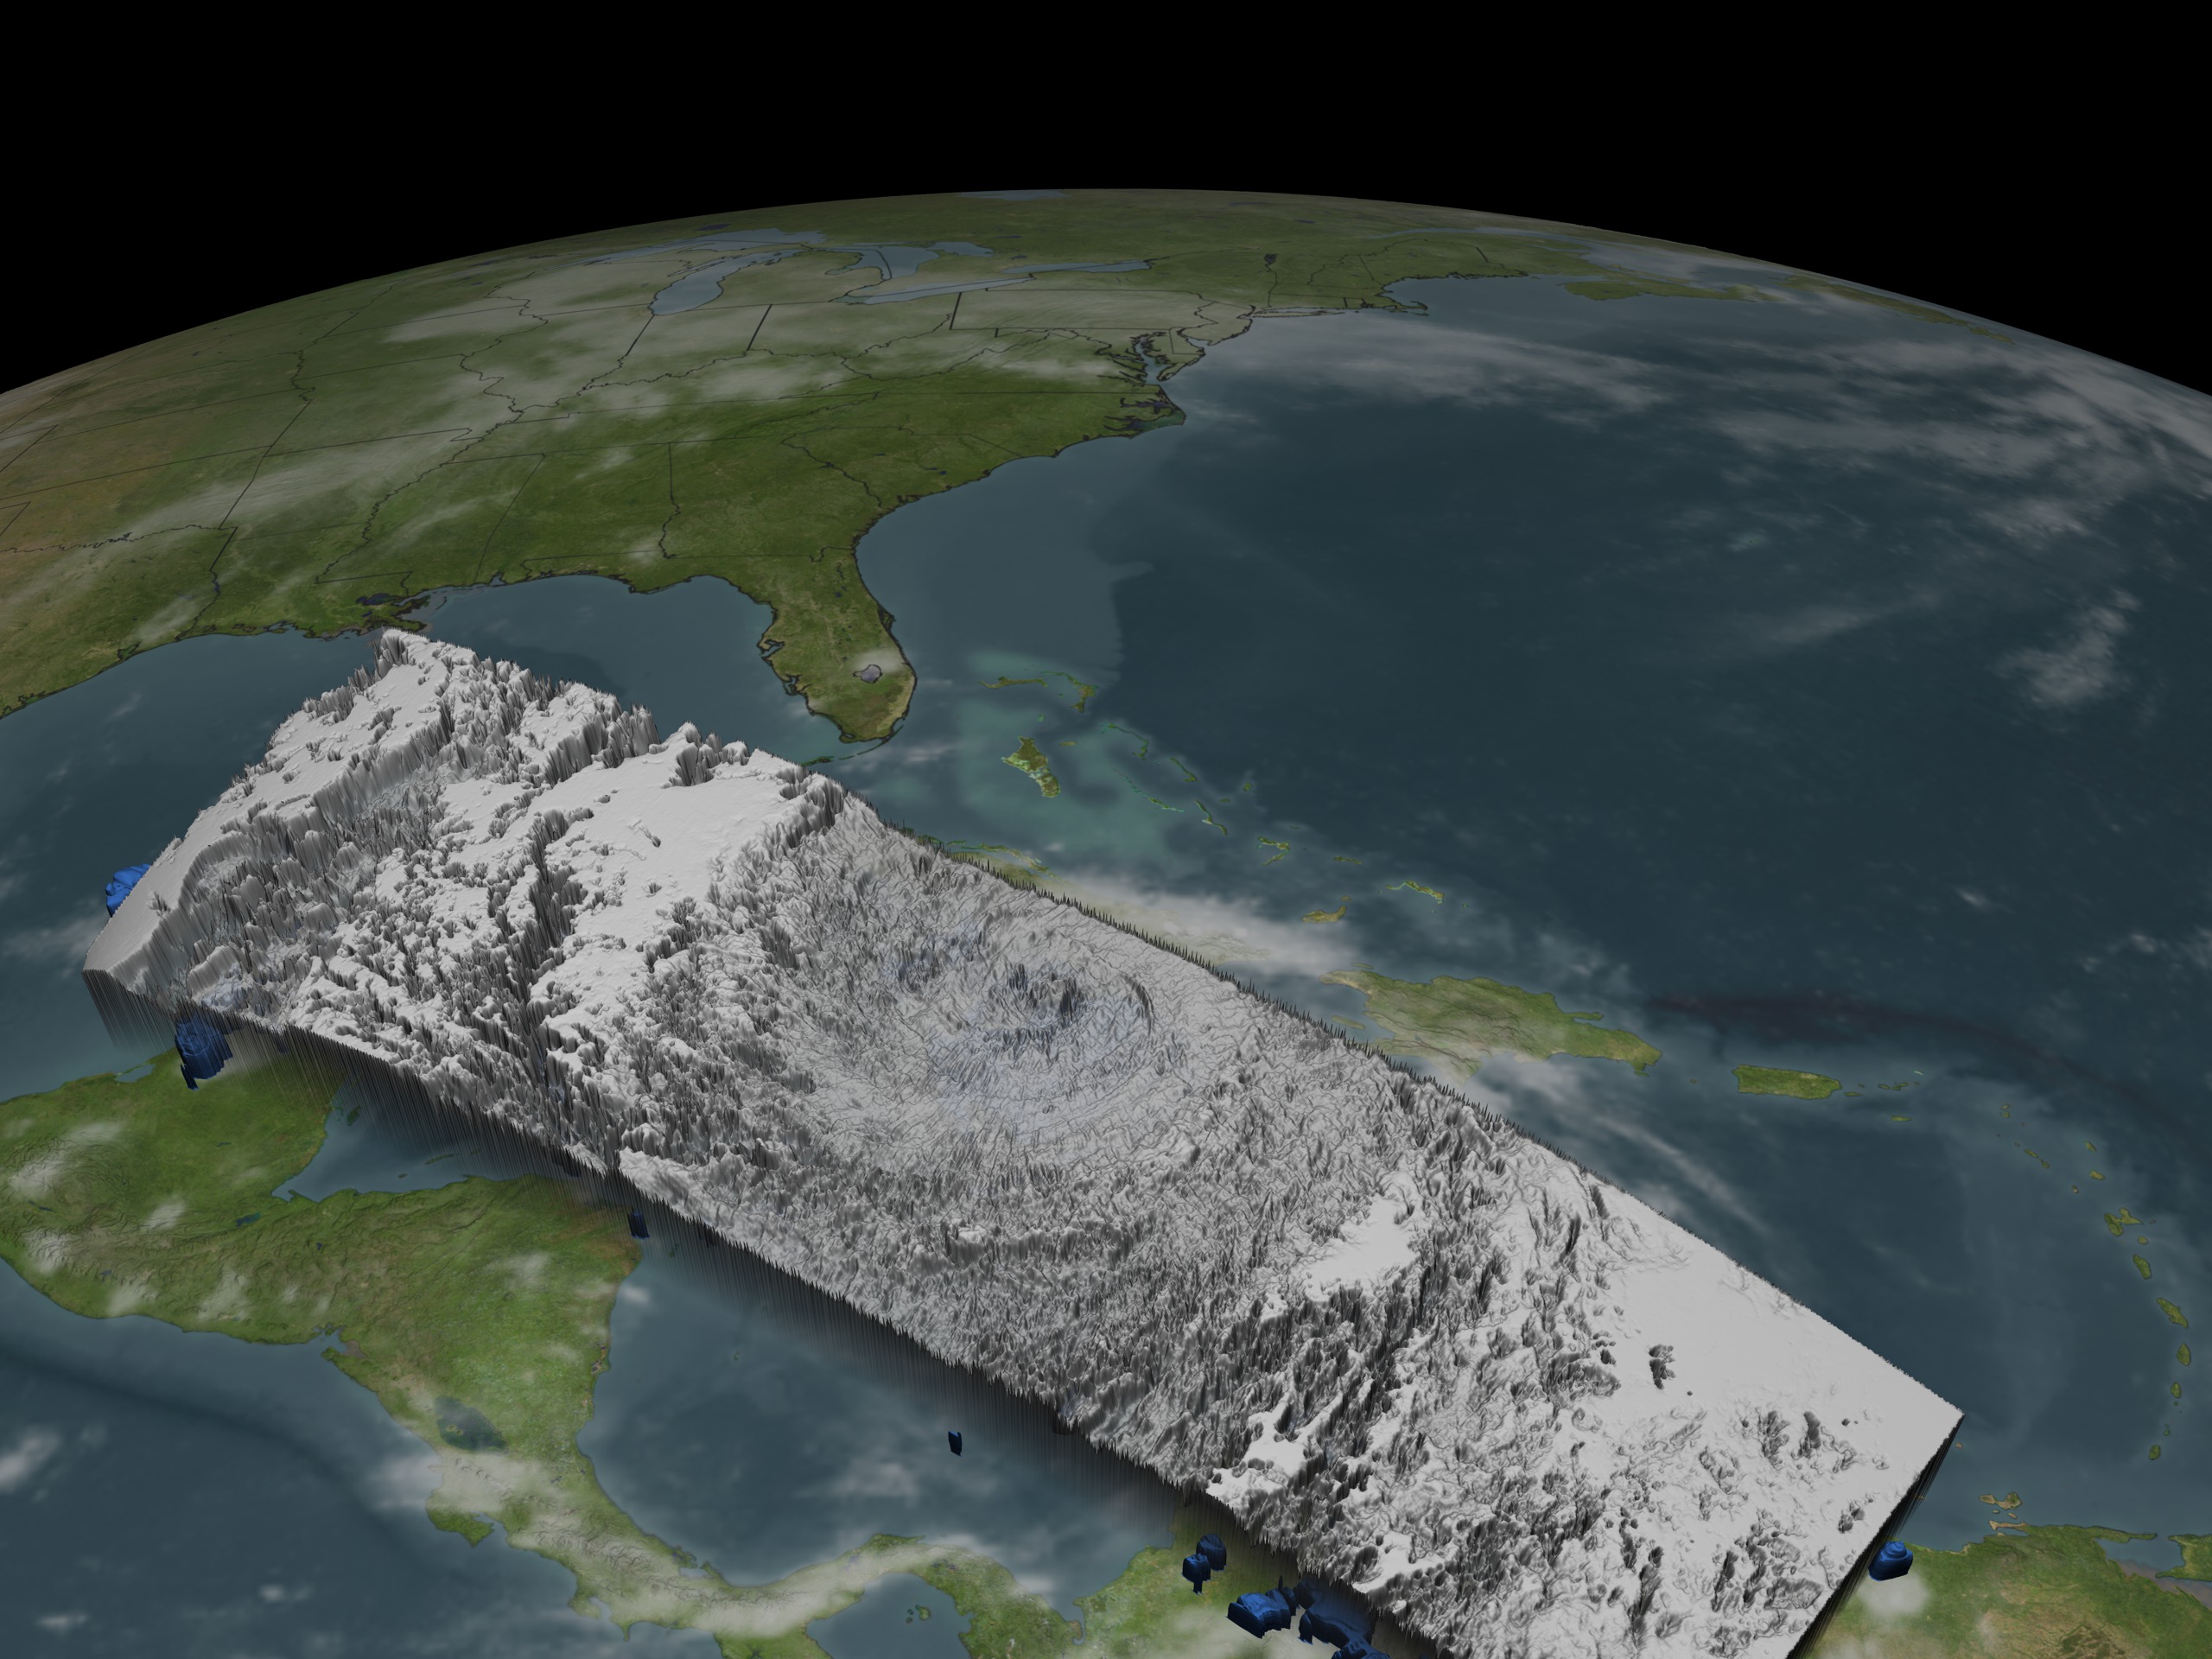
Go to this pageNASA's TRMM spacecraft observed this view of Hurricane Dean on August 19, 2007. At this time the storm was classified as a dangerous category four with sustained winds of 125 knots (138 mph). The cloud cover is taken by TRMM's Visible and Infrared Scanner(VIRS) and the GOES spacecraft. The rain structure is taken by TRMM's Tropical Microwave Imager (TMI) and TRMM's Precitation Radar(PR) instruments. TRMM looks underneath of the storm's clouds to reveal the underlying rain structure. Blue represents areas with at least 0.25 inches of rain per hour. Green shows at least 0.5 inches of rain per hour. Yellow is at least 1.0 inches of rain and red is at least 2.0 inches of rain per hour. ||


