Air Quality Dashboard
Overview
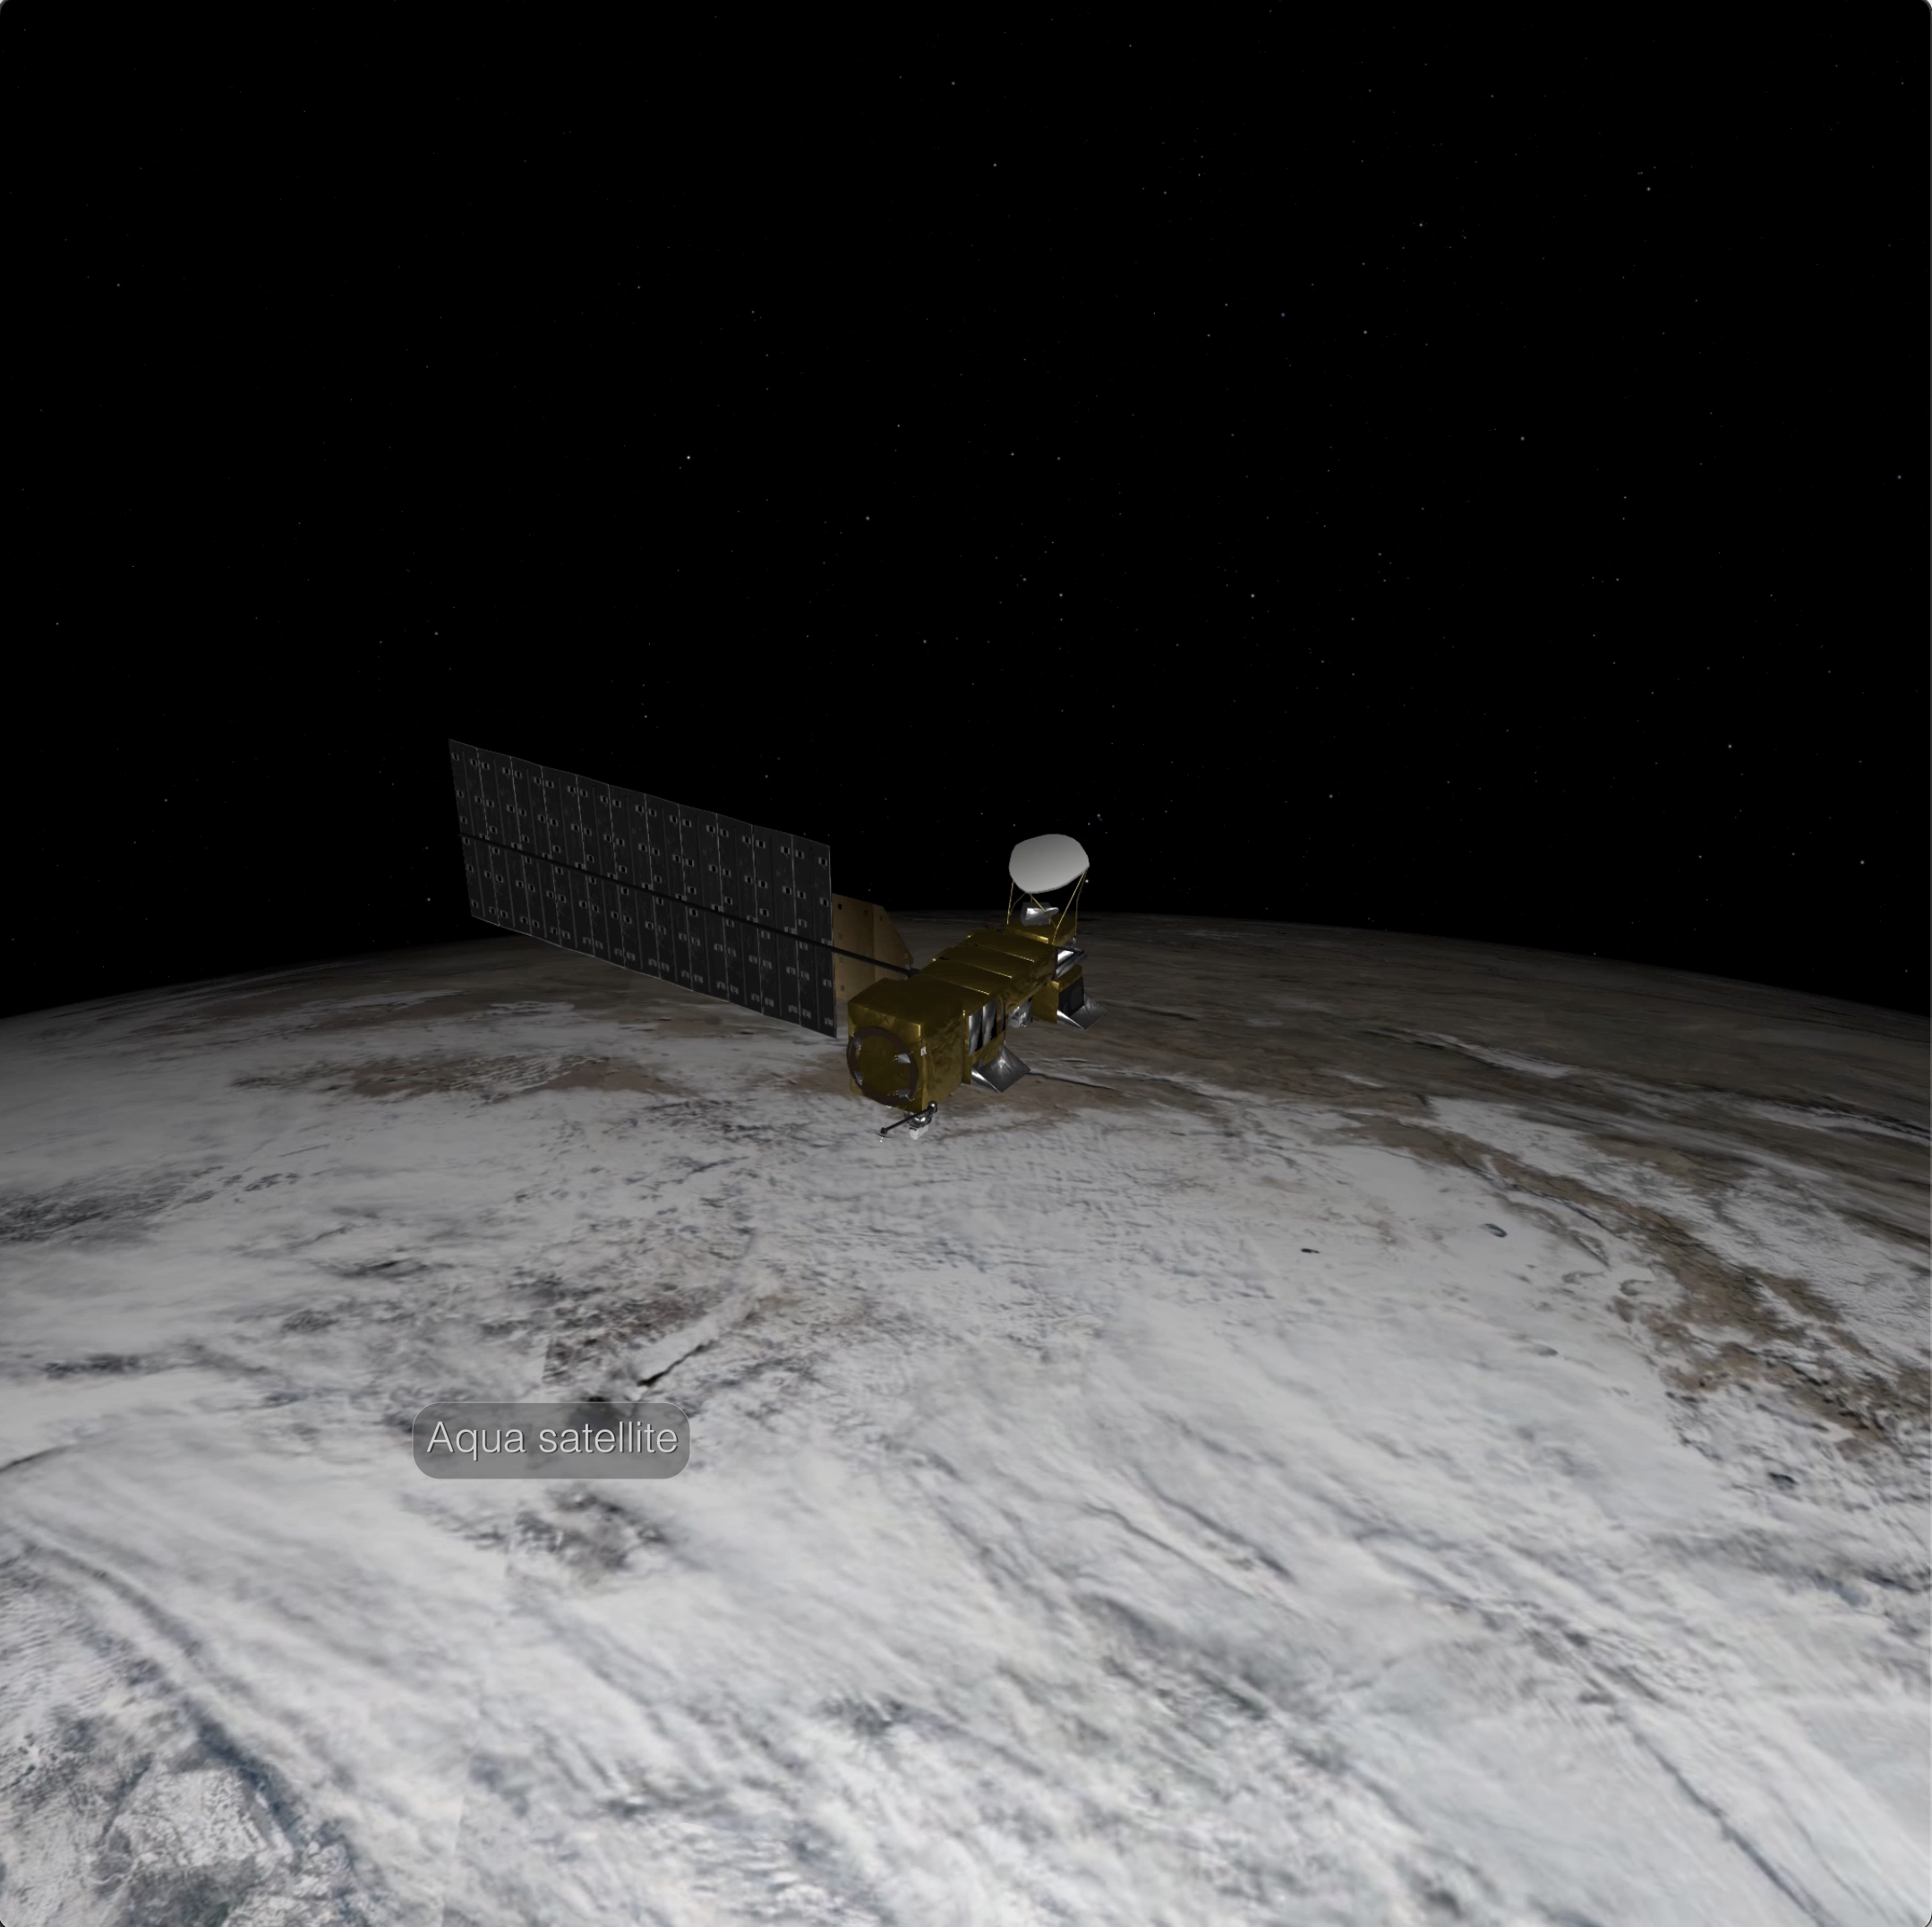
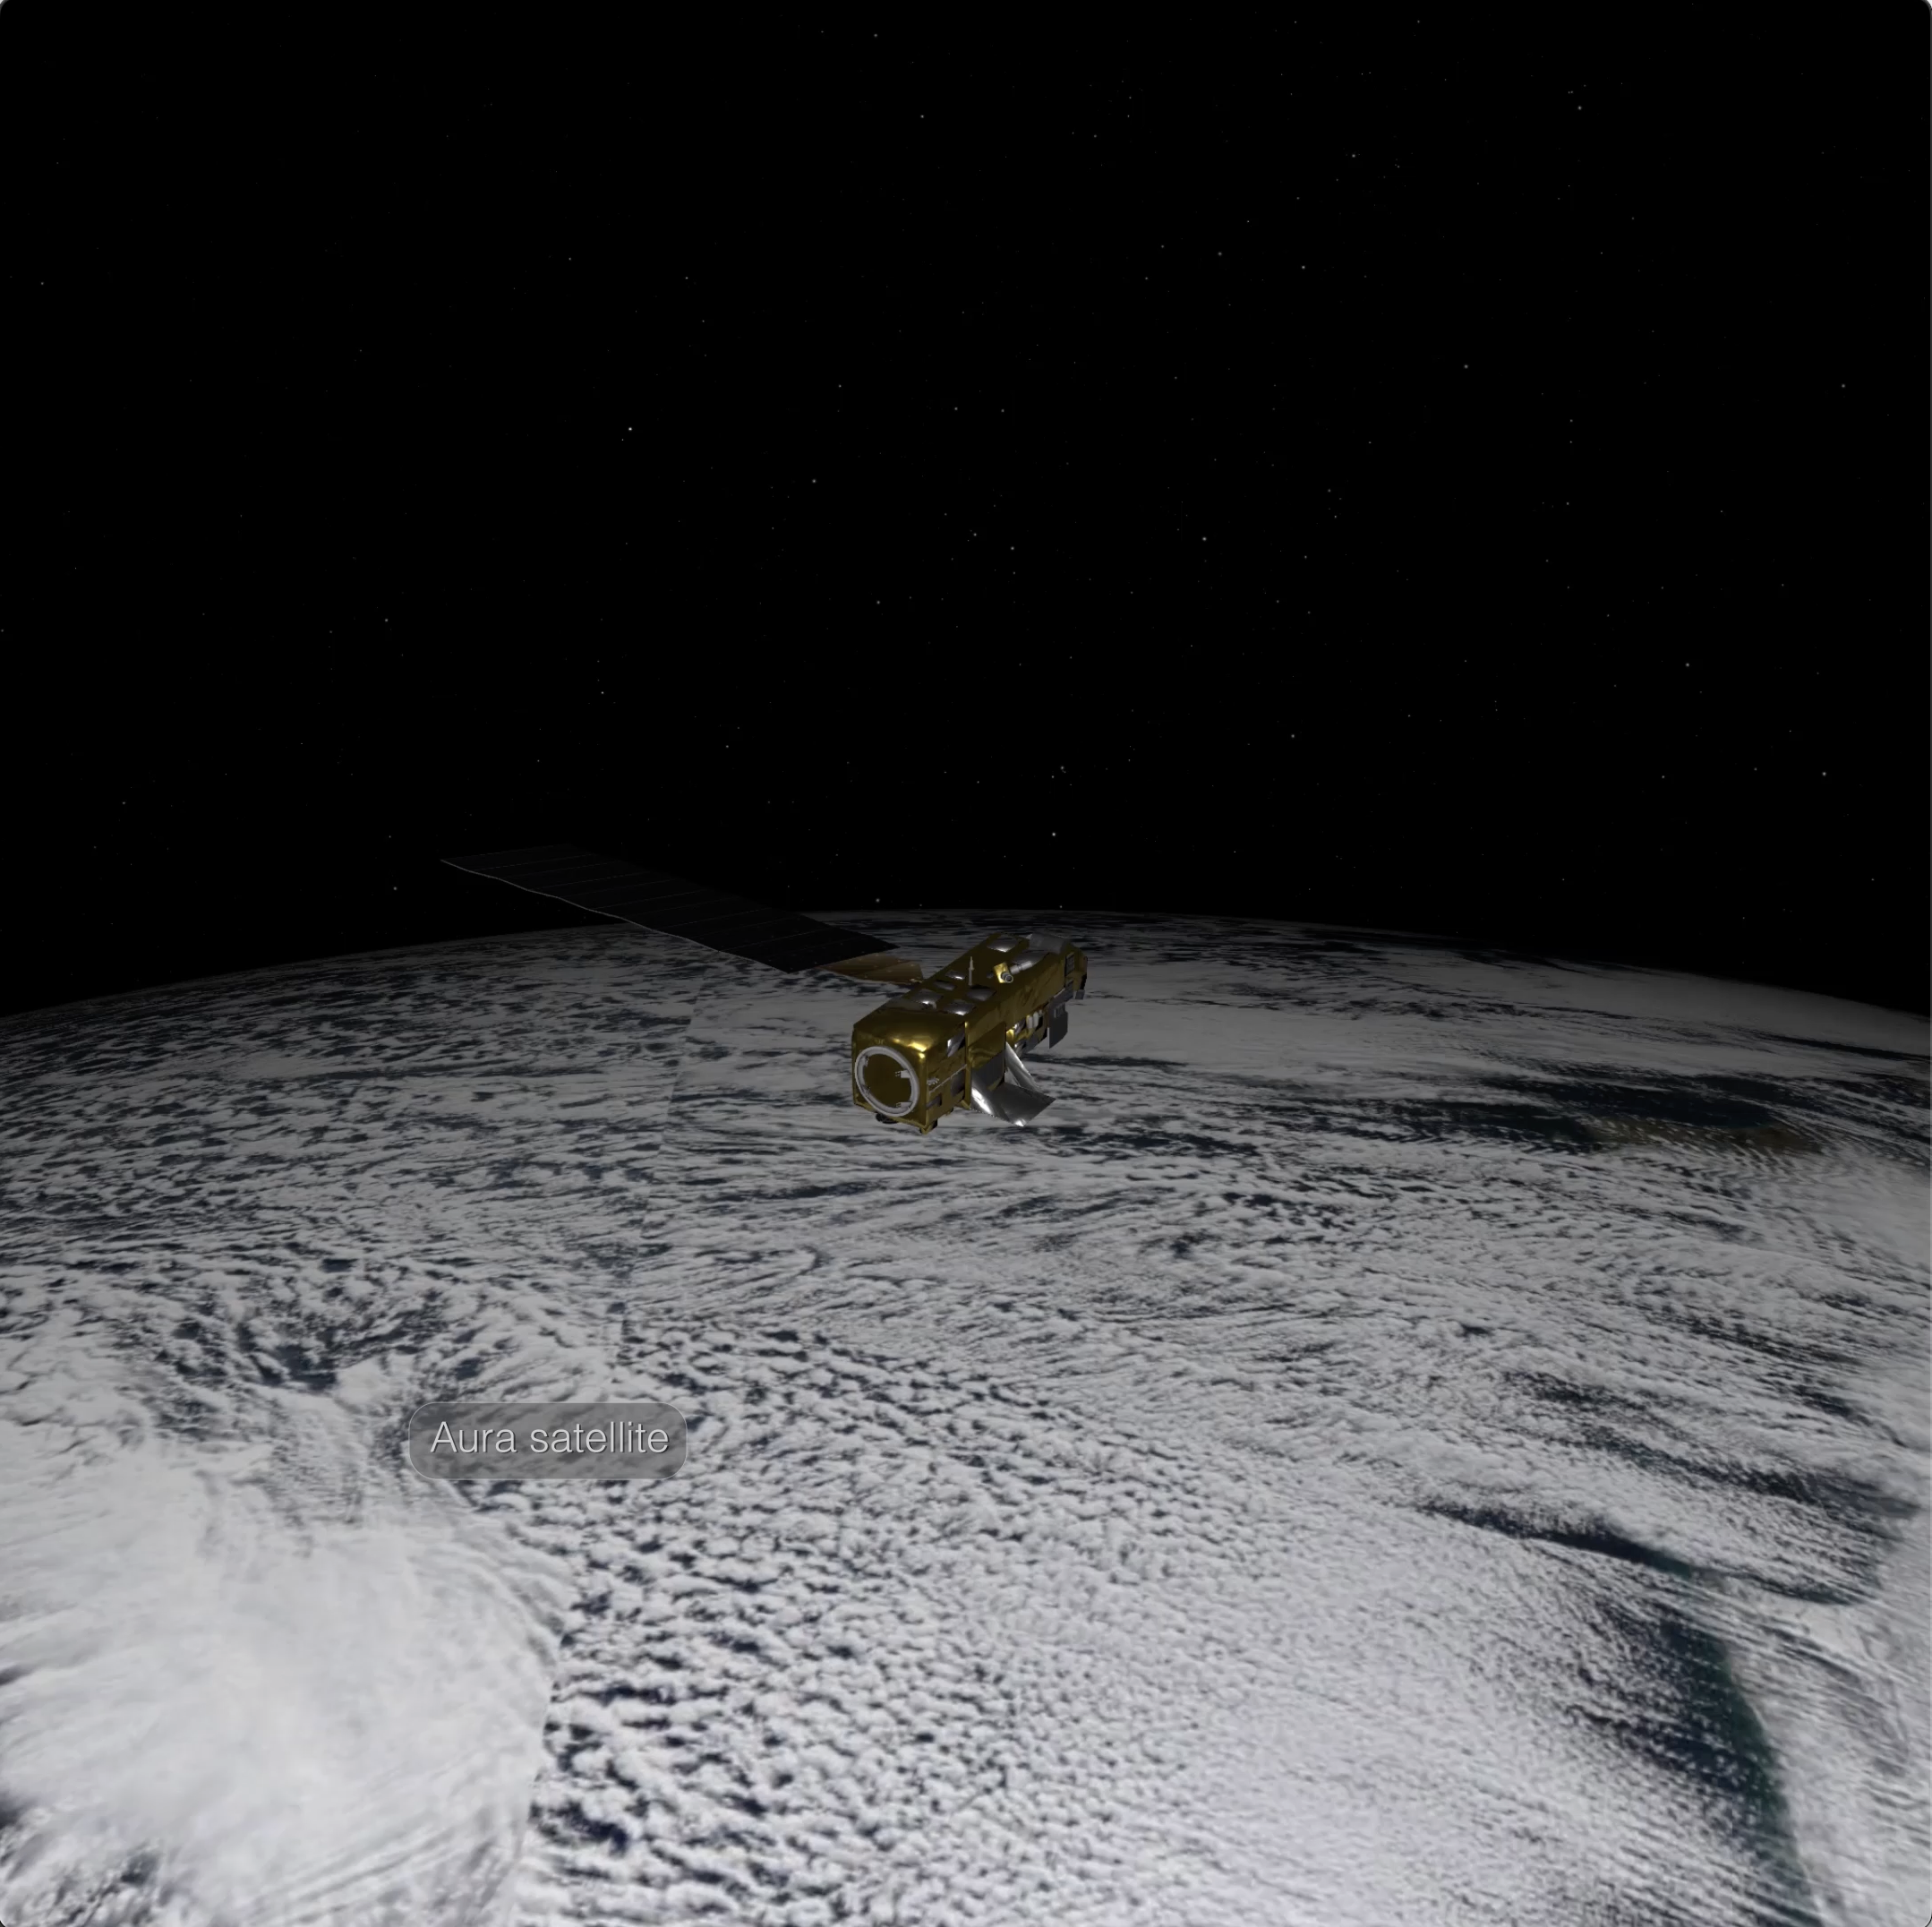
NASA's fleet of Earth observing satellites monitor our planet's oceans, biosphere, and atmosphere. Instruments onboard satellites observe air pollutants around the world. The data collected are used by air quality experts and researchers studying the impact of air pollution on human health.


Worldview Satellite Observations
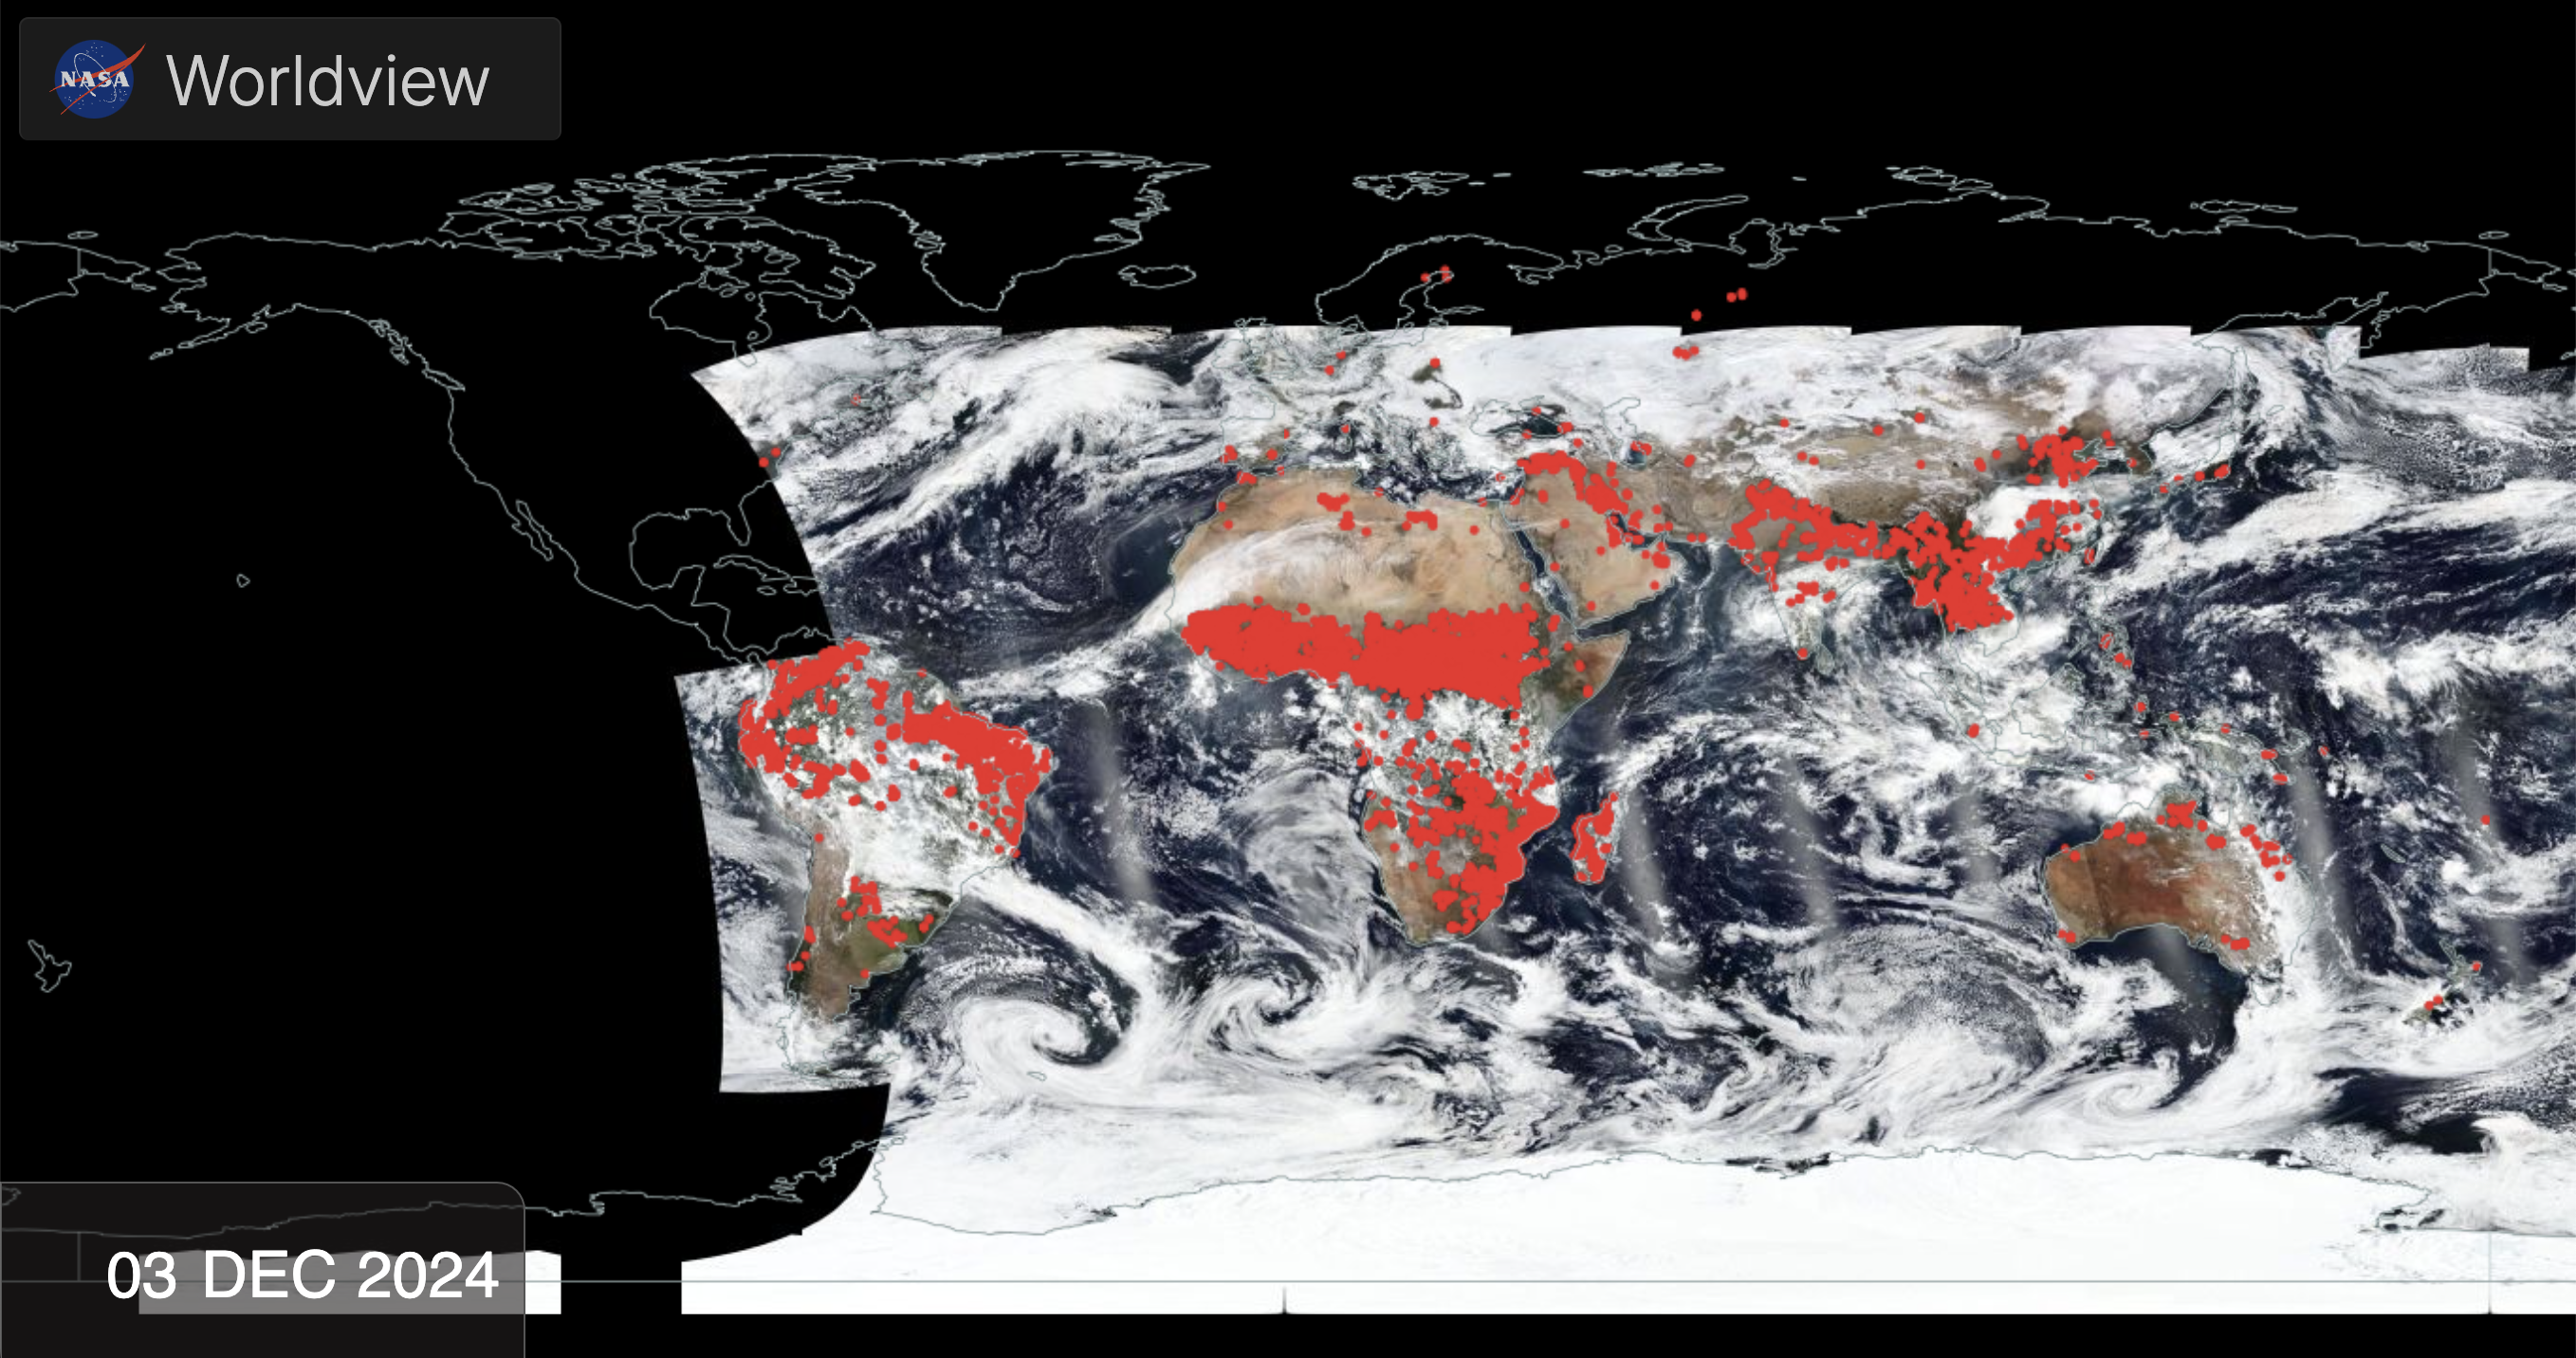
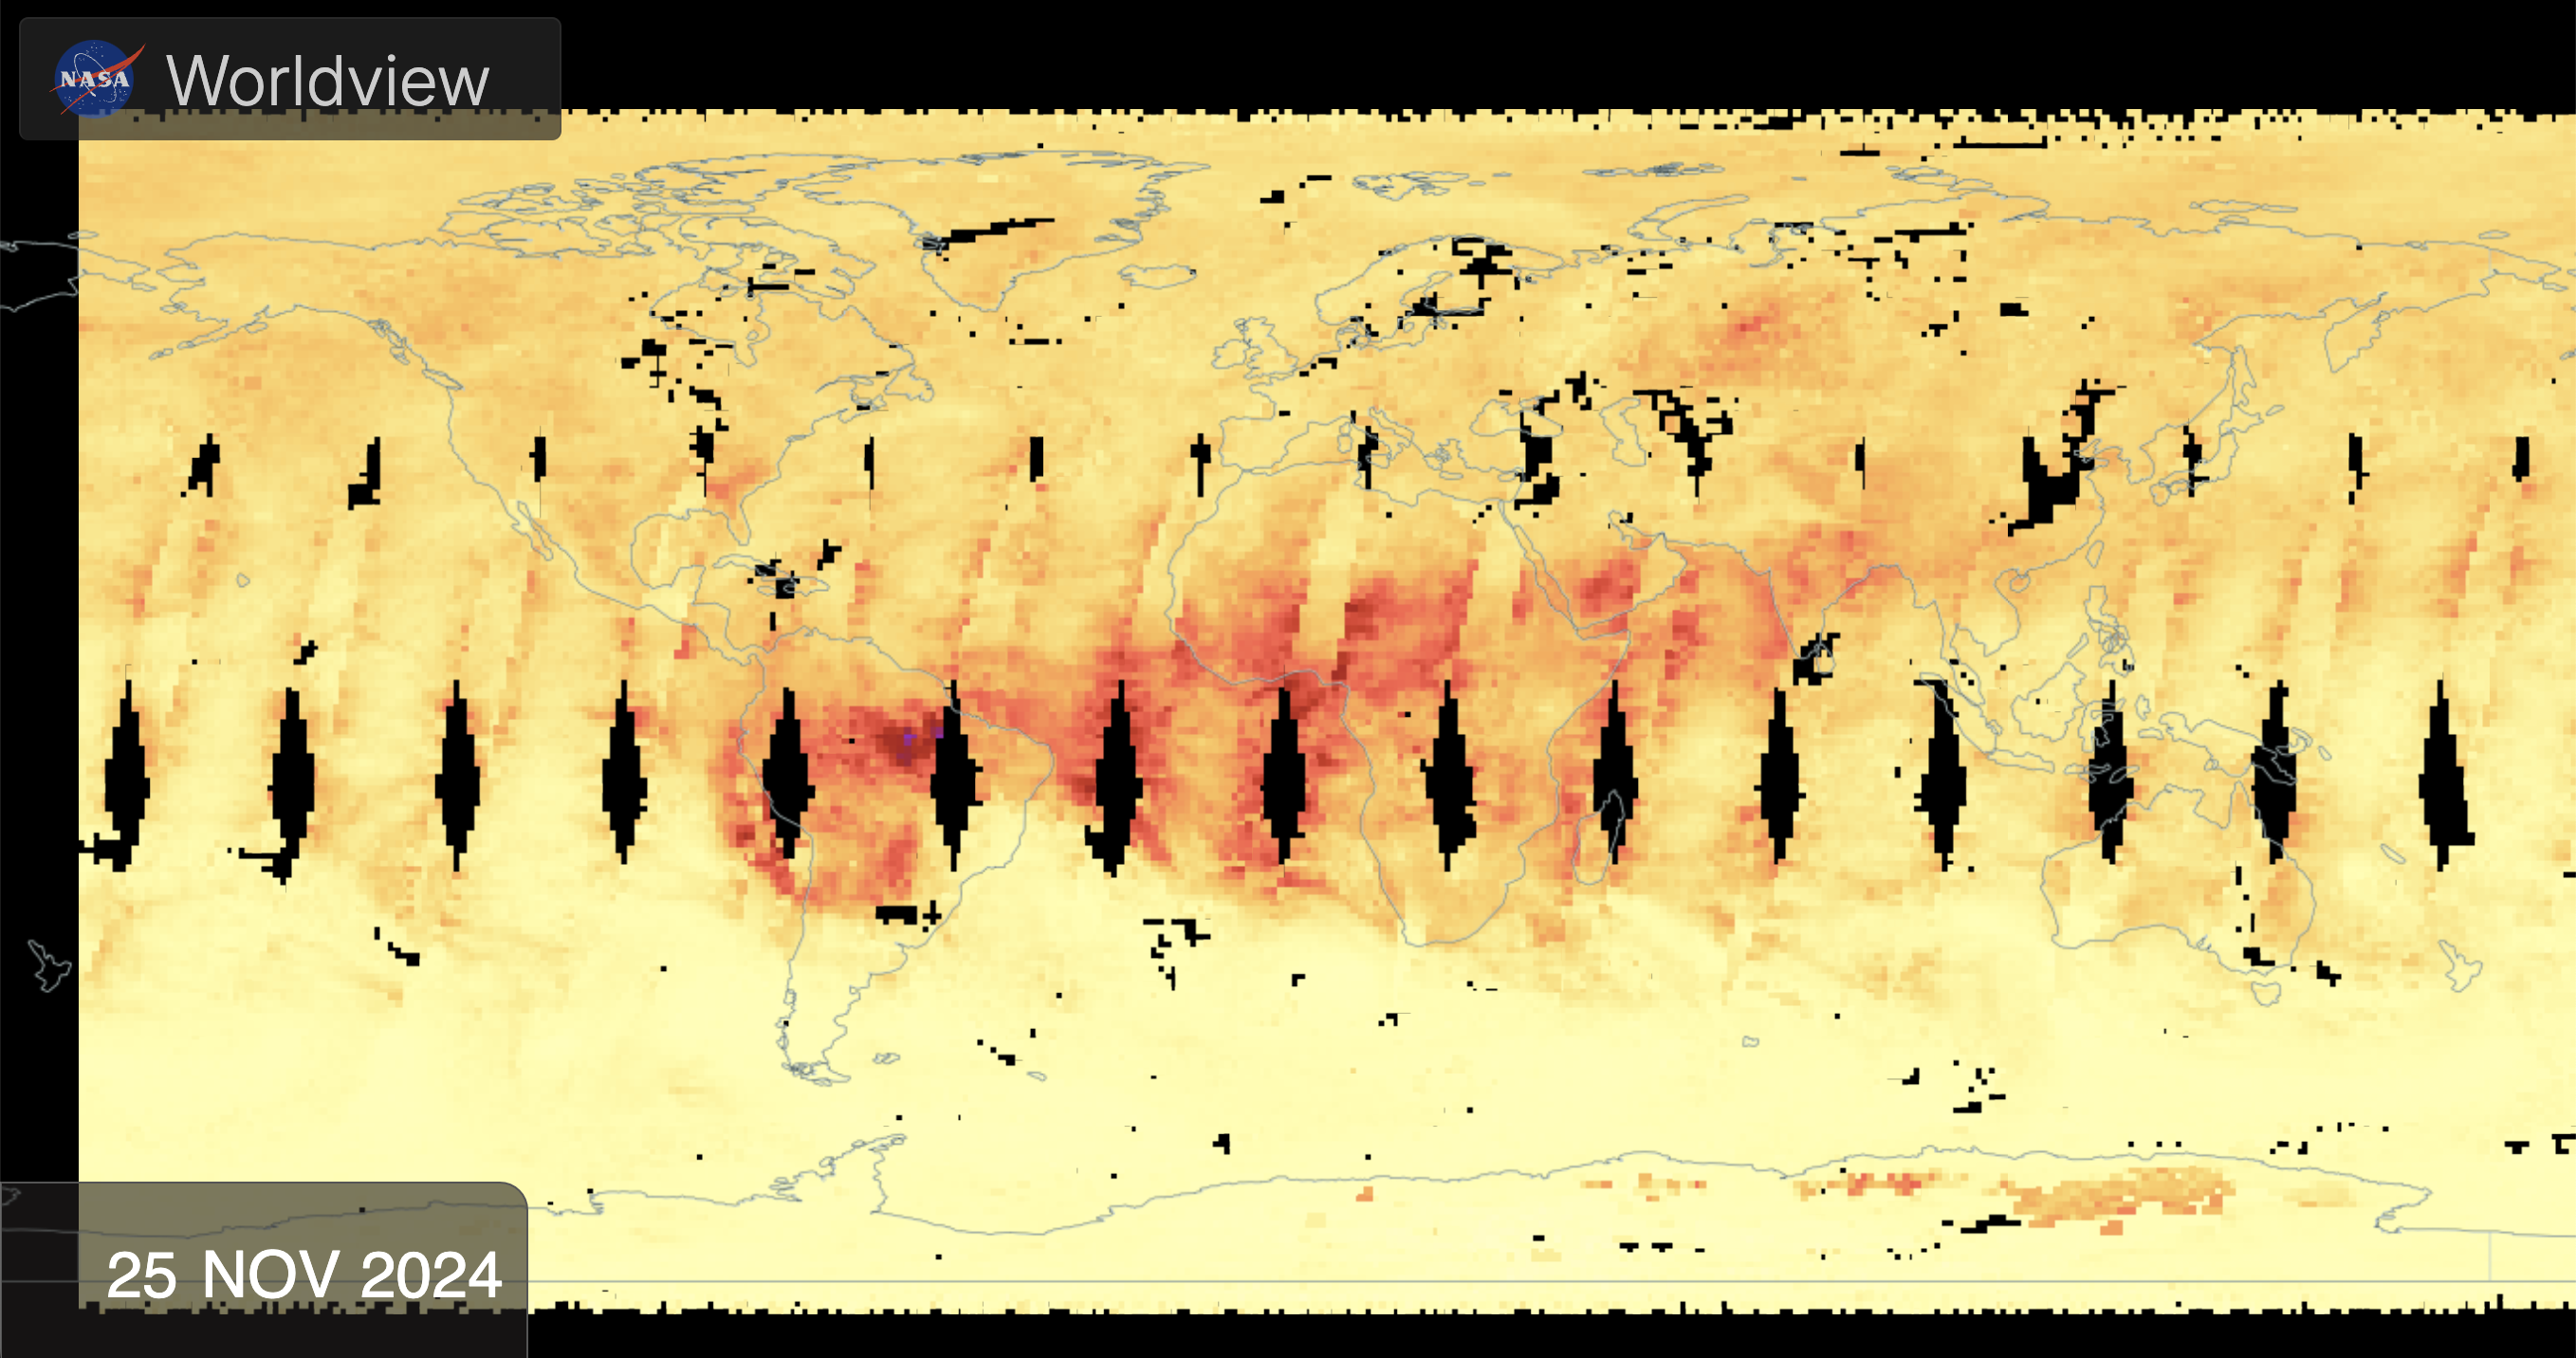
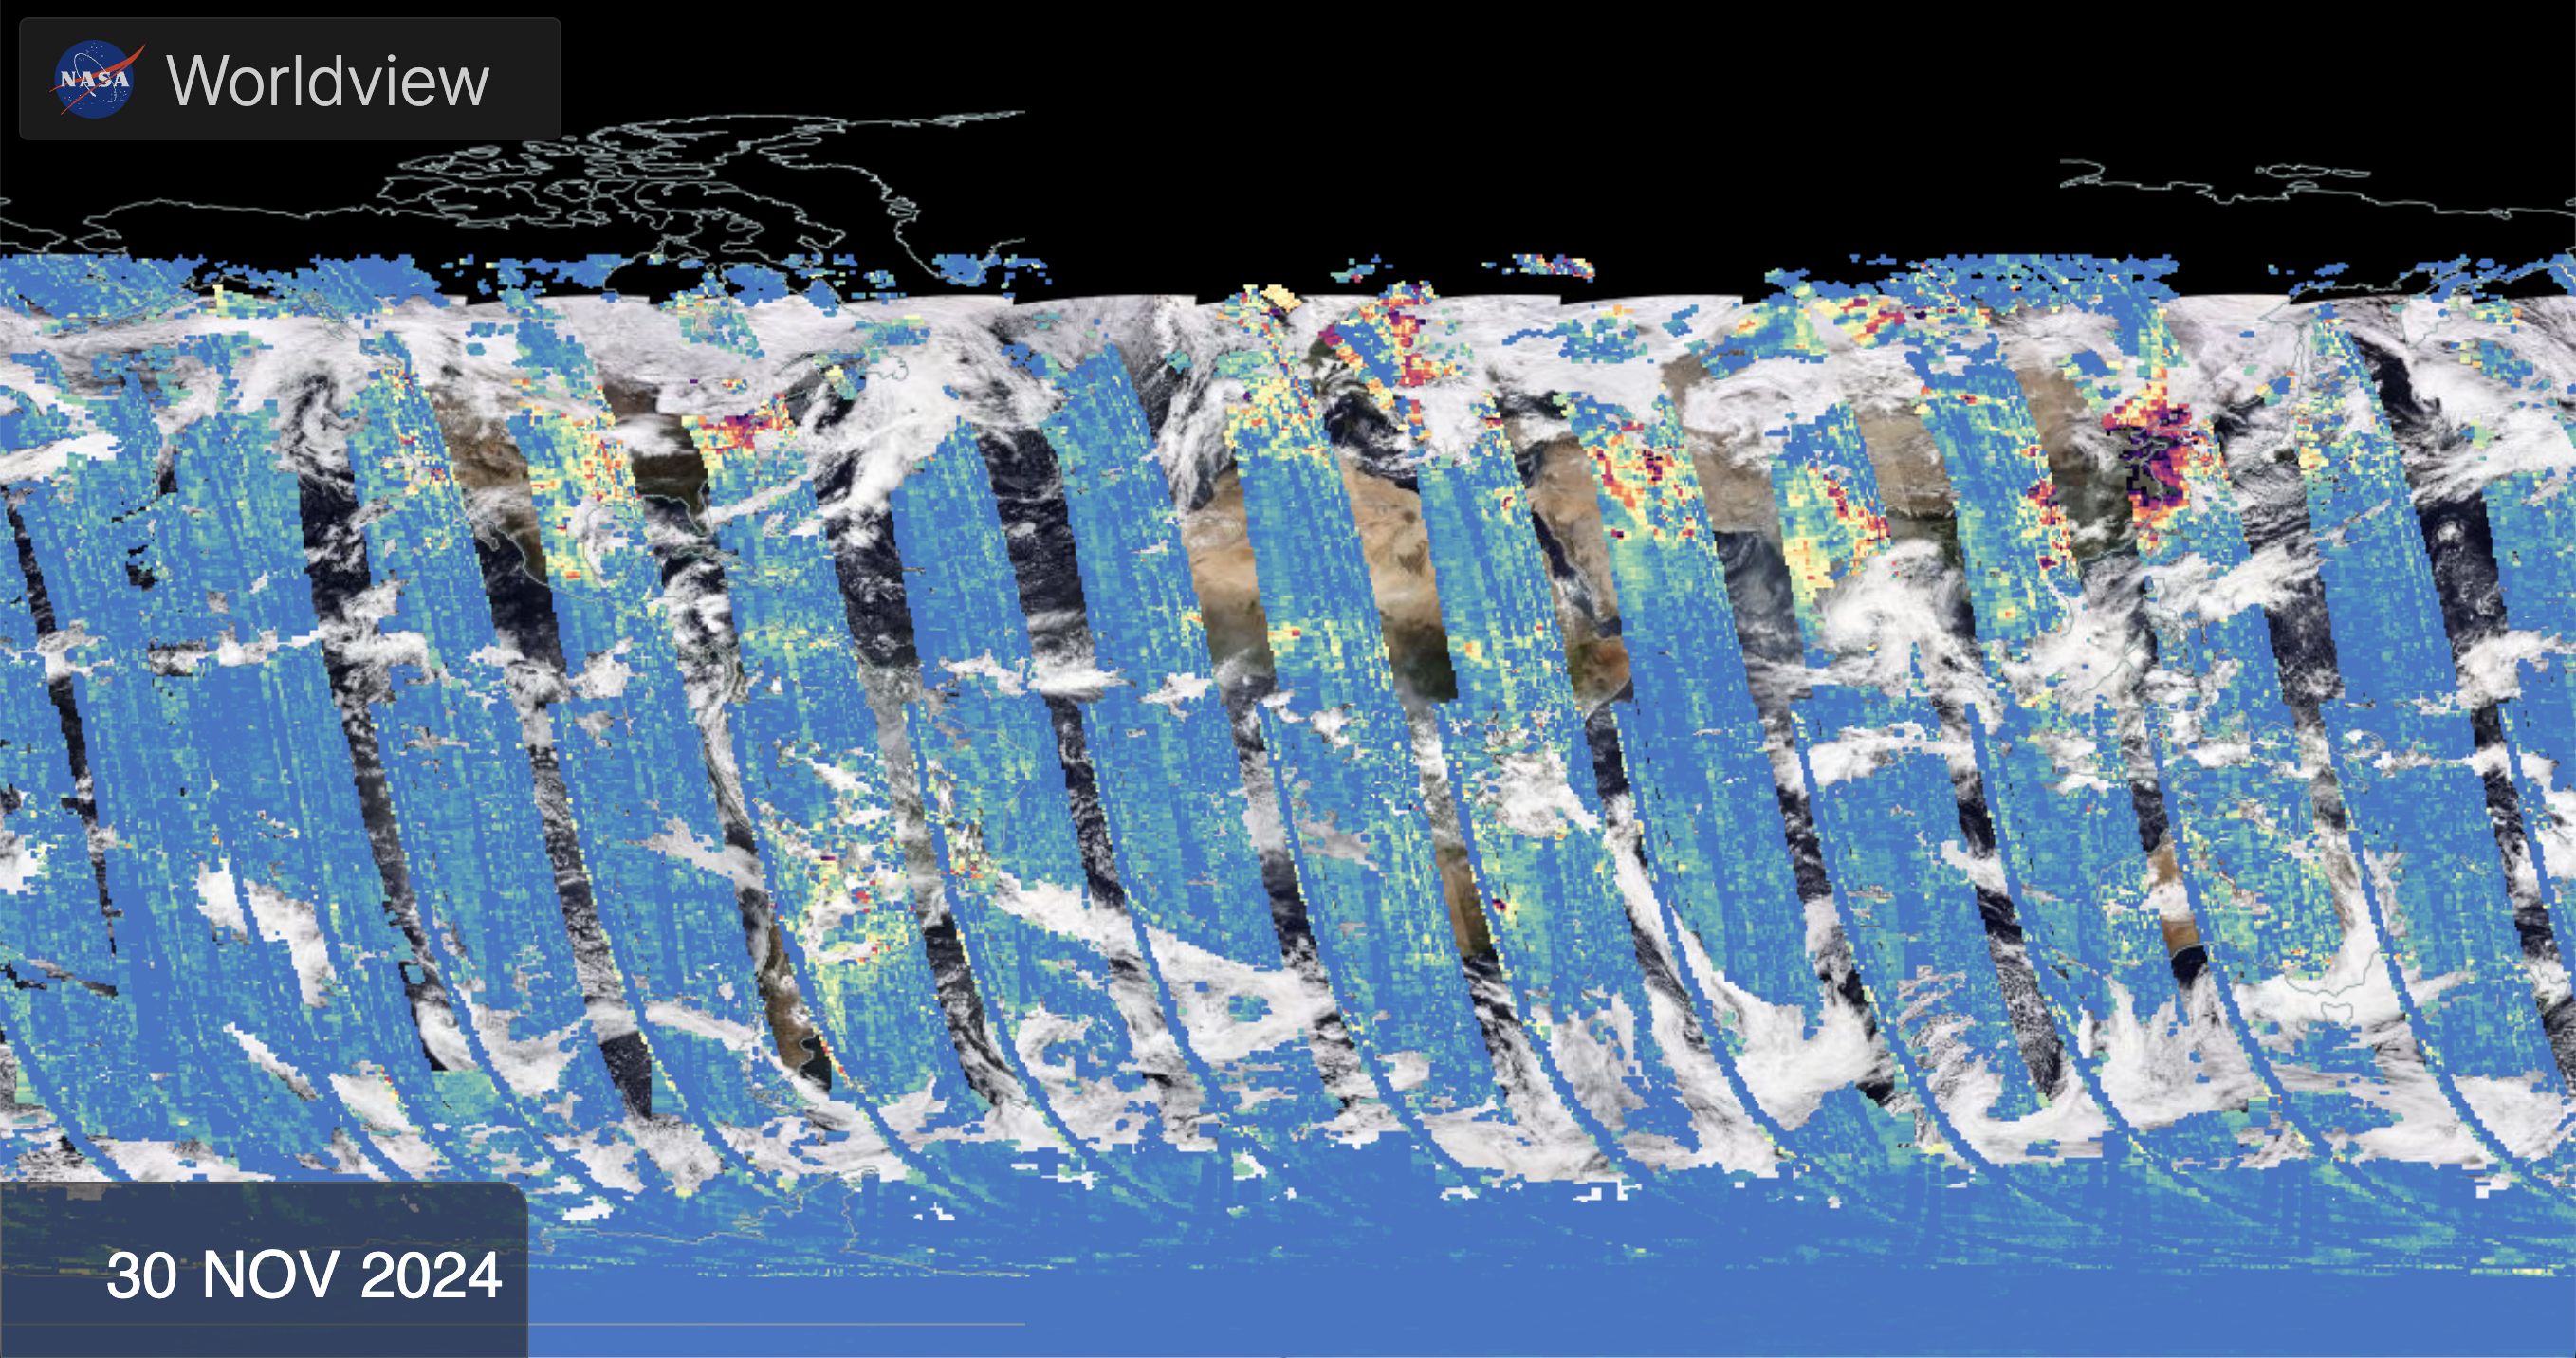
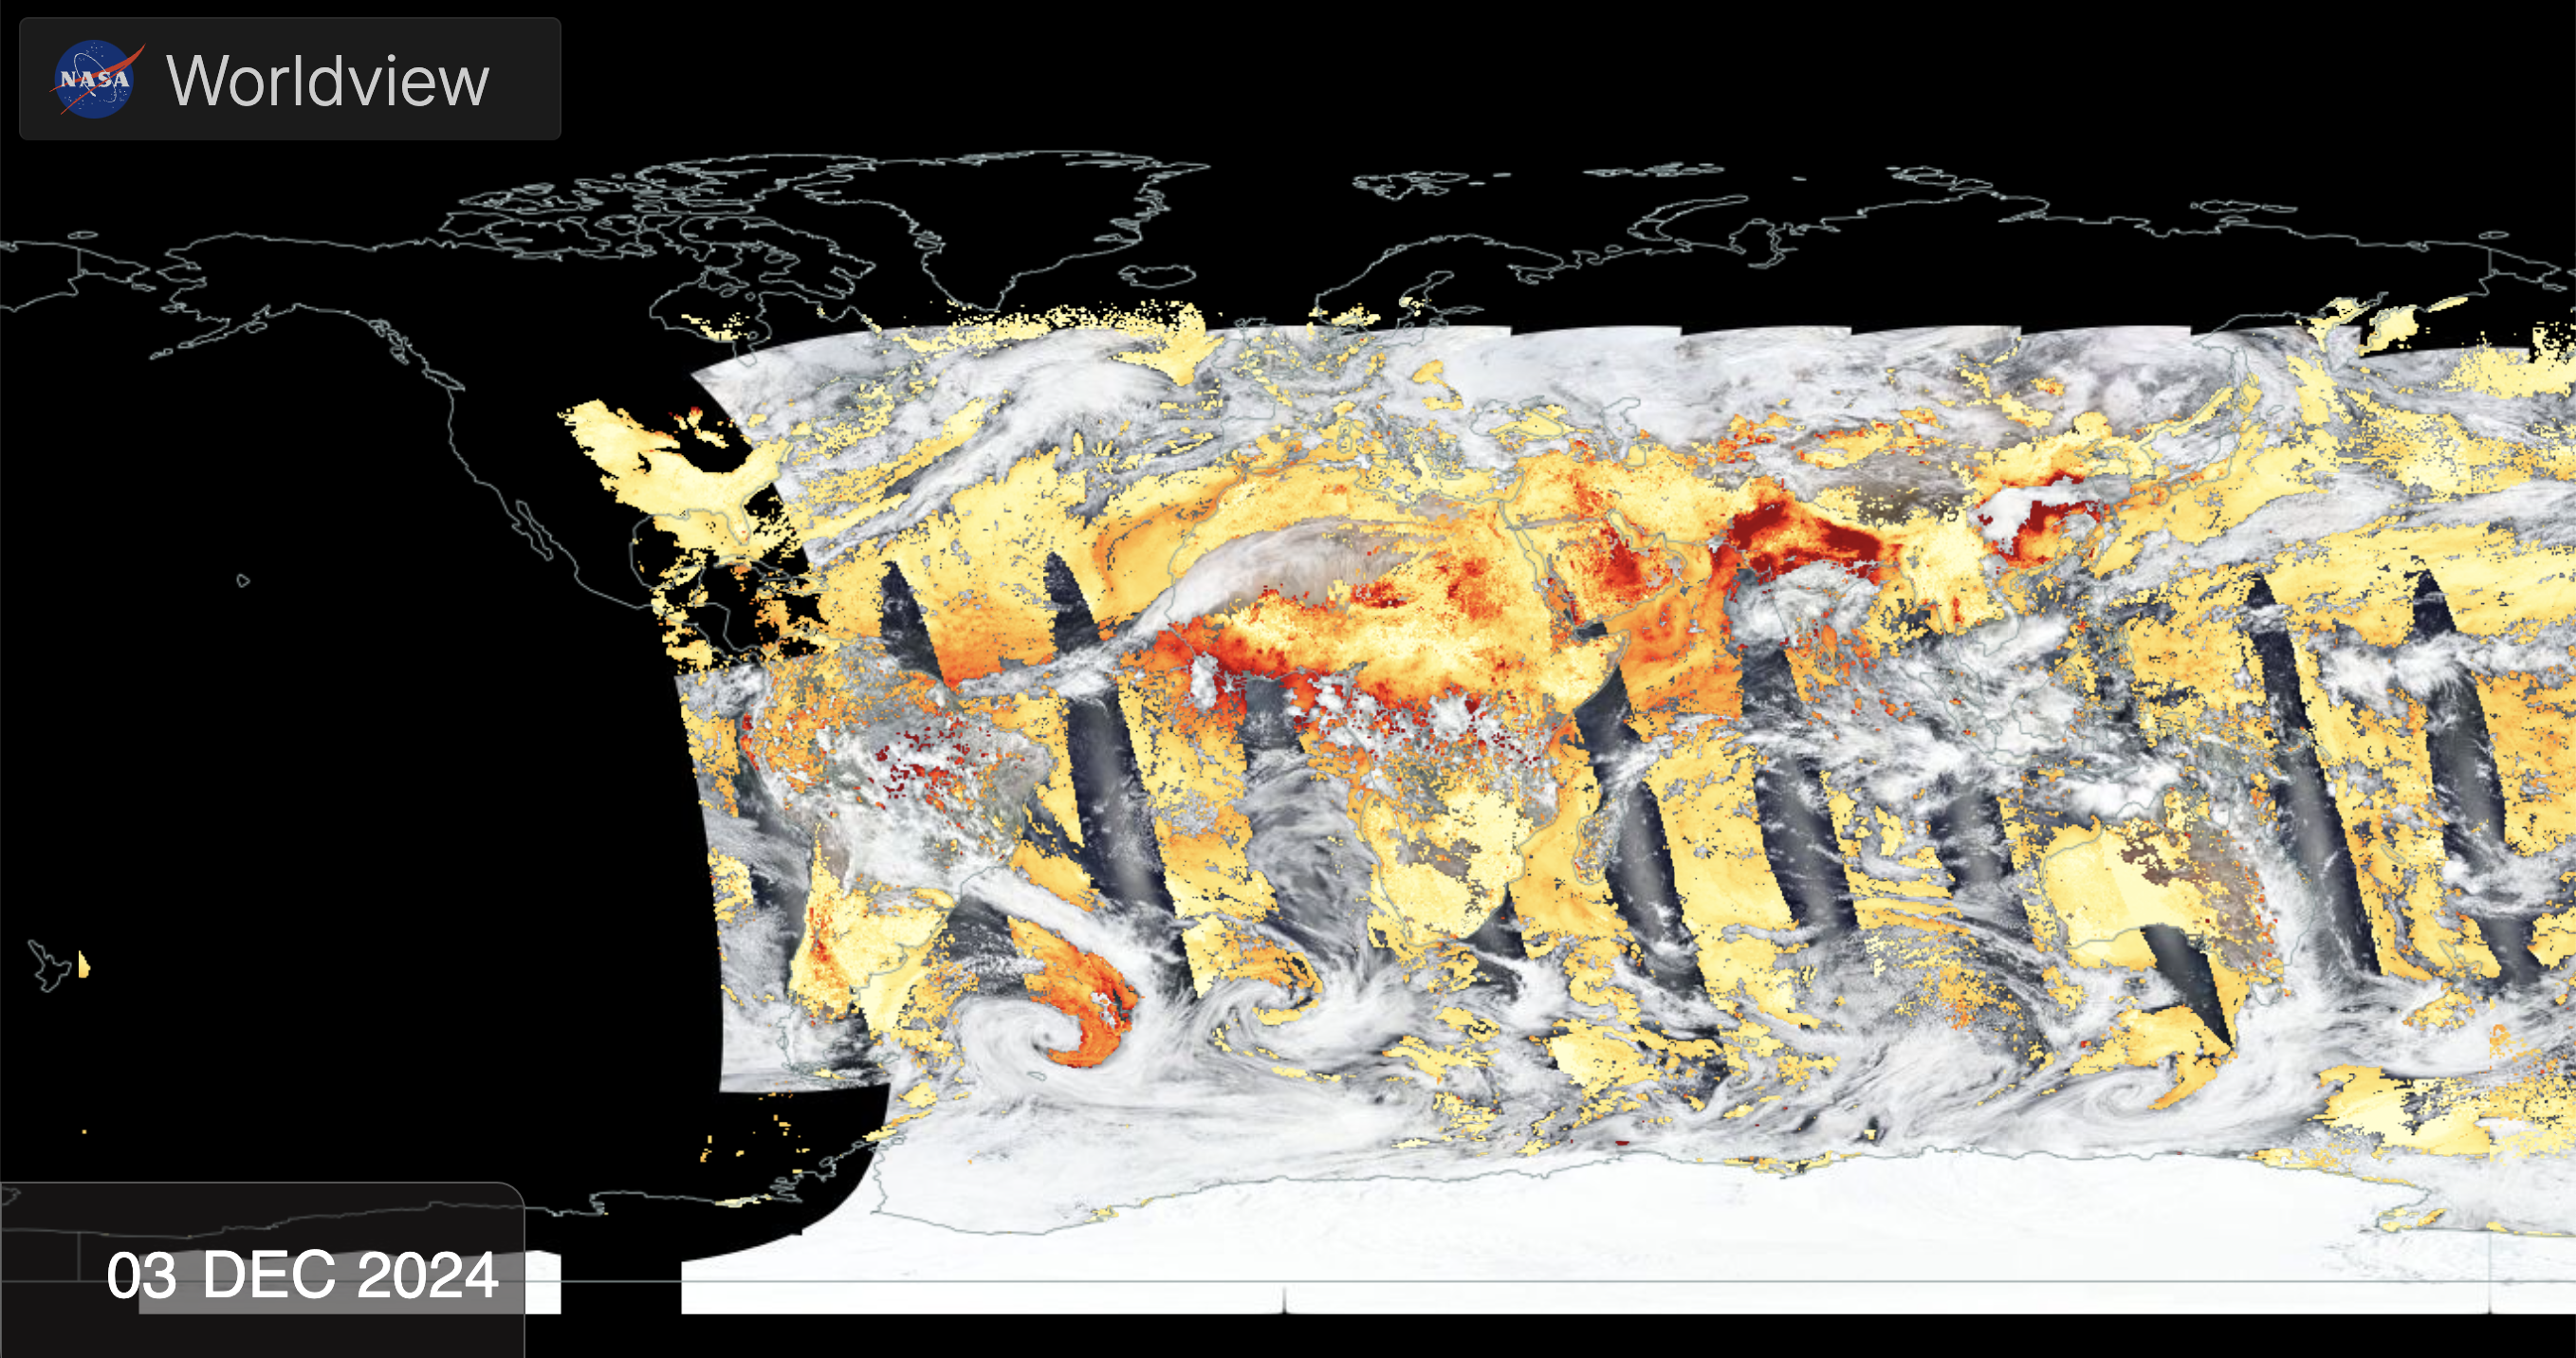
The first cycle of the Earth Now dashboard shows a set of near real-time satellite observations, provided by NASA's Worldview team. These satellite data products are generally captured within the previous three hours and are created in an expedited manner to support forecasting and monitoring of natural hazards and disasters, to assess air quality and support agricultural needs, to facilitate improved weather prediction, and to help ensure homeland security. While the displayed NASA satellite missions were originally designed for scientific research, they have been adapted to also support time sensitive applications through NASA’s Land, Atmosphere Near real-time Capability (LANCE).
Models: Air Quality
Predictions of air pollution are created using complex models that combine information about weather and the emissions, transformation, and transport of chemical species and particles. The Goddard Earth Observing System Composition Forecasting (GEOS-CF) system is a research model maintained by NASA’s Global Modeling and Assimilation Office to help scientists understand the causes and impact of air pollution. It is one of the highest resolution and most detailed models of its kind in the world, made possible through ongoing collaborations between NASA and university scientists. GEOS-CF tracks the concentrations of hundreds of gas phase chemical species and dozens of types of particles characterized by their composition and size. It is used by a wide variety of stakeholders around the world to develop new methods for improving local predictions, understanding the impact of pollution on human health, and improving the quality of NASA satellite datasets.
Particulate Matter (PM) 2.5
Go to this pageNear surface concentration of fine particular matter (PM2.5) estimated from NASA’s aerosol and weather fields produced by NASA’s GEOS-CF model. || MC01_stage4_GMAO_pm25_2048x1024_en.00001_print.jpg (1024x512) [197.2 KB] || ParticulateMatter_GMAO.png (560x227) [3.5 KB] || MC01_stage4_GMAO_pm25_2048x1024_en.00001_searchweb.png (320x180) [98.9 KB] || MC01_stage4_GMAO_pm25_2048x1024_en.00001_thm.png (80x40) [6.9 KB] || MC01_stage4_GMAO_pm25_2048x1024_en.mp4 (2048x1024) [19.1 MB] || MC01_stage4_GMAO_pm25_2048x1024_en-hwtool (2048x1024) [373 Item(s)] || lowbit_MC01_stage4_GMAO_pm25_2048x1024_en.mp4 (2048x1024) [3.7 MB] ||
Near surface Ozone (O3)
Go to this pageNear surface concentration of ozone (O3) estimated by NASA’s GEOS-CF model. || MC02_stage4_GMAO_O3_2048x1024_en.00001_print.jpg (1024x512) [146.9 KB] || Ozone_GMAO.png (560x227) [3.6 KB] || MC02_stage4_GMAO_O3_2048x1024_en.00001_searchweb.png (320x180) [97.0 KB] || MC02_stage4_GMAO_O3_2048x1024_en.00001_thm.png (80x40) [7.1 KB] || MC02_stage4_GMAO_O3_2048x1024_en.mp4 (2048x1024) [22.6 MB] || MC02_stage4_GMAO_O3_2048x1024_en-hwtool (2048x1024) [373 Item(s)] || lowbit_MC02_stage4_GMAO_O3_2048x1024_en.mp4 (2048x1024) [3.7 MB] ||
Carbon Monoxide (CO)
Go to this pageNear surface concentration of carbon monoxide (CO) estimated by NASA’s GEOS-CF model. || MC03_stage4_GMAO_CO_2048x1024_en.00001_print.jpg (1024x512) [180.4 KB] || CarbonMonoxide_GMAO.png (560x227) [3.5 KB] || MC03_stage4_GMAO_CO_2048x1024_en.00001_searchweb.png (320x180) [84.3 KB] || MC03_stage4_GMAO_CO_2048x1024_en.00001_thm.png (80x40) [6.3 KB] || MC03_stage4_GMAO_CO_2048x1024_en.mp4 (2048x1024) [17.7 MB] || MC03_stage4_GMAO_CO_2048x1024_en-hwtool (2048x1024) [373 Item(s)] || lowbit_MC03_stage4_GMAO_CO_2048x1024_en.mp4 (2048x1024) [3.7 MB] ||
Nitrogen Oxides (NOx)
Go to this pageNear surface concentration of Nitrogen Oxides (NOx) estimated from concentrations of nitrogen oxide and nitrogen dioxide produced by sNASA’s GEOS-CF model. || MC04_stage4_GMAO_NO2_2048x1024_en.00001_print.jpg (1024x512) [216.7 KB] || NitrousOxides_GMAO.png (560x227) [3.5 KB] || MC04_stage4_GMAO_NO2_2048x1024_en.00001_searchweb.png (320x180) [106.5 KB] || MC04_stage4_GMAO_NO2_2048x1024_en.00001_thm.png (80x40) [7.7 KB] || MC04_stage4_GMAO_NO2_2048x1024_en.mp4 (2048x1024) [31.5 MB] || MC04_stage4_GMAO_NO2_2048x1024_en-hwtool (2048x1024) [373 Item(s)] || lowbit_MC04_stage4_GMAO_NO2_2048x1024_en.mp4 (2048x1024) [3.7 MB] ||
Revolutionizing our understanding with NASA's TEMPO mission
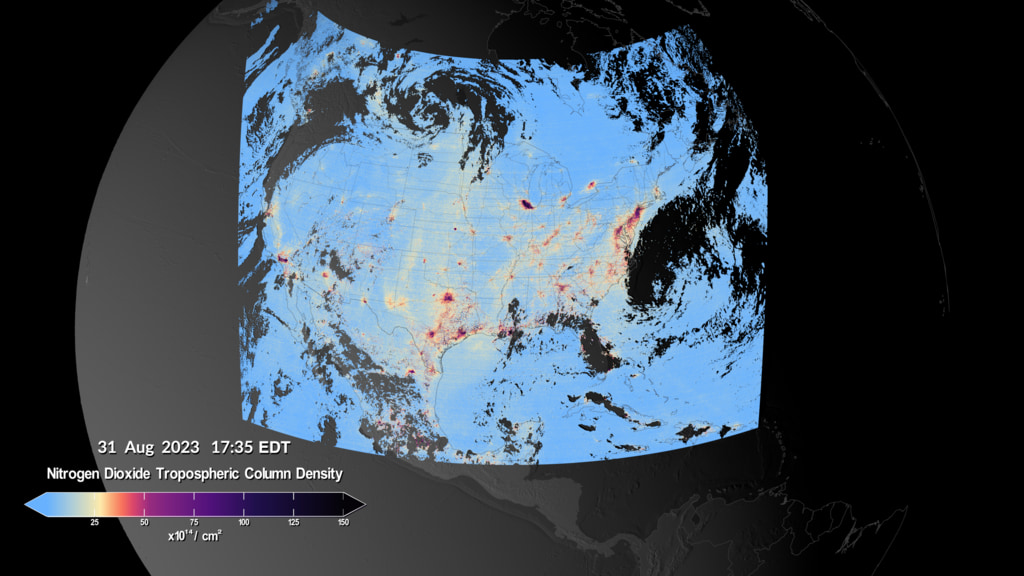
NASA’s TEMPO, or Tropospheric Emissions: Monitoring of Pollution, is the first space-based instrument designed to continuously measure air quality above North America with the resolution of a few square miles. TEMPO uses visible sunlight to take hourly scans of North America's atmosphere and can not see pollution below clouds or at night
TEMPO - Nitrogen Dioxide Air Pollution Over North America - Additional Views
Go to this pageIn this visualization, high levels of nitrogen dioxide can be seen over multiple urban areas across the U.S., Canada, Mexico and the Caribbean. As the day progresses, the morning pollution often dissipates. Later in the afternoon, it will rise again as the cities enter their second rush hour of the day. Because TEMPO uses visible sunlight to make measurements, it cannot see pollution below clouds or at night. Cloudy areas appear as missing data in the visualization. This visualization shows data from August 28-31, 2023. || tempo_no2_north-america.02402_print.jpg (1024x576) [170.3 KB] || tempo_no2_north-america.02402_searchweb.png (180x320) [67.8 KB] || tempo_no2_north-america.02402_thm.png (80x40) [5.6 KB] || tempo_no2_north-america_1080p60.mp4 (1920x1080) [23.3 MB] || tempo_no2_north-america (3840x2160) [0 Item(s)] || tempo_no2_north-america_2160p60.mp4 (3840x2160) [84.5 MB] || tempo_no2_north-america_2160p30.mp4 (3840x2160) [84.8 MB] || tempo_no2_north-america.mov (3840x2160) [5.6 GB] || a005175_tempo_no2_north-america_2160p30.hwshow [60 bytes] ||
Reductions in Pollution Associated with Decreased Fossil Fuel Use Resulting from COVID-19 Mitigation
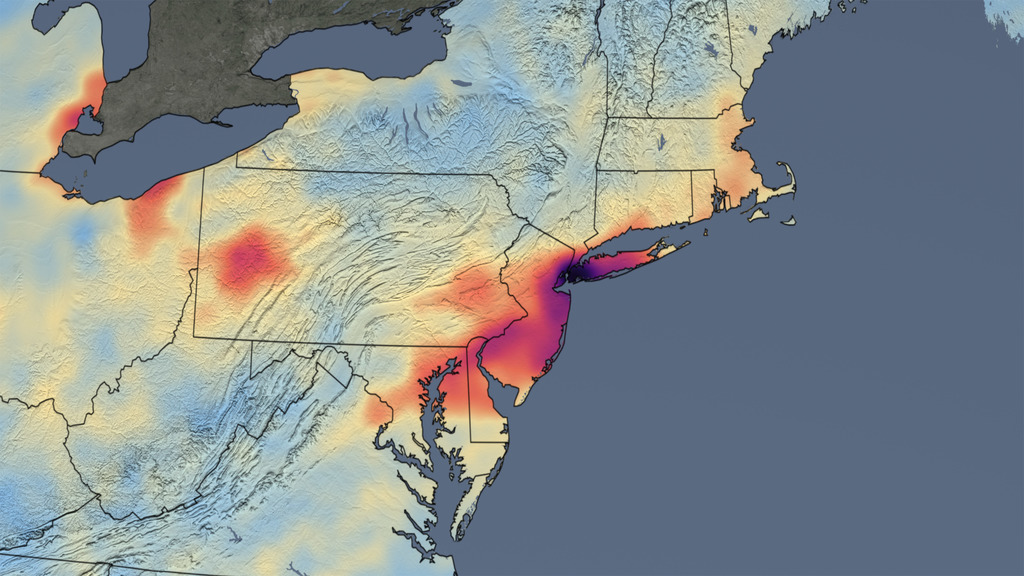
Go to this pageOver the past several weeks, the United States has seen significant reductions in air pollution over its major metropolitan areas. Similar reductions in air pollution have been observed in other regions of the world. || Tropospheric NO2 Column, Animated GIF || cropped_NO2_2019_2020.gif (848x862) [54.4 MB] || cropped_NO2_2019_2020_print.jpg (1024x1040) [318.2 KB] || cropped_NO2_2019_2020_searchweb.png (320x180) [102.2 KB] ||
Air Quality Monitoring Stations in Washington D.C.
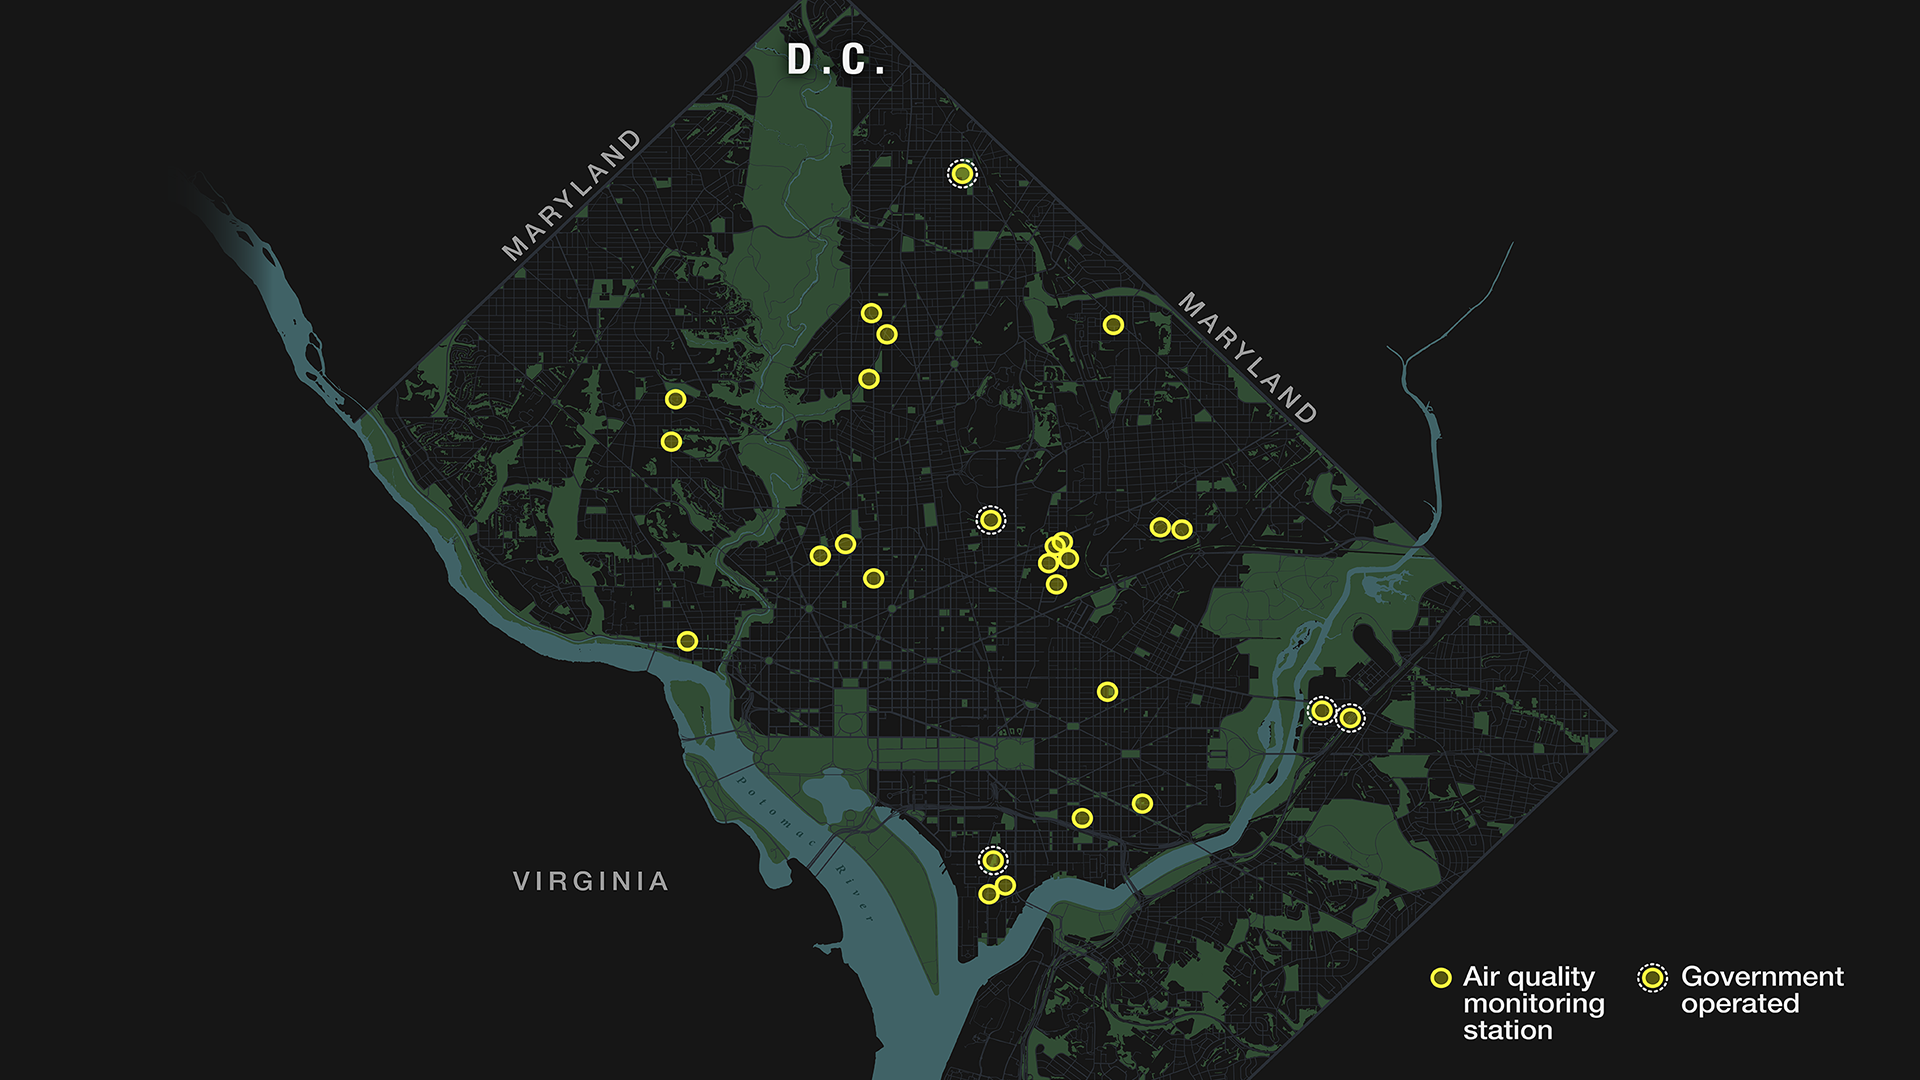
Go to this pageAll air quality monitoring stations that measure particulate matter 2.5 (PM2.5) located in Washington D.C. The government operated stations are circled in white. Click the download dropdown for more versions. || dc_air_stations_full_preview.png (1920x1080) [1.1 MB] || dc_air_stations_4320.png (4320x2160) [2.0 MB] || dc_stations_basemap_4320.png (4320x2160) [1.9 MB] || dc_air_stations_full_4320.png (4320x2160) [2.0 MB] || dc_air_stations_full_preview_searchweb.png (320x180) [44.6 KB] || dc_air_stations_full_preview_thm.png (80x40) [3.8 KB] ||
