Air Quality in DC
Overview
NASA-supported scientist Susan Anenberg reviews air pollution data from satellites, airplanes, and ground sensors and combines it with data on race, ethnicity, poverty, and health. In doing so Anenberg unveils the both the big picture of air pollution and individual neighborhood effects. Information that lets community leaders and other decision makers to make better decisions and address long standing inequities.
Video
How NASA Observes Air Quality in DC
Go to this page16x9 version optimized for YouTube. Universal Production Music: Evolving Earth Underscore by James Carlin BakerThis video can be freely shared and downloaded. While the video in its entirety can be shared without permission, some individual imagery provided by Pond5.com is obtained through permission and may not be excised or remixed in other products. For more information on NASA’s media guidelines, visit https://www.nasa.gov/multimedia/guidelines/index.htmlComplete transcript available. || DC_AQ_MAIN_16x9.00030_print.jpg (1024x576) [51.5 KB] || DC_AQ_MAIN_16x9.00001_thm.png (80x40) [4.1 KB] || DC_AQ_MAIN_16x9.00030_searchweb.png (320x180) [49.2 KB] || DC_AQ_MAIN_16x9.webm (3840x2160) [29.6 MB] || AirQuality.en_US.srt [2.5 KB] || AirQuality.en_US.vtt [2.4 KB] || DC_AQ_MAIN_16x9.mp4 (3840x2160) [1.3 GB] ||
Featured Visualizations
Paint By Particle
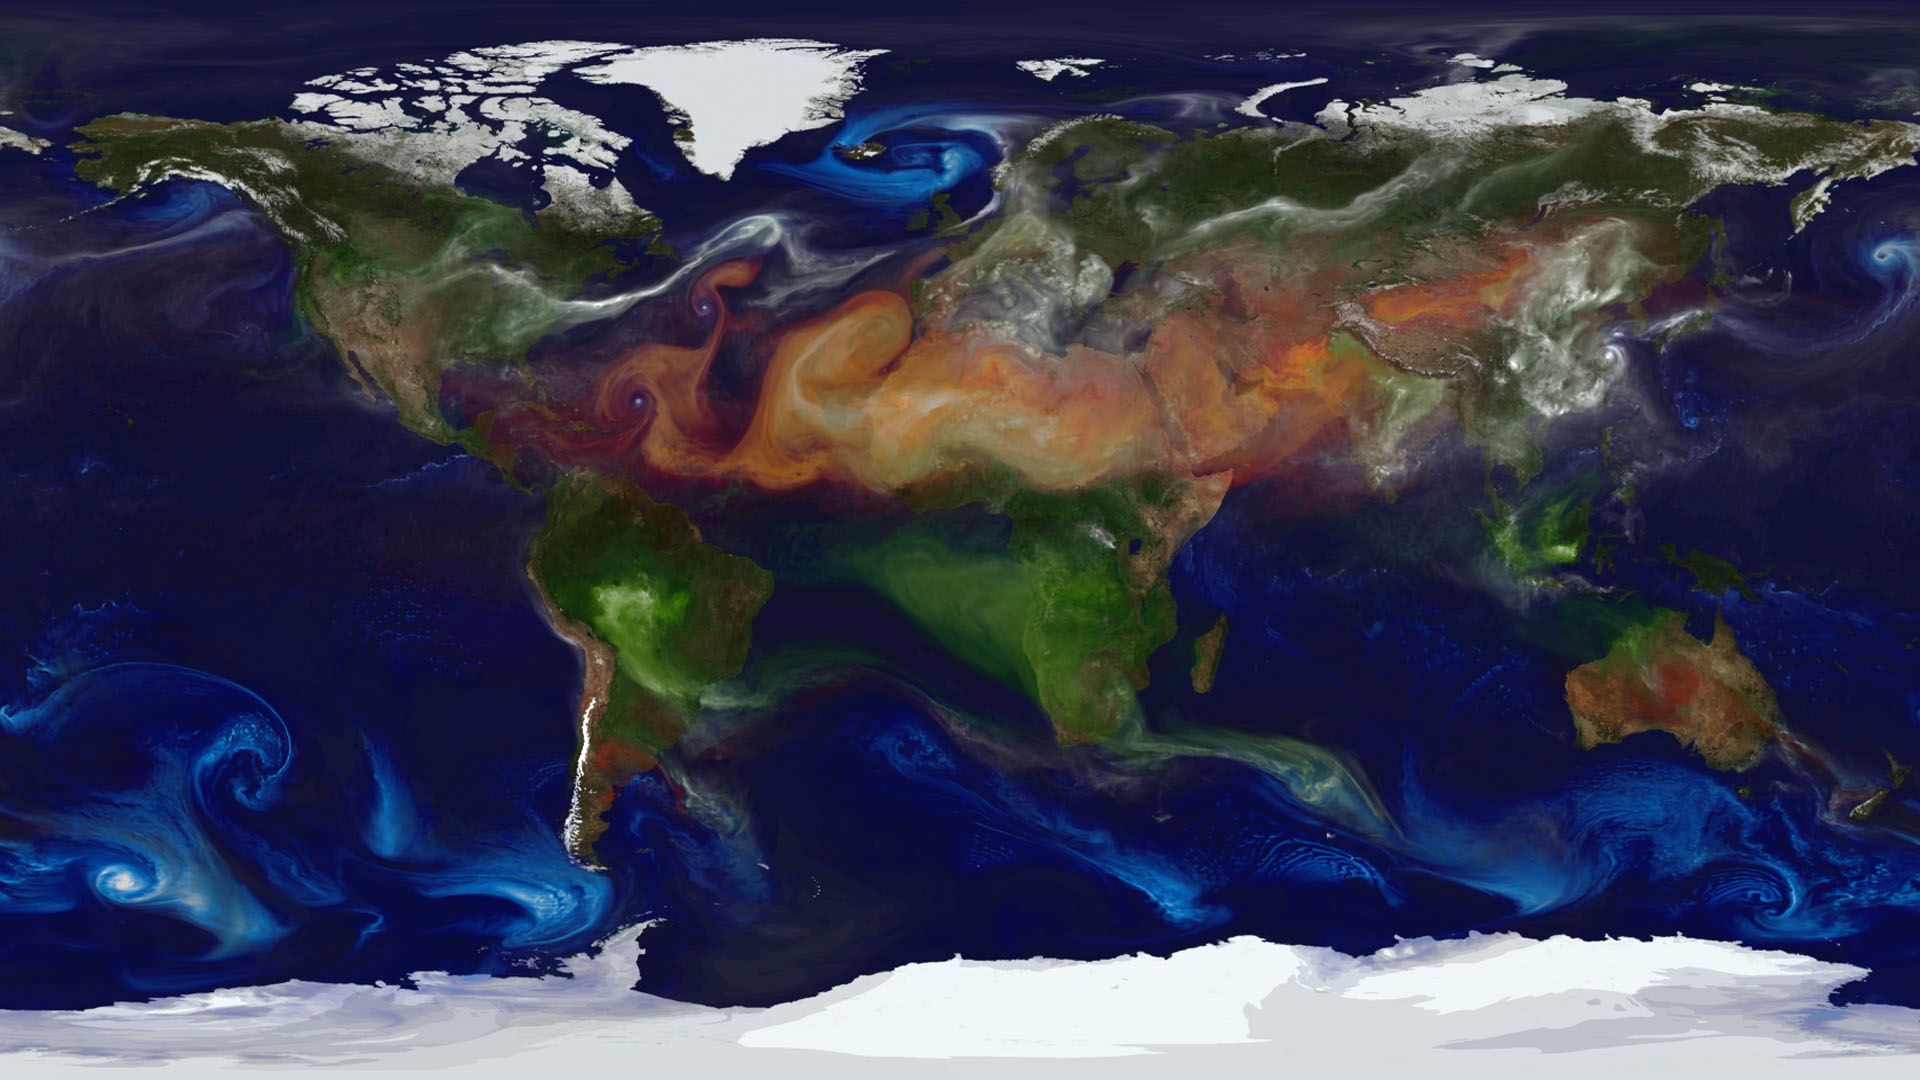
Go to this pageSatellites, balloon-borne instruments and ground-based devices make 30 million observations of the atmosphere each day. Yet these measurements still give an incomplete picture of the complex interactions within the membrane surrounding Earth. Enter climate models. Through mathematical experiments, modelers can move Earth forward or backward in time to create a dynamic portrait of the planet. Researchers from NASA Goddard's Global Modeling and Assimilation Office recently ran a simulation of the atmosphere that captured how winds whip aerosols around the world. Such simulations allow scientists to better understand how these tiny particulates travel in the atmosphere and influence weather and climate. In the visualization below, covering August 2006 to April 2007, watch as dust and sea salt swirl inside cyclones, carbon bursts from fires, sulfate streams from volcanoes—and see how these aerosols paint the modeled world. ||
Simulation of Surface Ozone
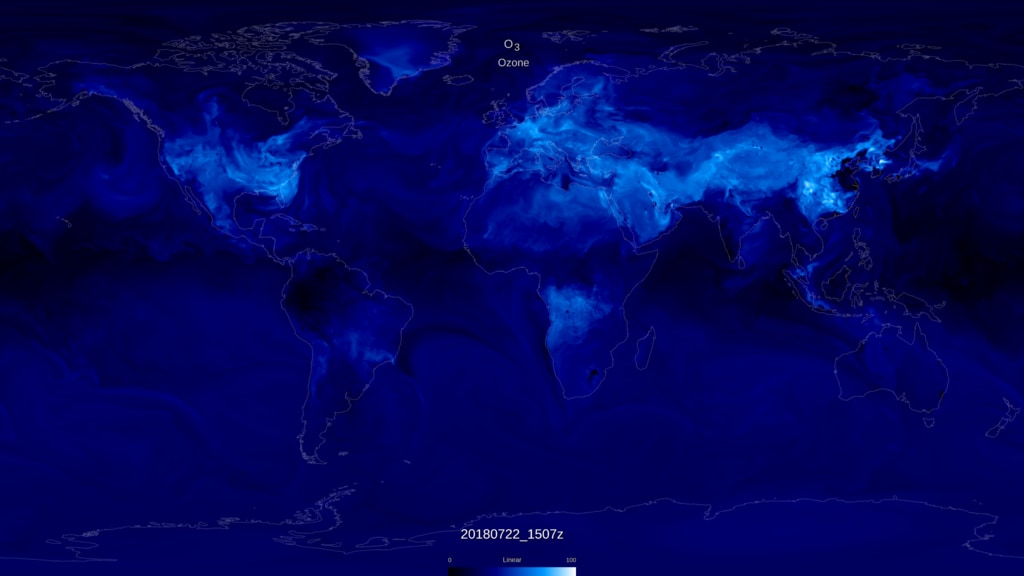
Go to this pageGlobal surface ozone from a GEOS model run || ozone_only_4k.00000_print.jpg (1024x576) [65.8 KB] || ozone_only_4k.00000_searchweb.png (320x180) [58.9 KB] || ozone_only_4k.00000_thm.png (80x40) [5.1 KB] || ozone_only_1080p30.mp4 (1920x1080) [24.5 MB] || ozone_only_1080p30.webm (1920x1080) [7.2 MB] || ozone_only_2160p30.mp4 (3840x2160) [70.8 MB] || ozone_only (3840x2160) [128.0 KB] || ozone_only (5760x3240) [128.0 KB] || ozone_only_1080p30.mp4.hwshow [208 bytes] ||
Two Decades of Changes in Nitrogen Dioxide and Fine Particulate Pollution in the U.S.
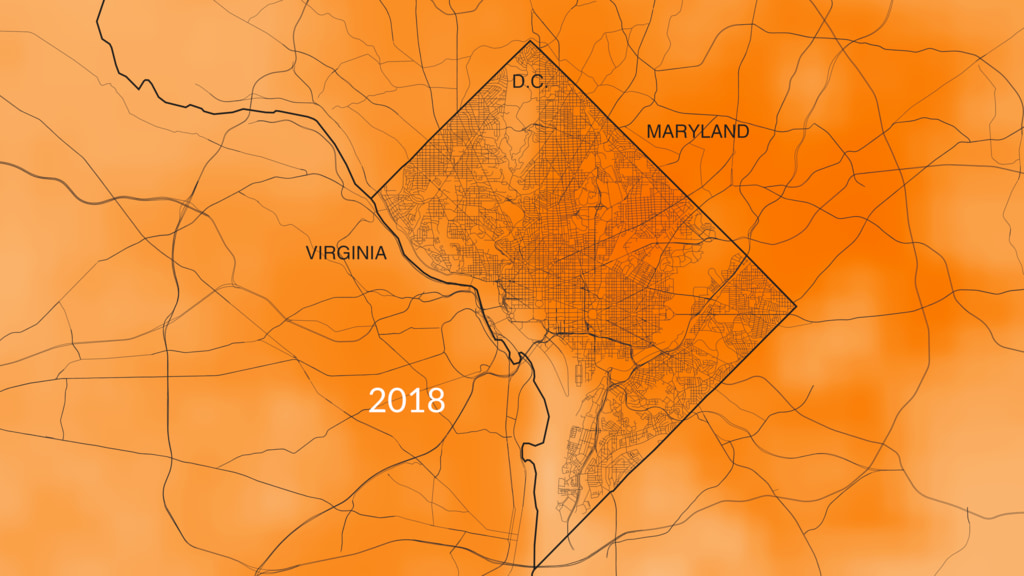
Go to this pageA data visualization of particulate matter 2.5 (PM2.5) data for the Washington DC region spanning 2000-2018 (annual averages). Higher values are represented with dark red and lower values are represented with bright yellow. This view uses the hybrid PM 2.5 color bar with a range of 5 to 20. || pm25_dc_annual.2018_print.jpg (1024x576) [216.4 KB] || pm25_dc_annual.2018_searchweb.png (320x180) [75.7 KB] || pm25_dc_annual.2018_thm.png (80x40) [6.2 KB] || pm25_dc_annual (3840x2160) [4.0 KB] || pm25_dc_annual_2160p1.mp4 (3840x2160) [30.8 MB] || pm25_dc_annual_2160p60_prores.mov (3840x2160) [41.0 MB] || pm25_dc_annual_2160p1.webm (3840x2160) [1.9 MB] ||
Nitrogen Dioxide Over the United States, 2005-2022
Go to this pageNO2 over the United States as measured by OMI, with labels || NO2_US_2005-2022.399_print.jpg (1024x576) [171.6 KB] || NO2_US_2005-2022.399_searchweb.png (320x180) [80.6 KB] || NO2_US_2005-2022.399_thm.png (80x40) [5.9 KB] || w_dates (3840x2160) [32.0 KB] || NO2_US_2005-2022_2160p30.mp4 (3840x2160) [20.0 MB] || NO2_US_2005-2022_2160p30.webm (3840x2160) [2.7 MB] ||
Air Quality Monitoring Stations in Washington D.C.
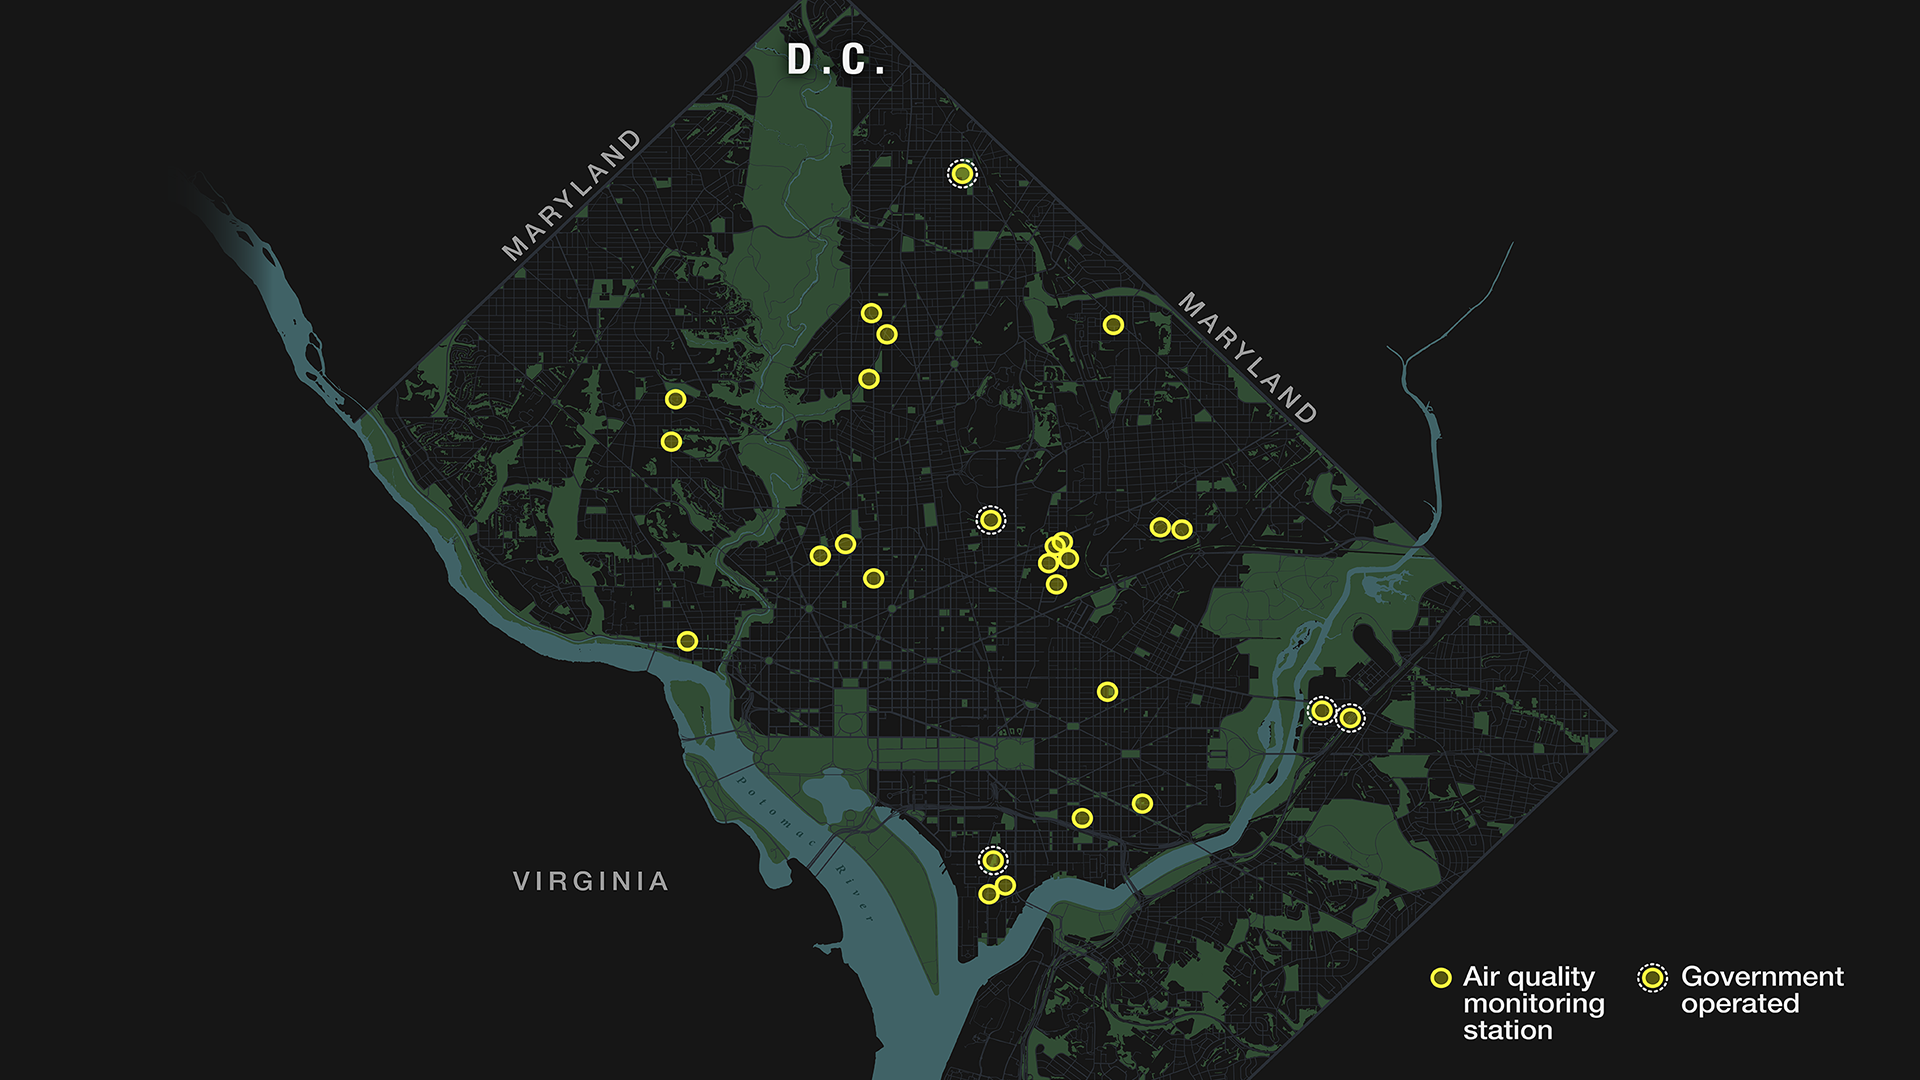
Go to this pageAll air quality monitoring stations that measure particulate matter 2.5 (PM2.5) located in Washington D.C. The government operated stations are circled in white. Click the download dropdown for more versions. || dc_air_stations_full_preview.png (1920x1080) [1.1 MB] || dc_air_stations_4320.png (4320x2160) [2.0 MB] || dc_stations_basemap_4320.png (4320x2160) [1.9 MB] || dc_air_stations_full_4320.png (4320x2160) [2.0 MB] || dc_air_stations_full_preview_searchweb.png (320x180) [44.6 KB] || dc_air_stations_full_preview_thm.png (80x40) [3.8 KB] ||
Earth Observing Fleet - Now
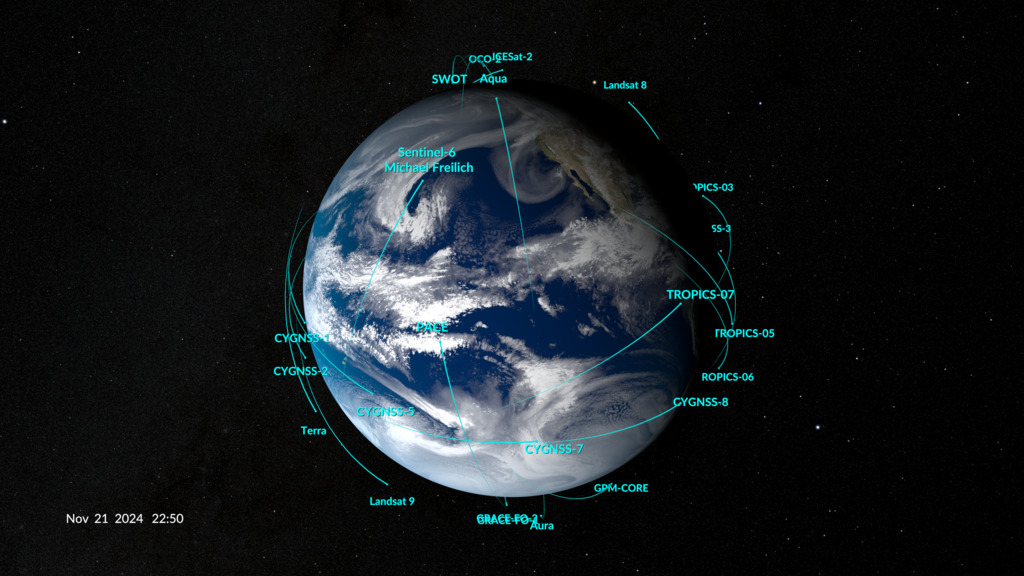
Go to this pageA current view of NASA's Earth observing fleet. This image is updated every 10 minutes. Time shown in UTC. || fleet_now_print.jpg (1024x576) [143.8 KB] || fleet_now_searchweb.png (180x320) [75.6 KB] || fleet_now_thm.png (80x40) [4.2 KB] || fleet_now.tif (3840x2160) [42.3 MB] || fleet_now_hw.tif (9600x3240) [145.3 MB] ||

