Aquarius Mission
Overview
During its nominal three-year mission, Aquarius will map the
salinity at the ocean surface to improve our understanding of
Earth's water cycle and ocean circulation. Aquarius will help
scientists see how freshwater moves between the ocean and
the atmosphere. It will monitor changes in the water cycle due
to rainfall, evaporation, ice melting, and river runoff.
Aquarius Spacecraft
Aquarius
Go to this pageAquarius spacecraft in orbit around the Earth || Aquarius 2010 Beauty Shot 3 || aqub000100002_print.jpg (1024x576) [35.4 KB] || aqub0001_web.png (320x180) [223.9 KB] || aqub0001_thm.png (80x40) [15.5 KB] || Aquarius-Beauty3_720p.m2v (1280x720) [21.0 MB] || Aquarius-beauty3.mp4 (1280x720) [5.3 MB] || beauty3 (1280x720) [0 Item(s)] || Aquarius-Beauty3_720p.webmhd.webm (960x540) [2.8 MB] || Aquarius-Beauty3_512x288.m1v (512x288) [3.5 MB] ||
Salinity
Salt of the Earth
Go to this pageSalinity plays a major role in how ocean waters circulate around the globe. Salinity changes can create ocean circulation changes that, in turn, may impact regional and global climates. The extent to which salinity impacts our global ocean circulation is still relatively unknown, but NASA's new Aquarius mission will help advance that understanding by painting a global picture of our planet's salty waters.For complete transcript, click here. || Salt_of_the_Earth_640x480.00519_print.jpg (1024x576) [66.1 KB] || Salt_of_the_Earth_640x480_web.png (320x180) [106.1 KB] || Salt_of_the_Earth_640x480_thm.png (80x40) [12.6 KB] || Salt_of_the_Earth_appletv_1280x720.webmhd.webm (960x540) [65.9 MB] || Salt_of_the_Earth_H264_1280x720_30fps.mov (1280x720) [150.0 MB] || Salt_of_the_Earth_appletv_1280x720.m4v (960x540) [166.5 MB] || Salt_of_the_Earth_1280x720.mp4 (1280x720) [99.9 MB] || Salt_of_the_Earth_broll_prores.mov (1280x720) [4.7 GB] || Salt_of_the_Earth_Youtube_1280x720.mov (1280x720) [72.2 MB] || Salt_of_the_Earth_640x480.m4v (640x360) [55.1 MB] || GSFC_20091012_Aquarius_m10504_Salt.en_US.srt [6.0 KB] || GSFC_20091012_Aquarius_m10504_Salt.en_US.vtt [6.1 KB] || Salt_of_the_Earth_ipod_320x240.m4v (320x180) [23.1 MB] || Salt_of_the_Earth.wmv (346x260) [35.0 MB] ||
ARGO Float Animation #1
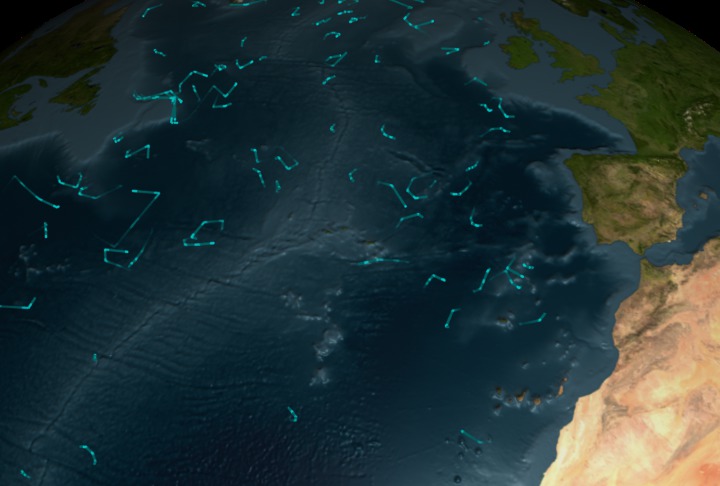
Go to this pageThis visualization shows the locations of the ARGO buoy array over time. When the buoys are above water, the lines are brighter; when the buoys are under water, the lines are fainter. The ARGO buoys measure ocean salinity, column temperature, and current velocities. This version of the visualization uses a slow camera move. ||
ARGO Float Animation #2
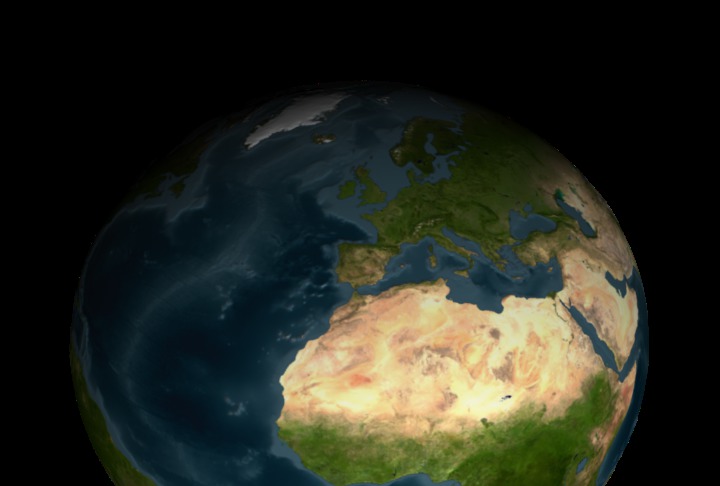
Go to this pageThis visualization shows the locations of the ARGO buoy array over time. When the buoys above water, the lines are brighter; when the buoys are under water, the lines are fainter. The ARGO buoys measure ocean salinity, column temperature, and current velocities. This version of the visualization uses a faster camera move than version #1 (animation 3204). ||
Water Cycle
The Water Cycle
Go to this pageThis animation shows one molecule of water completing the hydrologic cycle. Heat from the sun causes the molecule to evaporate from the ocean's surface. Once it evaporates, it is transported high in the atmosphere and condenses to form clouds. Clouds can move great distances and eventually the water molecule will fall as rain or snow. Ultimately, the water molecule arrives back where it started...at the ocean. || water_cycle_appletv_1280x720.00713_print.jpg (1024x576) [76.9 KB] || water_cycle_appletv_1280x720_web.png (320x180) [194.0 KB] || water_cycle_appletv_1280x720_thm.png (80x40) [15.8 KB] || water_cycle_appletv_1280x720.webmhd.webm (960x540) [13.4 MB] || water_cycle_appletv_1280x720.m4v (960x540) [33.0 MB] || water_cycle_broll_prores.mov (1280x720) [736.3 MB] || water_cycle_h264_1280x720.mov (1280x720) [40.1 MB] || water_cycle_youtube_1280x720.mov (1280x720) [18.9 MB] || 1280x720_16x9_30p (1280x720) [256.0 KB] || water_cycle_ipod_640x480.m4v (640x360) [15.3 MB] || water_cycle_ipod_320x240.m4v (320x180) [5.2 MB] ||
Water, Water Everywhere!
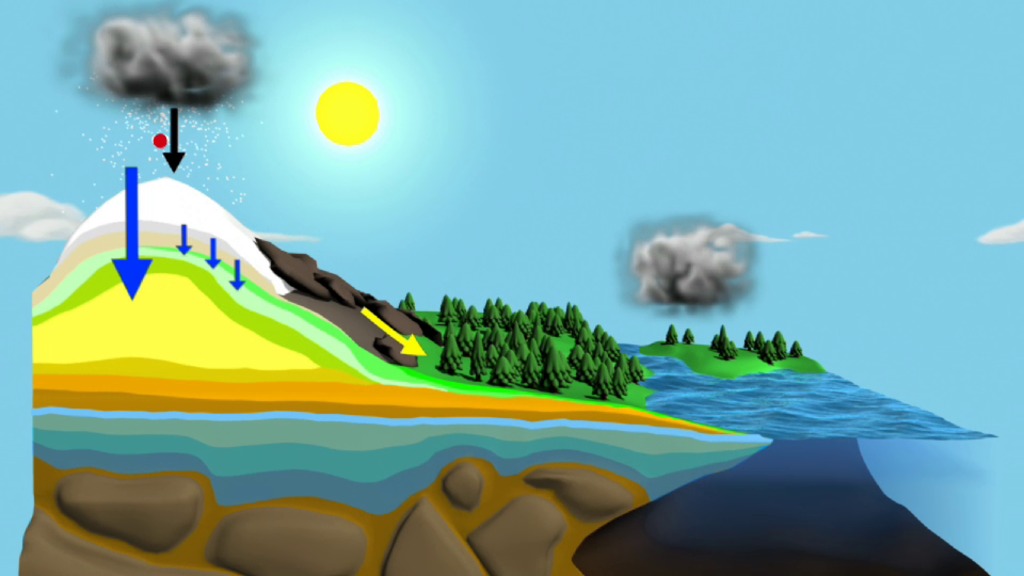
Go to this pageWater is all around us, and its importance to nearly every natural process on earth cannot be underestimated. The water cycle is the movement of water around the Earth in all its forms, from the ocean to the atmosphere, to snow, soil, aquifers, lakes, and streams on land, and ultimately backs to the ocean. This video explains what the water cycle is and how important it is to life on earth.For complete transcript, click here. || Water_Water_Everywhere_640x480.01727_print.jpg (1024x576) [218.0 KB] || Water_Water_Everywhere_640x480_web.png (320x180) [275.8 KB] || Water_Water_Everywhere_640x480_thm.png (80x40) [18.1 KB] || Water_Water_Everywhere_AppleTV.webmhd.webm (960x540) [95.5 MB] || Water_Water_Everywhere_640x480.mp4 (1280x720) [231.3 MB] || Water_Water_Everywhere_AppleTV.m4v (960x540) [229.2 MB] || Water_Water_Everywhere_H264.mov (1280x720) [2.0 GB] || Water_Water_Everywhere_friday_1280x720.mp4 (1280x720) [231.3 MB] || Water_Water_Everywhere_friday.mov (1280x720) [6.4 GB] || Water_Water_Everywhere_ipod_640x480m4v.m4v (640x360) [72.1 MB] || Water_Water_Everywhere_friday_640x480.mp4 (640x360) [72.1 MB] || Water_Water_Everywhere_1280x720.mp4 (640x480) [97.6 MB] || Water_Water_Everywhere_friday.mp4 (320x180) [30.1 MB] || Water_Water_Everywhere_friday.wmv (320x236) [26.9 MB] ||
Ocean Circulation
Sea Surface Temperature, Salinity and Density
Go to this pageSea Surface TemperatureThe oceans of the world are heated at the surface by the sun, and this heating is uneven for many reasons. The Earth's axial rotation, revolution about the sun, and tilt all play a role, as do the wind-driven ocean surface currents. The first animation in this group shows the long-term average sea surface temperature, with red and yellow depicting warmer waters and blue depicting colder waters. The most obvious feature of this temperature map is the variation of the temperature by latitude, from the warm region along the equator to the cold regions near the poles. Another visible feature is the cooler regions just off the western coasts of North America, South America, and Africa. On these coasts, winds blow from land to ocean and push the warm water away from the coast, allowing cooler water to rise up from deeper in the ocean. ||
The Thermohaline Circulation - The Great Ocean Conveyor Belt
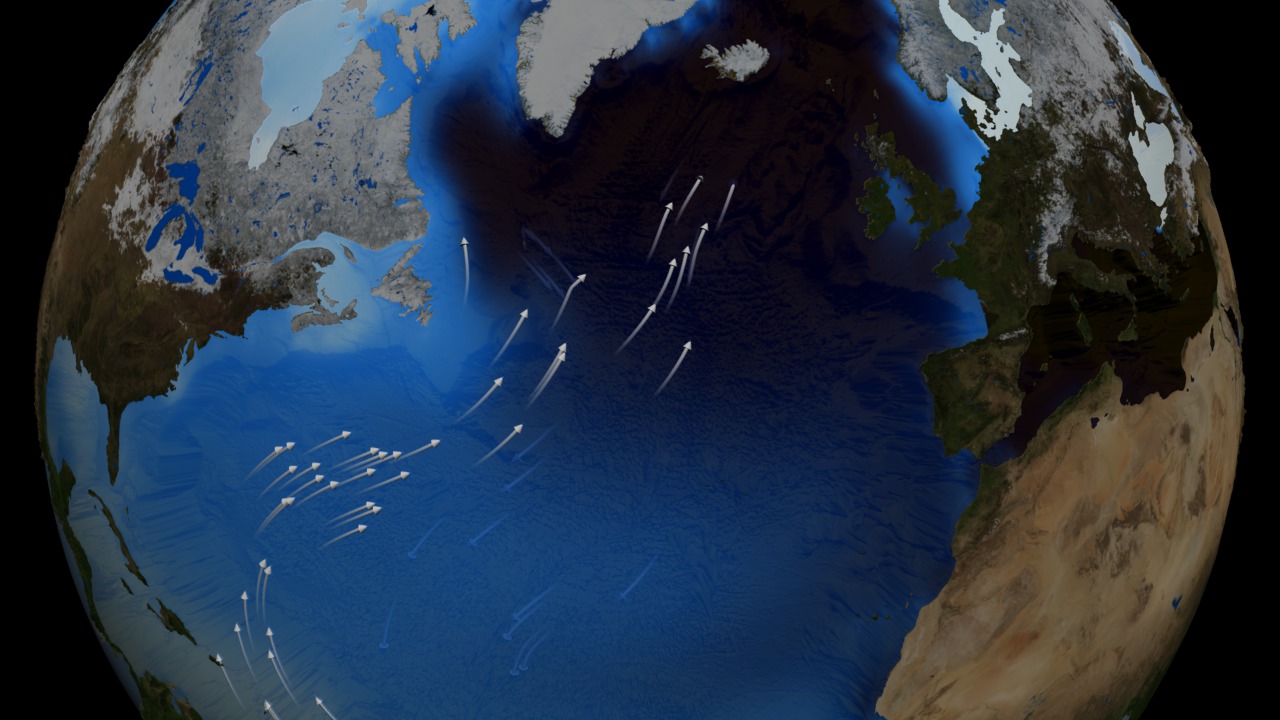
Go to this pageThe oceans are mostly composed of warm salty water near the surface over cold, less salty water in the ocean depths. These two regions don't mix except in certain special areas. The ocean currents, the movement of the ocean in the surface layer, are driven mostly by the wind. In certain areas near the polar oceans, the colder surface water also gets saltier due to evaporation or sea ice formation. In these regions, the surface water becomes dense enough to sink to the ocean depths. This pumping of surface water into the deep ocean forces the deep water to move horizontally until it can find an area on the world where it can rise back to the surface and close the current loop. This usually occurs in the equatorial ocean, mostly in the Pacific and Indian Oceans. This very large, slow current is called the thermohaline circulation because it is caused by temperature and salinity (haline) variations.This animation shows one of the major regions where this pumping occurs, the North Atlantic Ocean around Greenland, Iceland, and the North Sea. The surface ocean current brings new water to this region from the South Atlantic via the Gulf Stream and the water returns to the South Atlantic via the North Atlantic Deep Water current. The continual influx of warm water into the North Atlantic polar ocean keeps the regions around Iceland and southern Greenland mostly free of sea ice year round.The animation also shows another feature of the global ocean circulation: the Antarctic Circumpolar Current. The region around latitude 60 south is the the only part of the Earth where the ocean can flow all the way around the world with no land in the way. As a result, both the surface and deep waters flow from west to east around Antarctica. This circumpolar motion links the world's oceans and allows the deep water circulation from the Atlantic to rise in the Indian and Pacific Oceans and the surface circulation to close with the northward flow in the Atlantic.The color on the world's ocean's at the beginning of this animation represents surface water density, with dark regions being most dense and light regions being least dense (see the animation Sea Surface Temperature, Salinity and Density). The depths of the oceans are highly exaggerated to better illustrate the differences between the surface flows and deep water flows. The actual flows in this model are based on current theories of the thermohaline circulation rather than actual data. The thermohaline circulation is a very slow moving current that can be difficult to distinguish from general ocean circulation. Therefore, it is difficult to measure or simulate. ||
Climate
Climate Change and the Global Ocean
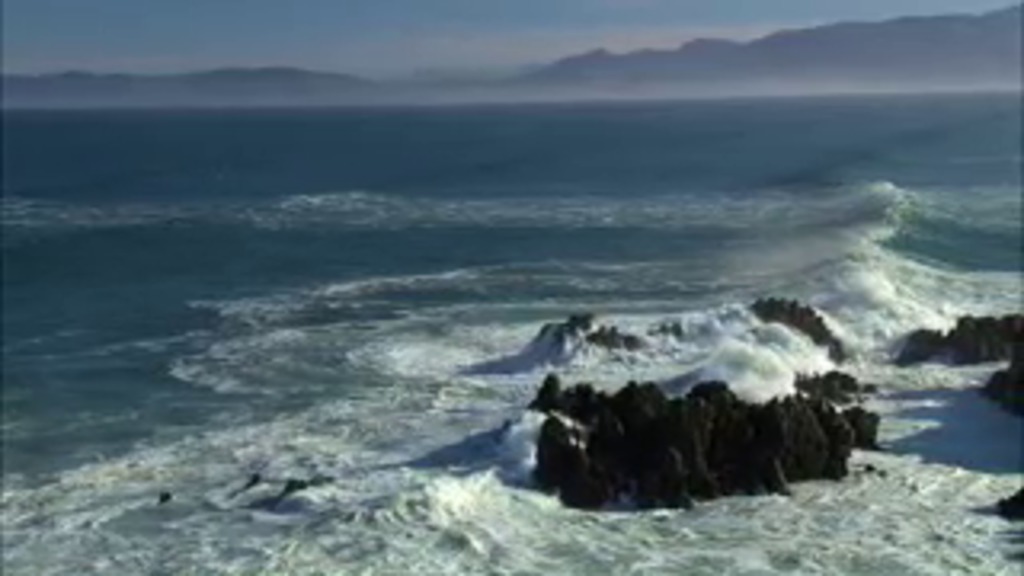
Go to this pageWe know climate change can affect us, but does climate change alter something as vast, deep and mysterious as our oceans? For years, scientists have studied the world's oceans by sending out ships and divers, deploying data-gathering buoys, and by taking aerial measurements from planes. But one of the better ways to understand oceans is to gain an even broader perspective - the view from space. NASA's Earth observing satellites do more than just take pictures of our planet. High-tech sensors gather data, including ocean surface temperature, surface winds, sea level, circulation, and even marine life. Information the satellites obtain help us understand the complex interactions driving the world's oceans today - and gain valuable insight into how the impacts of climate change on oceans might affect us on dry land.For complete transcript, click here. || Global_Ocean_ipod_320x240.01252_print.jpg (1024x576) [77.3 KB] || Global_Ocean_ipod_320x240_web.png (320x180) [84.7 KB] || Global_Ocean_ipod_320x240_thm.png (80x40) [16.1 KB] || Global_Ocean_appletv.webmhd.webm (960x540) [78.2 MB] || Global_Ocean_broll_prores.mov (1280x720) [5.3 GB] || Global_Ocean_1280x720.mp4 (1280x720) [159.8 MB] || Global_Ocean_appletv.m4v (960x540) [187.1 MB] || Global_Ocean_H264_1280x720_30fps.mov (1280x720) [167.6 MB] || Global_Ocean_youtube_1280x720.mov (1280x720) [79.2 MB] || Global_Ocean_ipod_640x480.m4v (640x360) [59.9 MB] || Global_Ocean_ipod_320x240.m4v (320x180) [25.9 MB] || Global_Ocean.wmv (346x260) [39.1 MB] ||
Keeping Up With Carbon
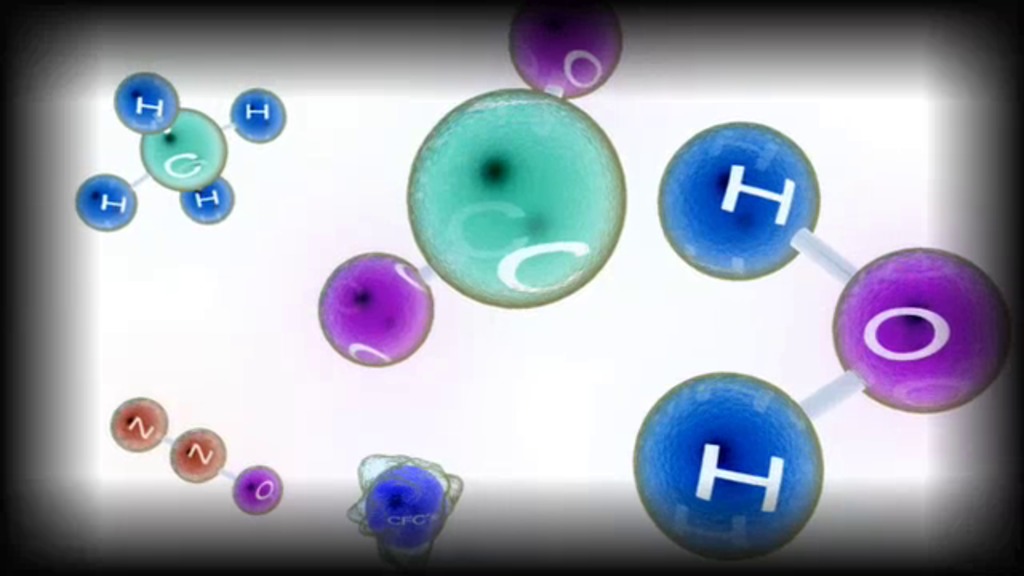
Go to this pageCarbon is all around us. This unique atom is the basic building block of life, and its compounds form solids, liquids, or gases. Carbon helps form the bodies of living organisms; it dissolves in the ocean; mixes in the atmosphere; and can be stored in the crust of the planet. A carbon atom could spend millions of years moving through this complex cycle. The ocean plays the most critical role in regulating Earth's carbon balance, and understanding how the carbon cycle is changing is key to understanding Earth's changing climate. For complete transcript, click here. || Keeping_Up_with_Carbon_640x360_ESWpage.00577_print.jpg (1024x576) [71.2 KB] || Keeping_Up_with_Carbon_640x360_ESWpage_web.png (320x180) [128.6 KB] || Keeping_Up_with_Carbon_640x360_ESWpage_thm.png (80x40) [13.9 KB] || Keeping_Up_with_Carbon_AppleTV.webmhd.webm (960x540) [84.1 MB] || Keeping_Up_with_Carbon_1280x720_ProRes.mov (1280x720) [5.1 GB] || Keeping_Up_with_Carbon_1280x720_H264.mov (1280x720) [159.3 MB] || Keeping_Up_with_Carbon_1280x720_ESWpage.mp4 (1280x720) [133.5 MB] || Keeping_Up_with_Carbon_AppleTV.m4v (960x540) [201.6 MB] || Keeping_Up_with_Carbon_640x360_ipod.m4v (640x360) [63.2 MB] || Keeping_Up_with_Carbon_640x360_ESWpage.mp4 (640x360) [63.2 MB] || Keeping_Up_with_Carbon_512x288.mpg (512x288) [123.9 MB] || Keeping_Up_with_Carbon_320x180.mp4 (320x180) [26.0 MB] || Keeping_Up_with_Carbon.wmv (320x176) [39.0 MB] ||
A Tour of the Cryosphere
Go to this pageA new HD version of this animation is available here.Click here to go to the media download section.The cryosphere consists of those parts of the Earth's surface where water is found in solid form, including areas of snow, sea ice, glaciers, permafrost, ice sheets, and icebergs. In these regions, surface temperatures remain below freezing for a portion of each year. Since ice and snow exist relatively close to their melting point, they frequently change from solid to liquid and back again due to fluctuations in surface temperature. Although direct measurements of the cryosphere can be difficult to obtain due to the remote locations of many of these areas, using satellite observations scientists monitor changes in the global and regional climate by observing how regions of the Earth's cryosphere shrink and expand.This animation portrays fluctuations in the cryosphere through observations collected from a variety of satellite-based sensors. The animation begins in Antarctica, showing ice thickness ranging from 2.7 to 4.8 kilometers thick along with swaths of polar stratospheric clouds. In a tour of this frozen continent, the animation shows some unique features of the Antarctic landscape found nowhere else on earth. Ice shelves, ice streams, glaciers, and the formation of massive icebergs can be seen. A time series shows the movement of iceberg B15A, an iceberg 295 kilometers in length which broke off of the Ross Ice Shelf in 2000. Moving farther along the coastline, a time series of the Larsen ice shelf shows the collapse of over 3,200 square kilometers ice since January 2002. As we depart from the Antarctic, we see the seasonal change of sea ice and how it nearly doubles the size of the continent during the winter.From Antarctica, the animation travels over South America showing areas of permafrost over this mostly tropical continent. We then move further north to observe daily changes in snow cover over the North American continent. The clouds show winter storms moving across the United States and Canada, leaving trails of snow cover behind. In a close-up view of the western US, we compare the difference in land cover between two years: 2003 when the region received a normal amount of snow and 2002 when little snow was accumulated. The difference in the surrounding vegetation due to the lack of spring melt water from the mountain snow pack is evident.As the animation moves from the western US to the Arctic region, the areas effected by permafrost are visible. In December, we see how the incoming solar radiation primarily heats the Southern Hemisphere. As time marches forward from December to June, the daily snow and sea ice recede as the incoming solar radiation moves northward to warm the Northern Hemisphere.Using satellite swaths that wrap the globe, the animation shows three types of instantaneous measurements of solar radiation observed on June 20, 2003: shortwave (reflected) radiation, longwave (thermal) radiation and net flux (showing areas of heating and cooling). Correlation between reflected radiation and clouds are evident. When the animation fades to show the monthly global average net flux, we see that the polar regions serve to cool the global climate by radiating solar energy back into space throughout the year.The animation shows a one-year cycle of the monthly average Arctic sea ice concentration followed by the mean September minimum sea ice for each year from 1979 through 2004. A red outline indicates the mean sea ice extent for September over 22 years, from 1979 to 2002. The minimum Arctic sea ice animation clearly shows how over the last 5 years the quantity of polar ice has decreased by 10 - 14% from the 22 year average.While moving from the Arctic to Greenland, the animation shows the constant motion of the Arctic polar ice using daily measures of sea ice activity. Sea ice flows from the Arctic into Baffin Bay as the seasonal ice expands southward. As we draw close to the Greenland coast, the animation shows the recent changes in the Jakobshavn glacier. Although Jakobshavn receded only slightly from 1042 to 2001, the animation shows significant recession over the past three years, from 2002 through 2004.This animation shows a wealth of data collected from satellite observations of the cryosphere and the impact that recent cryospheric changes are making on our planet.For more information on the data sets used in this visualization, visit NASA's EOS DAAC website. ||


