Climate Vital Signs Dashboard
Overview
NASA monitors the health of our planet to benefit human kind. Our missions track key climate indicators and we share these with the world.


Visualizations
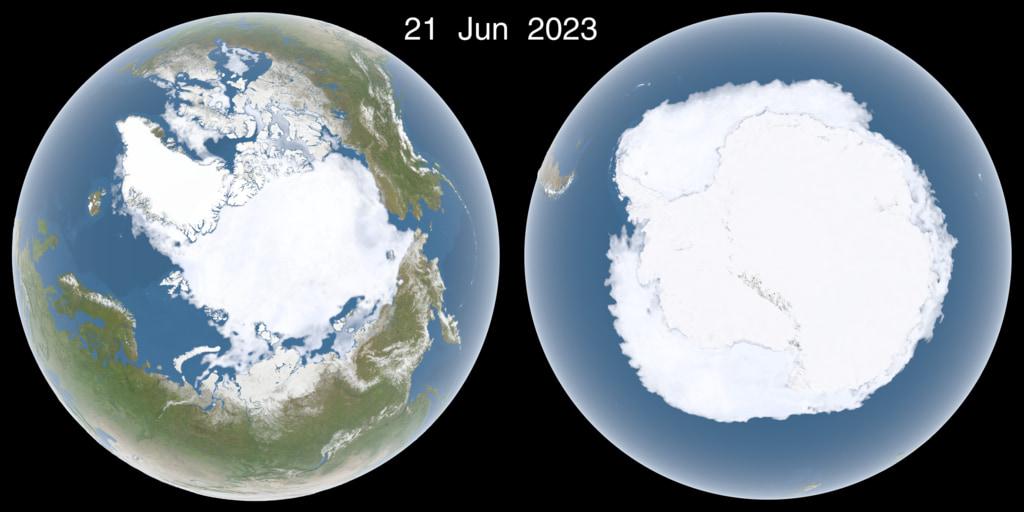
Daily Polar Sea Ice, Two Year History
Go to this pagePolar daily sea ice, two years' history, with dates || polar_sea_ice_sxs_w_date.2023172_print.jpg (1024x512) [109.3 KB] || polar_sea_ice_sxs_w_date.2023172_searchweb.png (320x180) [76.3 KB] || polar_sea_ice_sxs_w_date.2023172_thm.png (80x40) [6.7 KB] || polar_sea_ice_sxs_w_date_2048p30_h265.mp4 (4096x2048) [39.5 MB] || polar_sea_ice_sxs_w_date_2048p30_h265.webm (4096x2048) [6.2 MB] || w_dates (4320x2160) [0 Item(s)] ||
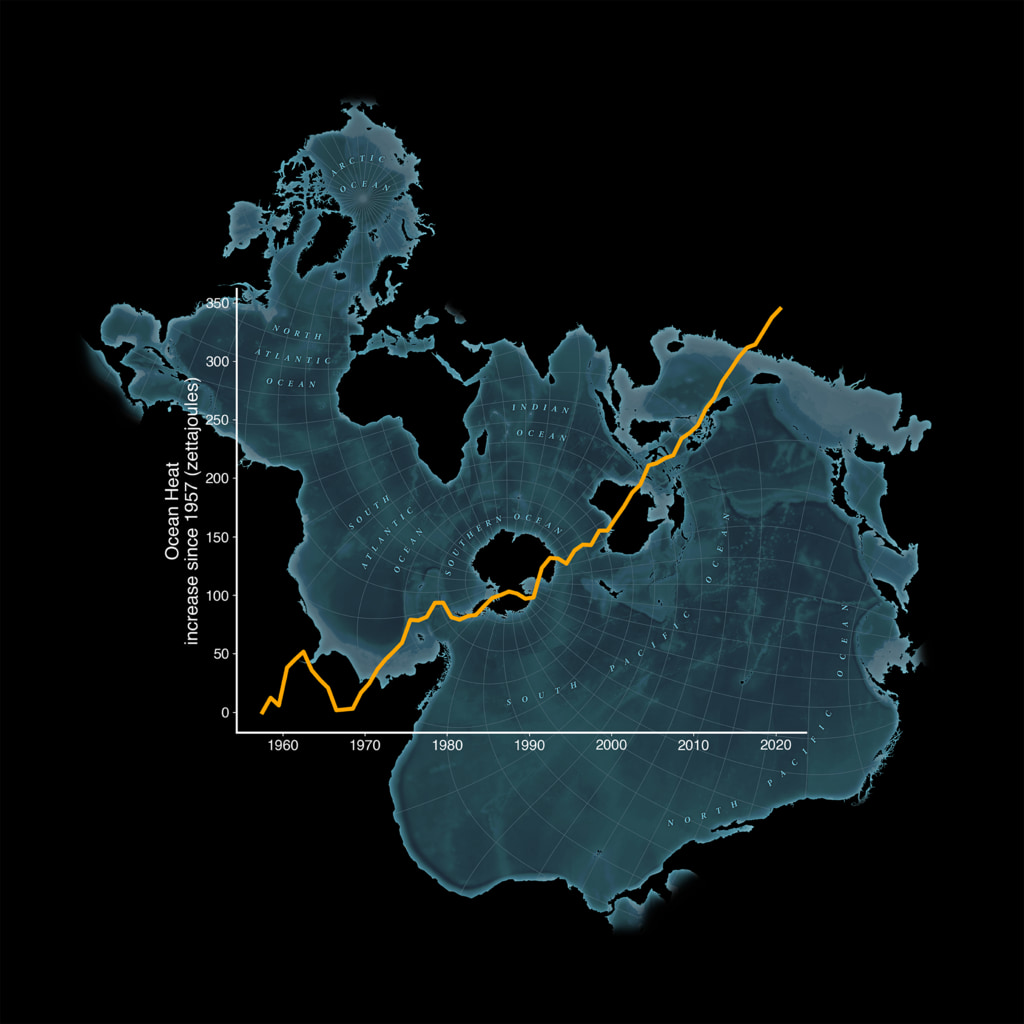
Increase in Ocean Heat since 1957 Map - Spilhaus Projection
Go to this pageA graph of changes in ocean heat content since 1957 overlaying a Spilhaus projection map highlighting the world’s oceans. || oceans_spilhaus_map2160_print.jpg (1024x1024) [151.3 KB] || oceans_spilhaus_map2160.png (2160x2160) [2.2 MB] || oceans_spilhaus_map2160_searchweb.png (320x180) [62.9 KB] || oceans_spilhaus_map2160_thm.png (80x40) [5.4 KB] ||
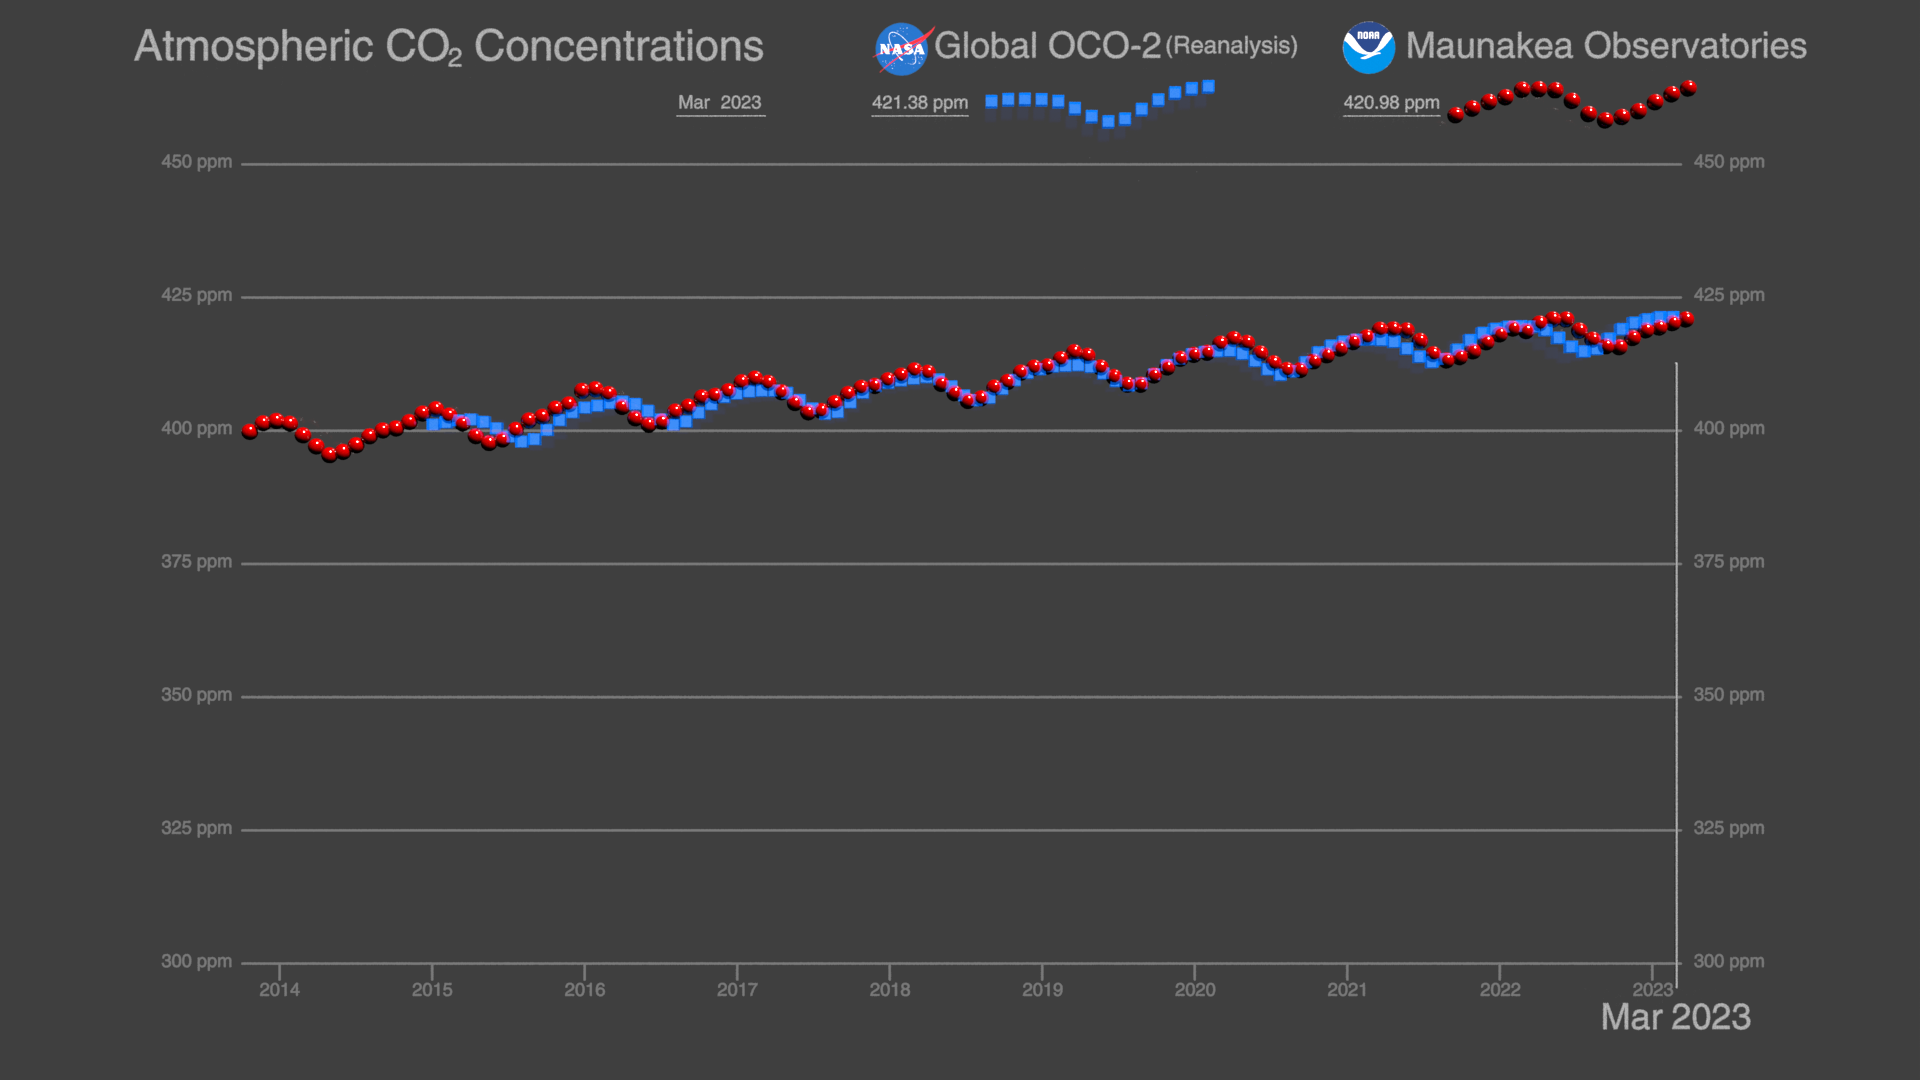
OCO-2 and Keeling Curve: Trends in global atmospheric Carbon Dioxide (CO₂)
Go to this pageOCO-2 and Keeling Curve trends in global atmospheric carbon dioxide. || KeelingCurve_OCO2_1920x1080p30.00370_print.jpg (1024x576) [49.6 KB] || KeelingCurve_OCO2_1920x1080p30.00370.png (1920x1080) [357.7 KB] || KeelingCurve_OCO2_1920x1080p30.00370_searchweb.png (320x180) [16.8 KB] || KeelingCurve_OCO2_1920x1080p30.00370_thm.png (80x40) [2.1 KB] || 1920x1080_16x9_30p (1920x1080) [0 Item(s)] || OCO2_KeelingCurve_1920x1080p30.mp4 (1920x1080) [5.3 MB] || KeelingCurve_OCO2_1920x1080p30.00370.exr (1920x1080) [2.3 MB] || OCO2_KeelingCurve_1920x1080p30.mp4.hwshow [225 bytes] ||
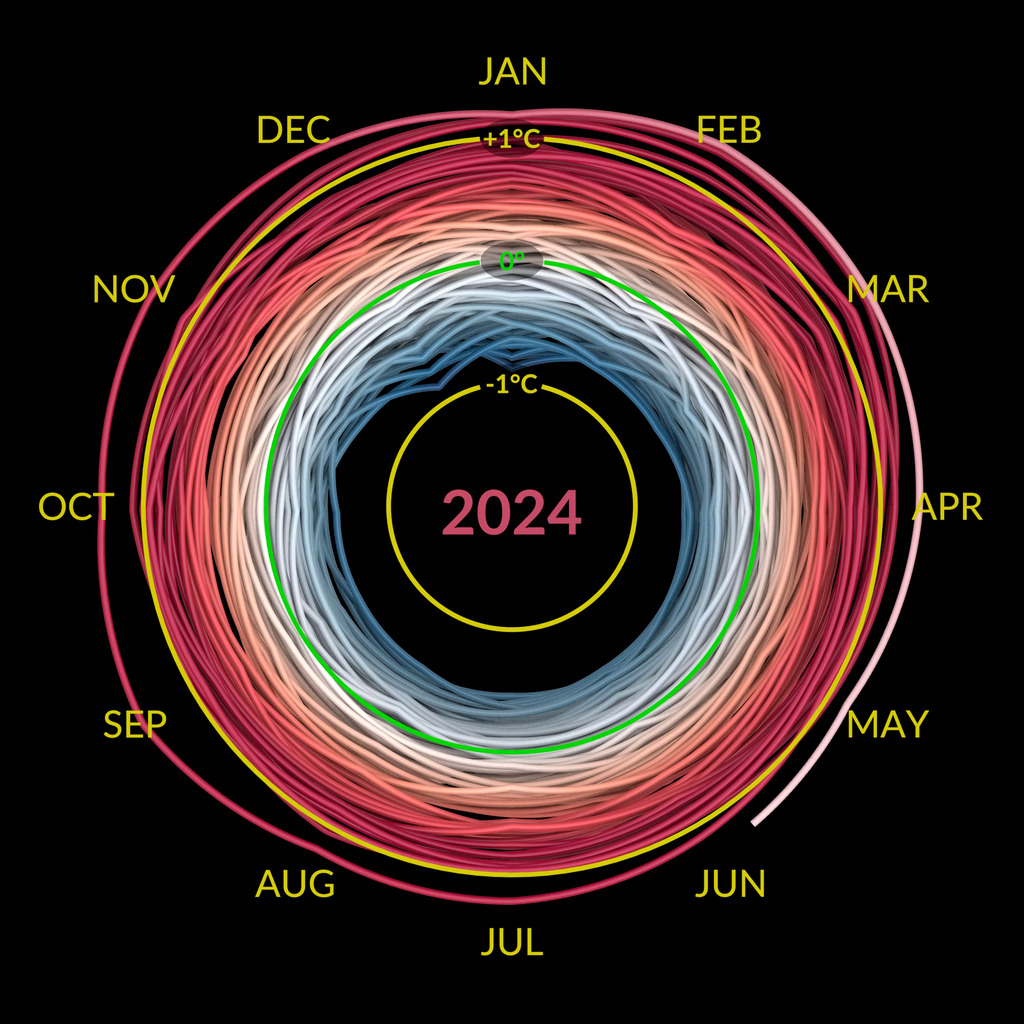
NASA Climate Spiral 1880-Present
Go to this pageThe NASA climate spiral visualization of the GISTEMP global temperature record.
Global Temperature Anomalies from 1880 to 2023
Go to this pageThis color-coded map in Robinson projection displays a progression of changing global surface temperature anomalies. Normal temperatures are shown in white. Higher than normal temperatures are shown in red and lower than normal temperatures are shown in blue. Normal temperatures are calculated over the 30 year baseline period 1951-1980. The maps are averages over a running 24 month window. The final frame represents global temperature anomalies in 2023. || 2023GISTEMP_Map.00899_print.jpg (1024x576) [138.7 KB] || 2023GISTEMP_Map.00899_searchweb.png (320x180) [66.6 KB] || 2023GISTEMP_Map.00899_thm.png (80x40) [6.4 KB] || 2023GISTEMP_Map.00899_web.png (320x180) [65.9 KB] || 2023GISTEMP_Map_HD.mp4 (1920x1080) [57.2 MB] || 3840x2160_16x9_30p (3840x2160) [0 Item(s)] || 2023GISTEMP_Map.mp4 (3840x2160) [114.3 MB] || earth_observations_5x3.hwshow ||
Global Temperature Graph 1880-Present
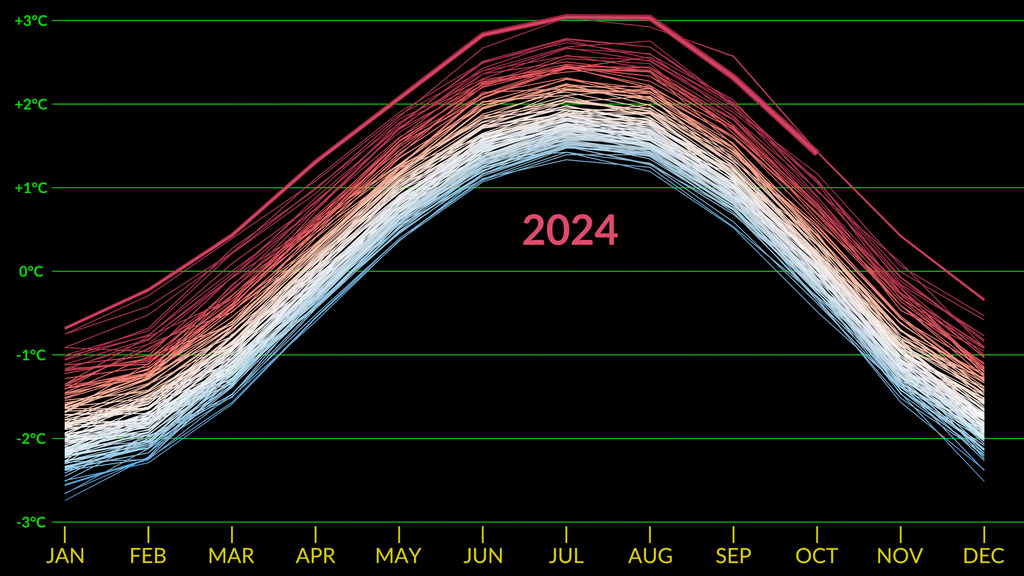
Go to this pageThe seasonal cycle of temperature variation on the earth's surface. This version is labeled in English and Celsius. || GISTEMP_Curves_English_degC_2160p60.01750_print.jpg (1024x576) [180.8 KB] || GISTEMP_Curves_English_degC_2160p60.01750_searchweb.png (320x180) [47.7 KB] || GISTEMP_Curves_English_degC_2160p60.01750_thm.png (80x40) [4.2 KB] || GISTEMP_Curves_English_degC_2160p60.01750_web.png (320x180) [48.2 KB] || GISTEMP_Curves_English_degC_2160p60.mp4 (3840x2160) [37.0 MB] || En_C (3840x2160) [0 Item(s)] || GISTEMP_Curves_English_degC_2160p60.mp4.hwshow [132 bytes] ||
Zonal Climate Anomalies 1880-2023
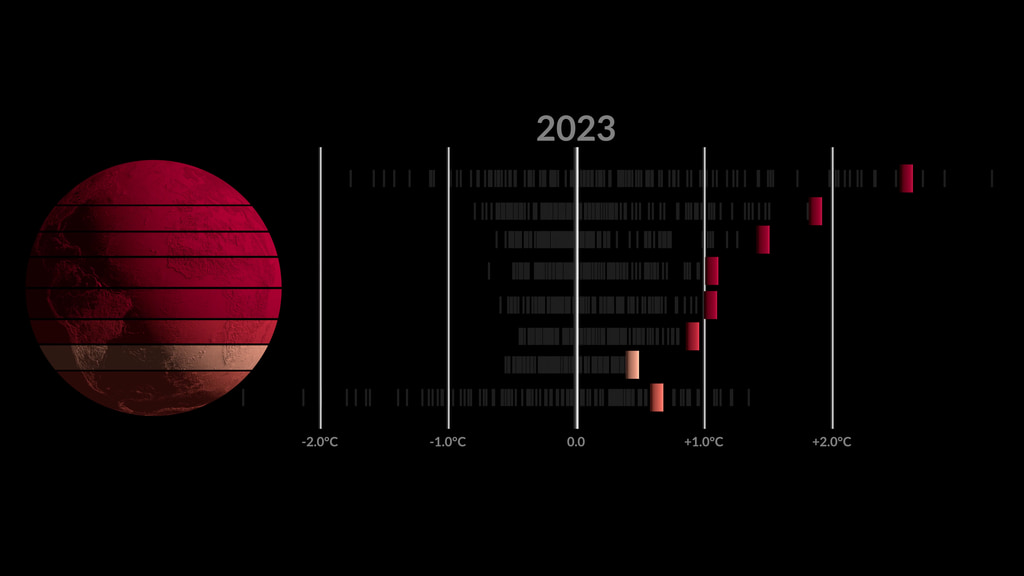
Go to this pageA visualization of zonal temperature anomalies. The latitude zones are 90N-64N, 64N-44N, 44N-24N, 24N-EQU, EQU-24S, 24S-44S, 44S-64S, 64S-90S. The anomalies are calculated relative to a baseline period of 1951-1980. This version is in Celsius, an alternate version in Fahrenheit is also available. || GISTEMP_Zonal_1880-2023_C.00840_print.jpg (1024x576) [43.1 KB] || GISTEMP_Zonal_1880-2023_C.00840_searchweb.png (320x180) [18.0 KB] || GISTEMP_Zonal_1880-2023_C.00840_thm.png (80x40) [2.5 KB] || GISTEMP_Zonal_1880-2023_C.mp4 (3840x2160) [20.2 MB] || degC (3840x2160) [0 Item(s)] || GISTEMP_Zonal_1880-2023_C.mp4.hwshow ||
Arctic Sea Ice Minimum 2024
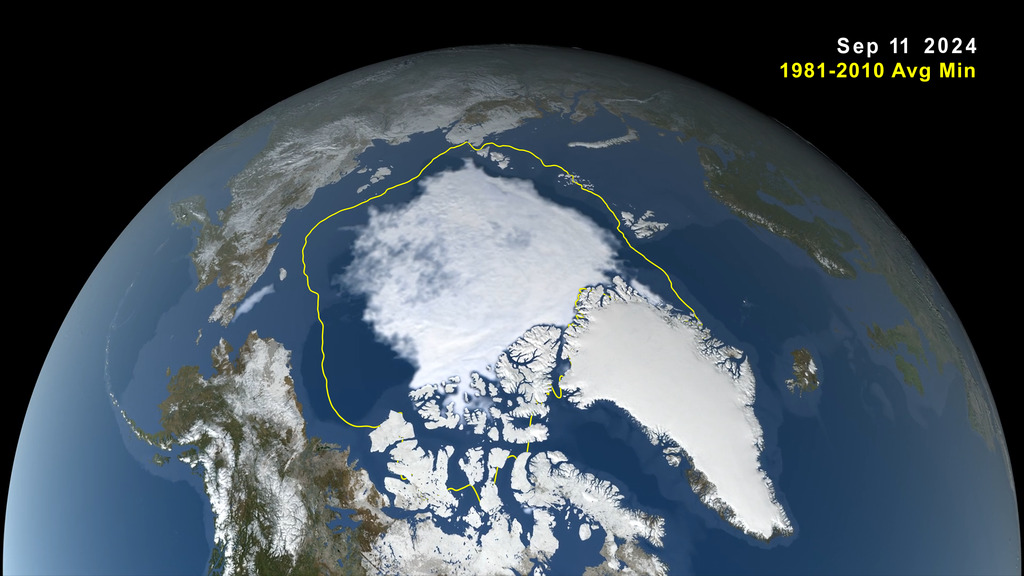
Go to this pageAnimation of Arctic sea ice maximum extent, March 14 2024, to its minimum, September 11, 2024 || sea_ice_2024_min_2160p60.2608_print.jpg (1024x576) [152.6 KB] || sea_ice_2024_min_2160p60.2608_searchweb.png (320x180) [74.6 KB] || sea_ice_2024_min_2160p60.2608_thm.png (80x40) [6.0 KB] || sea_ice_2024_min_1080p60.mp4 (1920x1080) [38.2 MB] || sea_ice_min_2024 [0 Item(s)] || sea_ice_2024_min_2160p60.mp4 (3840x2160) [106.6 MB] || sea_ice_2024_min_2160p60.mp4.hwshow [190 bytes] ||
Sea Level Through a Porthole (2023)
Go to this pageAs the planet warms and polar ice melts, our global average sea level is rising. Although exact ocean heights vary due to local geography, climate over time, and dynamic fluid interactions with gravity and planetary rotation, scientists observe sea level trends by comparing measurements against a 20 year spatial and temporal mean reference. These visualizations use the visual metaphor of a submerged porthole window to observe how far our oceans rose between 1993 and 2023. ||
