Computer Modeling
Near-Earth Region
Tour of the Magnetosphere
Go to this pageTour of the Earth's magnetosphere generated for 'Live from the Aurora'. This viz pulls out from the Earth and fades in components of the magnetosphere. ||
Magnetosphere II: The Solar Wind Strikes Back!
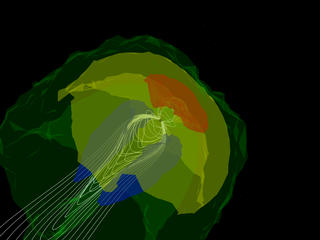
Go to this pageA view of a computer-generated model of the Earth's magnetosphere. Semi-transparent surfaces represent particle density (red is high, blue is low), the silvery tube represent magnetic field lines and the yellow ribbons represent the paths of charged solar wind particles. In this particular model, the solar wind has an ambient density of 8.35 particles/cm^3. The isosurfaces are then red (> 17 particles/cm^3), yellow (> 12 particles/cm^3), green (> 8.6 particles/cm^3) and blue (< 1.0 particle/cm^3). ||
The Magnetosphere: Earth Raises its Shields
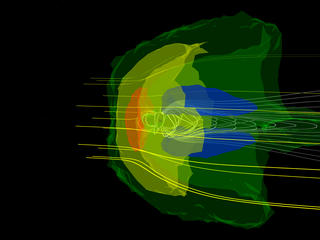
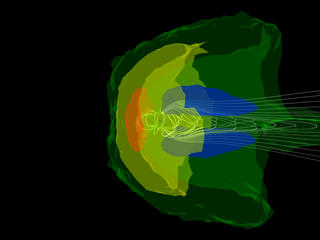
Go to this pageA view of a computer-generated model of the Earth's magnetosphere. Semi-transparent surfaces represent particle density (red is high, blue is low) and silvery tubes represent the magnetic field lines. In this particular model, the solar wind has an ambient density of 8.35 particles/cm^3. The isosurfaces are then red (> 17 particles/cm^3), yellow (> 12 particles/cm^3), green (> 8.6 particles/cm^3) and blue (< 1.0 particle/cm^3). ||
Global Hybrid Versus MHD Modeling of the Magnetosphere: Magnetic Potential
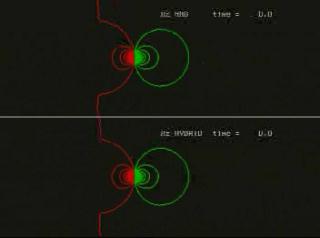
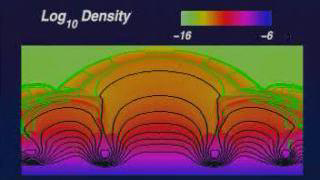
Go to this pageThis series of animations compares a two-dimensional global hybrid simulation with an magnetohydrodynamic model of the interaction of the solar wind with the Earth's magnetosphere. ||
Solar Modeling
Model of the Heliosphere Over the Solar Cycle
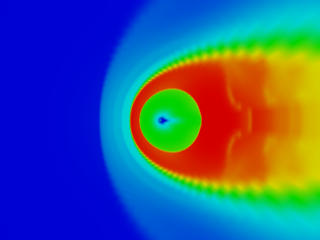
Go to this pageThis magnetohydrodynamical (MHD) model shows how the heliosphere of the Sun might interact with the local interstellar medium (ISM) over the course of a single 11 year solar cycle. The sun (and the orbit of the Earth) is located in the tiny blue region in the center. The ISM is moving from left to right. The solar wind varies from 400 km/s up to 566 km/s and back down to 400 km/s over the cycle in this particular model. The colors are logarithmically scaled to represent temperature, with blue around 10,000 Kelvins (in the undisturbed ISM and the region immediately around the Sun) and red over 1,000,000 Kelvins (corresponding to the bow shocked region in the plasma). The green region around the Sun has a radius that varies between 100-200 Astronomical Units. ||
Bastille Day Flare Without Matter Motion
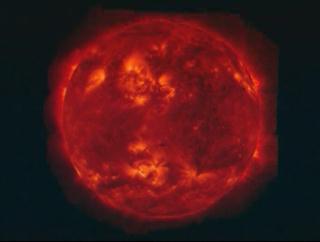
Go to this pageFly-in of TRACE full sun image to the flare location. Fade to a model of the field lines with a magnetogram of the solar surface. Pull back out to display a movie of flare images. This version does not show the matter motion along the field lines. ||
Solar Dynamo
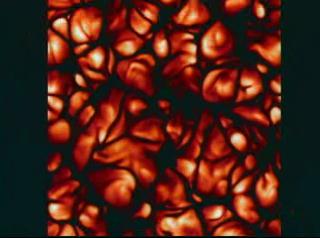
Go to this pageA dynamo is a mechanism for a star or planet to create magnetic field. One type of solar dynamo is turbulent convection, which researchers have simulated on a supercomputer. Like soup boiling on a stove, gas at the Sun's surface is heated from the bottom and cooled at the top. Since the gas conducts electricity, these motions produce magnetic fields. ||
