Earth Day with Landsat
Conversations with Landsat Experts
These are excerpts from an Earth Day DLN webcast that features scientists and engineers discussing how the Landsat mission has helped us see and study our changing planet.
NASA DLN Presents Earth Day with Landsat
Go to this pageThese are excerpts from an Earth Day DLN webcast that features scientists and engineers discussing how the Landsat mission has helped us see and study our changing planet. ||
Image Gallery
- Link
Landsat on Flickr
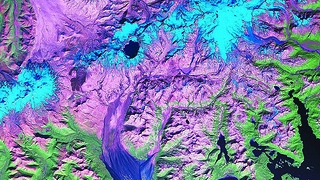
Launched in 1972, the Landsat program is the longest continuous global record of the Earth's surface. It continues to deliver both visually stunning and scientifically valuable images of our changing planet, allowing us to plan for the future of Earth's precious resources.
Go to this link
Interactive Feature
- Link
Land Cover Changes Over Time
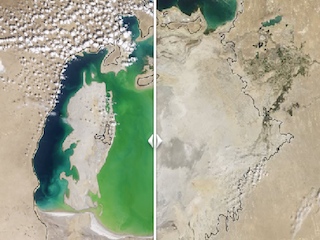
The first step in understanding change is monitoring, and the second step is analysis. Landsat satellites have been observing the Earth's land surface since 1972, providing us with an invaluable record of landscape scale change. Explore these remarkable images as the shift over time with the interactive slider tool.
Go to this link
Videos
A Landsat Flyby
Go to this pageThe Landsat program is the longest continuous global record of the Earth's surface, and continues to deliver both visually stunning and scientifically valuable images of our planet. This short video highlights Landsat's many benefits to society. ||
Landsat: A Space Age Water Gauge
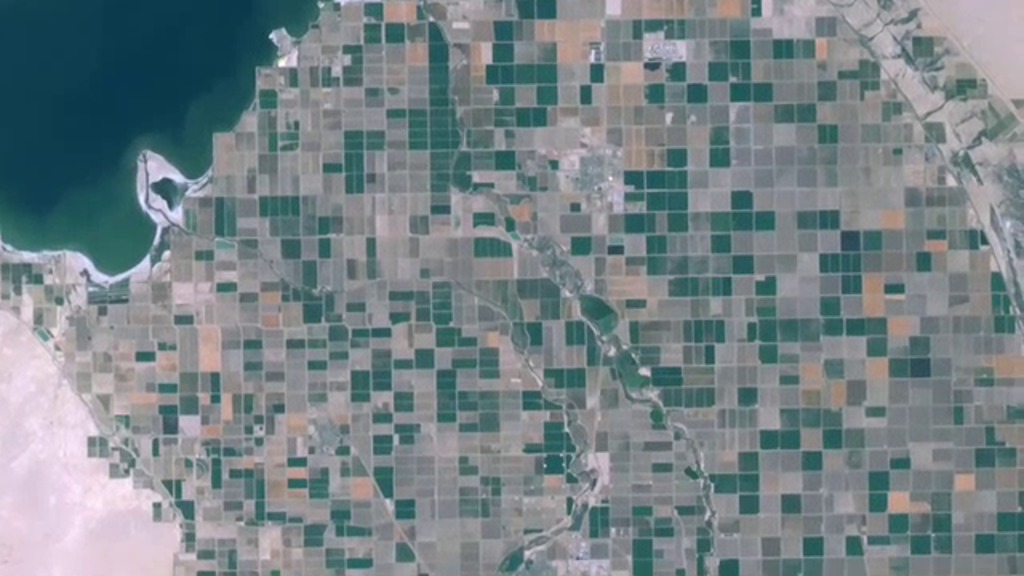
Go to this pageAgriculture consumes a great deal of water. As demand for water increases, the pressure's on to make sure every drop counts. ||
Katrina Retrospective: 5 Years After the Storm
Go to this pageOn August 29, 2005, Hurricane Katrina made landfall along the Gulf Coast. Five years later, NASA revisits the storm with a short video that shows Katrina as captured by satellites. Before and during the hurricane's landfall, NASA provided data gathered from a series of Earth observing satellites to help predict Katrina's path and intensity. In its aftermath, NASA satellites also helped identify areas hardest hit.For complete transcript, click here. || G2010-104_Hurricane_Katrina_appleTV.00427_print.jpg (1024x576) [144.4 KB] || G2010-104_Hurricane_Katrina_appleTV_web.png (320x180) [295.6 KB] || G2010-104_Hurricane_Katrina_appleTV_thm.png (80x40) [17.7 KB] || G2010-104_Hurricane_Katrina_appleTV.m4v (960x540) [144.9 MB] || G2010-104_Hurricane_Katrina.wmv (1280x720) [90.1 MB] || G2010-104_Hurricane_Katrina_youtube_hq.mov (1280x720) [203.1 MB] || G2010-104_Hurricane_Katrina_prores.mov (1280x720) [3.0 GB] || G2010-104_Hurricane_Katrina_appleTV.webmhd.webm (960x540) [43.9 MB] || G2010-104_Hurricane_Katrina_ipod_lg.m4v (640x360) [55.8 MB] || G2010-104_Hurricane_Katrina_portal.mov (640x360) [119.5 MB] || G2010-104_Hurricane_Katrina_nasacast.m4v (320x240) [25.5 MB] || G2010-104_Hurricane_Katrina_SVS.mpg (512x288) [27.6 MB] ||
Guided Tour of LIMA Flyover
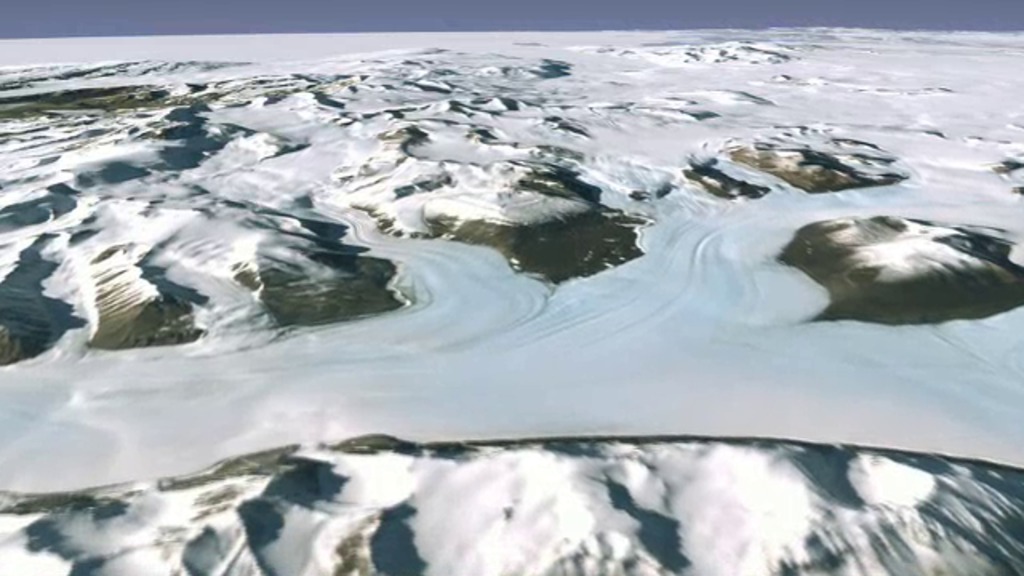
Go to this pageIn 2007, more than 1,100 Landsat 7 images were used to create the first ever, high-resolution, true color map of Antarctica. The Landsat Image Mosaic of Antarctica (LIMA) is a virtually cloud-free, 3-D view of Antarctica's frozen landscape produced by NASA, working with the National Science Foundation, the U.S. Geological Survey and the British Antarctic Survey.Visualizers stitched together Landsat 7 satellite imagery acquired in 1999 and 2001 with a digital elevation model and field data measurements. ||
Earth Observing Landsat 5 Turns 25 Years Old
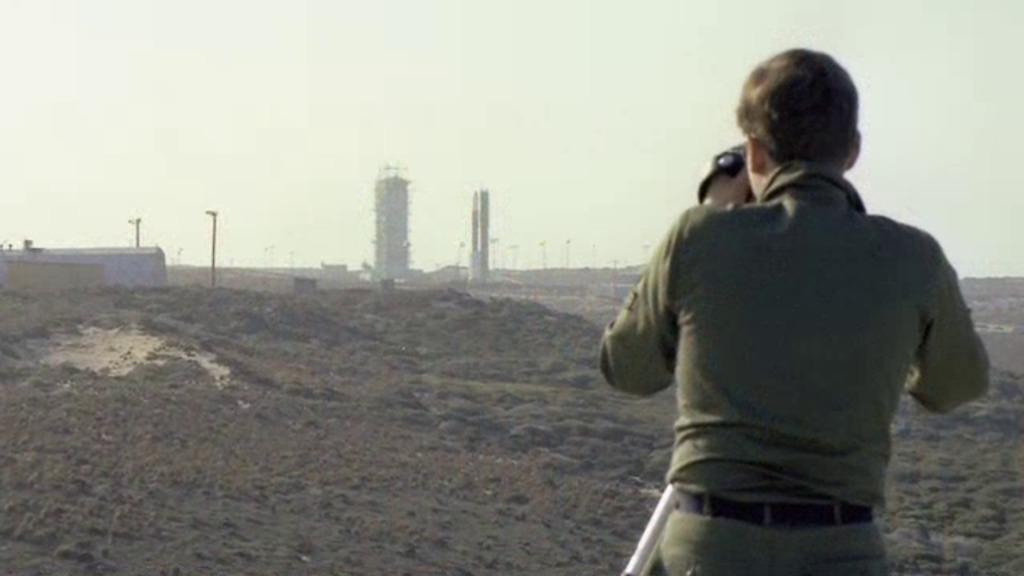
Go to this pageStill observing the Earth after 25 years—22 beyond its three-year primary mission lifetime—Landsat 5 collects valuable scientific data daily. Some attribute the satellite's longevity to over-engineering. Others say it's a long run of good luck. Whatever the reason, no one who attended the satellite's March 1984 launch could have expected it would still be working today.For complete transcript, click here. || Landsat5_turns_25_ipodLG.00202_print.jpg (1024x576) [73.2 KB] || Landsat5_turns_25_ipodLG_web.png (320x180) [149.4 KB] || Landsat5_turns_25_ipodLG_thm.png (80x40) [13.9 KB] || Landsat5_turns_25_appletv.webmhd.webm (960x540) [51.8 MB] || Landsat5_turns_25_appletv.m4v (960x540) [87.6 MB] || Landsat5_turns_25_YouTube.mov (1280x720) [56.6 MB] || Landsat5_turns_25_fullresH264.mov (1280x720) [119.3 MB] || Landsat5_turns_25_ipodLG.m4v (640x360) [42.3 MB] || Landsat5_turns_25_svsSM.mpg (512x288) [32.8 MB] || Landsat5_turns_25_ipodSM.m4v (320x180) [16.4 MB] || Landsat5_turns_25_NASAcast.mp4 (320x236) [30.9 MB] || GSFC_20090227_Landsat5turns25.wmv (346x260) [30.5 MB] ||
Rise of the Three Gorges Dam
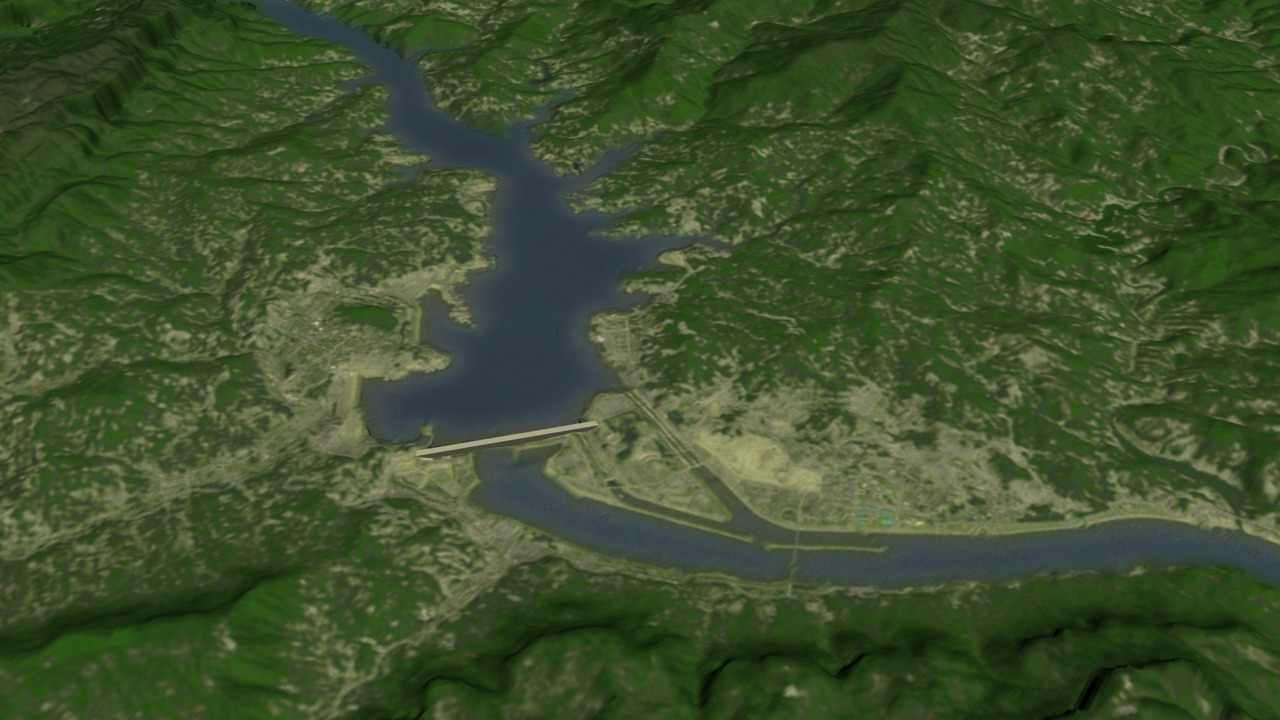
Go to this pageSome call it the eighth wonder of world; others say it's the next Great Wall of China. Upon completion in 2009, the Three Gorges Dam will be the world's largest hydroelectric power generator. One of the few man-made structures so enormous that it's actually visible to the naked eye from space, NASA's Landsat satellite has had a closer look, providing detailed, vivid views of the dam since its inception in 1994. The dam is built along the Yangtze River, the third largest in the world, stretching more than 3,900 miles across China before reaching its mouth near Shanghai. Historically, the river has been prone to massive flooding, overflowing its banks about once every ten years. During the 20th century alone, Chinese authorities estimate that some 300,000 people were killed from Yangtze River floods. The dam is designed to greatly improve flood control on the river and protect the 15 million people and 3.7 million acres of farmland in the lower Yangtze flood plains. Observations from the NASA-built Landsat satellites provide an overview of the dam's construction. The earliest data set, from 1987, shows the region prior to start of construction. By 2000, construction along each riverbank was underway, but sediment-filled water still flowed through a narrow channel near the river's south bank. The 2004 data shows development of the main wall and the partial filling of the reservoir, including numerous side canyons. By mid-2006, construction of the main wall was completed and a reservoir more than 2 miles (3 kilometers) across had filled just upstream of the dam. To read more about the Three Gorges Dam, please click here. This animation was designed in three parts: Part 1: The first part of this animation zooms in to the Three Gorges Dam and travels backward and forward through time emphasizing the dam construction and filling of the reservoir. This animation then continues seemlessly into Part 2. Part 2: Starting where Part 1 leaves off, the camera flies up the 2006 data showing the high water levels that have already filled the multiple gorges upstream. Part 3: Identical to Part 2, except showing the 1987 data prior to the dam construction. ||
Classroom Activities and Resources
- Link
Classroom Activity Matrix
Discover classroom activities that use Landsat. To help you find the activity that is right for you, we have created an activity matrix that lets you choose activities based on grade-level, product description, and activity keywords.
Go to this link - Link
IMAGERS: Echo the Bat and Amelia the Pigeon
IMAGERS (Interactive Multimedia Adventures for Grade-school Education using Remote Sensing) project, developed upon a framework that allows for the incorporation of new content, geographic location, and story line using satellite imagery as the foundation.
Go to this link - Link
Landsat Image Mosaic of Antarctica (LIMA)
The first-ever true-color high-resolution satellite view of the Antarctic continent enabling everyone to see Antarctica as it appears in real life.
Go to this link - Link
GLOBE Land Cover and Biology
GLOBE is a hands-on international environmental science and education program and links students, teachers, and the scientific research community in an effort to learn more about our environment through student data collection and observation.
Go to this link - Link
EarthExplorer
The USGS presents a searchable global database of Landsat and other Earth-observing platforms.
Go to this link

