Greenhouse Gases Dashboard
Overview
NASA and its partner agencies track greenhouse gases for space, air, and ground. our scientists model the flow of these gases around our planet.


Visualizations
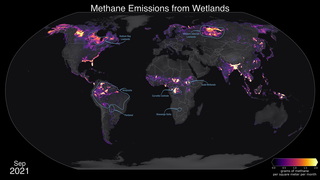
Methane Emissions from Wetlands
Go to this section
Methane is an important greenhouse gas that contributes substantially to global warming. On a molecule by molecule basis, methane is much more efficient at trapping heat than carbon dioxide, the main driver of warming. Though human activities, including agriculture, oil and natural gas production and use, and waste disposal, collectively contribute the majority of methane to the atmosphere, about a third of total methane emissions comes from wetlands. Wetland habitats are filled with things like waterlogged soils and permafrost, which makes them sizable carbon sinks. However, as the climate changes, these carbon-rich soils are vulnerable to flooding and to rising temperatures, which can release more carbon to the atmosphere in the form or methane. Understanding methane emissions from natural sources like wetlands is critically important to scientists and policymakers who are working to ensure that changes in natural systems don’t counteract progress in combatting climate change made by reducing emissions from human activities. This animation shows estimates of wetland methane emissions produced by the Lund–Potsdam–Jena Dynamic Global Vegetation Model (LPJ-DGVM) Wald Schnee und Landscaft version (LPJ-wsl). LPJ-wsl is a prognostic model, meaning that it can be used to simulate future changes in wetland emissions and independently verified with remote sensing data products. The model includes a complex, topography dependent model of near surface hydrology, and a permafrost and dynamic snow model, allowing it to produce realistic distributions of inundated area. Highlighted areas show concentrated methane sources from tropical and high latitude ecosystems. The LPJ-wsl model is regularly used in conjunction with NASA’s GEOS model to simulate the impact of wetlands and other methane sources on atmospheric methane concentrations, compare against satellite and airborne data, and to improve understanding and prediction of wetland emissions.Methane Emissions in the United States
Go to this section
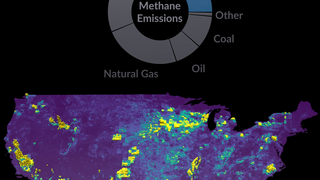
Methane is the second most important greenhouse gas contributing to climate change. While emissions are substantially lower than for carbon dioxide, the biggest driver of climate change, methane is more efficient at trapping heat on a molecule by molecule basis. As a result, understanding the sources of methane and how they can be reduced, quickly, is a major effort of policymakers and environmental managers around the world. This visualization presents gridded methane emissions across the United States for the year 2012. The gridded methane inventory is designed to be consistent with EPA’s 2016 Inventory of U.S. Greenhouse Gas Emissions and Sinks for the year 2012, which presents national totals for different source types. Gridded estimates with 0.1 degree spatial resolution are produced using a wide range of databases at the state, county, local, and point source level to allocate the spatial and temporal distribution of emissions for individual source types. Gridded inventories, developed with support from NASA’s Carbon Monitoring System, help researchers use satellite, airborne, and in situ observations to independently evaluate EPA inventories and provide recommendations on refinements that may be needed. Additional detail and dataset access are available at the EPA website. The gridded inventory presents totals for different major methane source types. Agriculture emissions in this visualization include manure management, enteric fermentation, rice cultivation, and field burning. Waste emissions include landfills, wastewater treatment, and composting. Natural Gas emissions include emissions from production, processing, and transmission. Coal emissions include both active and abandoned coal mines.Net Ecosystem Exchange of Carbon Dioxide
Go to this pageThe NASA Carbon Monotoring System's estimate of the Net Ecosystem Exchange of Carbon Dioxide from 2000 to 2018. || co2_nee_5.01750_print.jpg (1024x576) [124.3 KB] || co2_nee_5.01750_searchweb.png (320x180) [43.8 KB] || co2_nee_5.01750_thm.png (80x40) [4.5 KB] || 3840x2160_16x9_30p (3840x2160) [64.0 KB] || co2_nee_5.webm (3840x2160) [14.2 MB] || co2_nee_5.mp4 (3840x2160) [256.2 MB] ||
Global Atmospheric Carbon Dioxide (CO₂)
Go to this pageVolumetric visualization of the total carbon dioxide (CO₂) on a global scale added on Earth's atmosphere over the course of the year 2021. || TotalCO2_Comp_1920x1920p30_00080.png (1920x1920) [3.2 MB] || TotalCO2_Comp_1920x1920p30_00080_print.jpg (1024x1024) [168.5 KB] || VolumetricCO2_Composite (1920x1920) [0 Item(s)] || VolumetricCO2_Composite_1920x1920p30.mp4 (1920x1920) [806.2 MB] ||
Global Atmospheric Methane (CH₄)
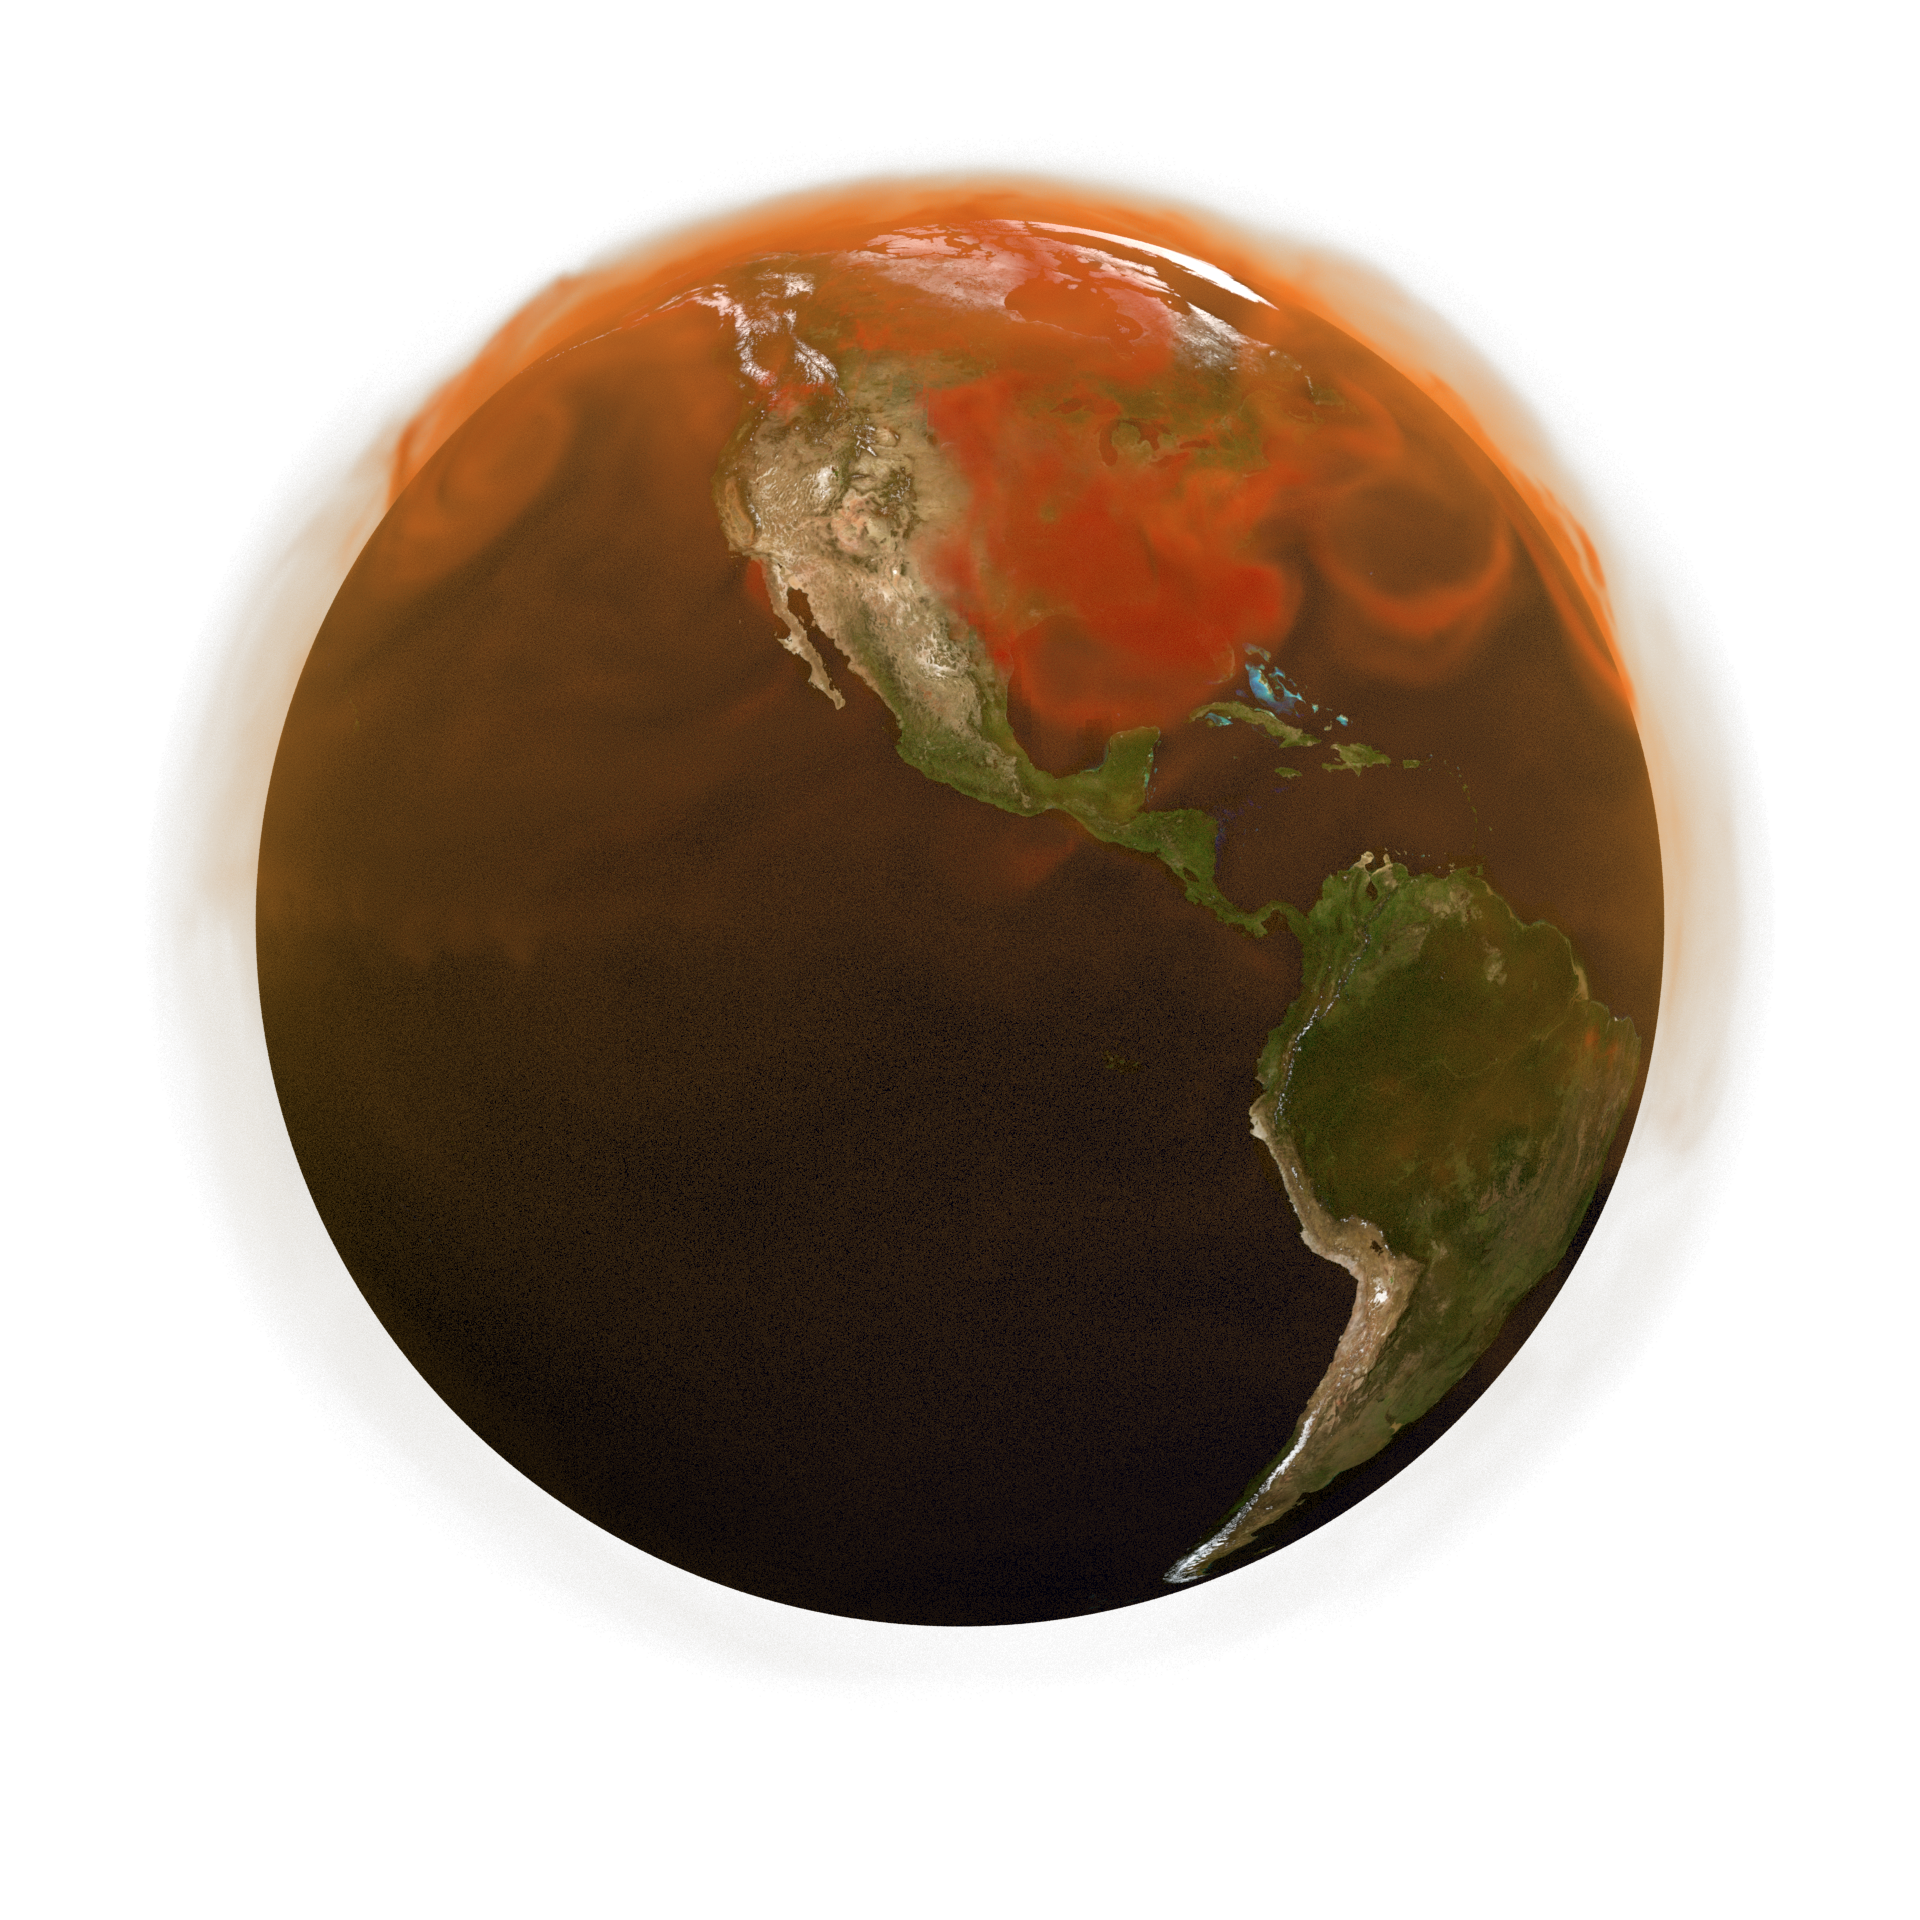
Go to this pageVolumetric visualization of the total Methane (CH₄) on a global scale added on Earth's atmosphere over the course of the year 2021. || TotalCH4_Comp_1920x19020p30_00080.png (1920x1920) [2.5 MB] || TotalCH4_Comp_1920x19020p30_00080_print.jpg (1024x1024) [114.9 KB] || VolumetricCH4_Composite (1920x1920) [0 Item(s)] || VolumetricCH4_Composite_1920x19020p30.mp4 (1920x1920) [353.5 MB] ||
Trends in atmospheric Methane (CH₄)
Go to this pageGlobal trends in atmospheric Methane (CH₄) for the period July 1983-December 2022. || CH4Trends_1920x1080p30.00900_print.jpg (1024x576) [64.5 KB] || CH4Trends_1920x1080p30.00900.png (1920x1080) [766.2 KB] || CH4Trends_1920x1080p30.00900_searchweb.png (320x180) [26.3 KB] || CH4Trends_1920x1080p30.00900_thm.png (80x40) [3.5 KB] || CH4_Trends_1920x1080.mp4 (1920x1080) [4.4 MB] || 1920x1080_16x9_30p (1920x1080) [0 Item(s)] || CH4Trends_1920x1080p30.00900.exr (1920x1080) [1.7 MB] || CH4_Trends_1920x1080.mp4.hwshow [408 bytes] ||
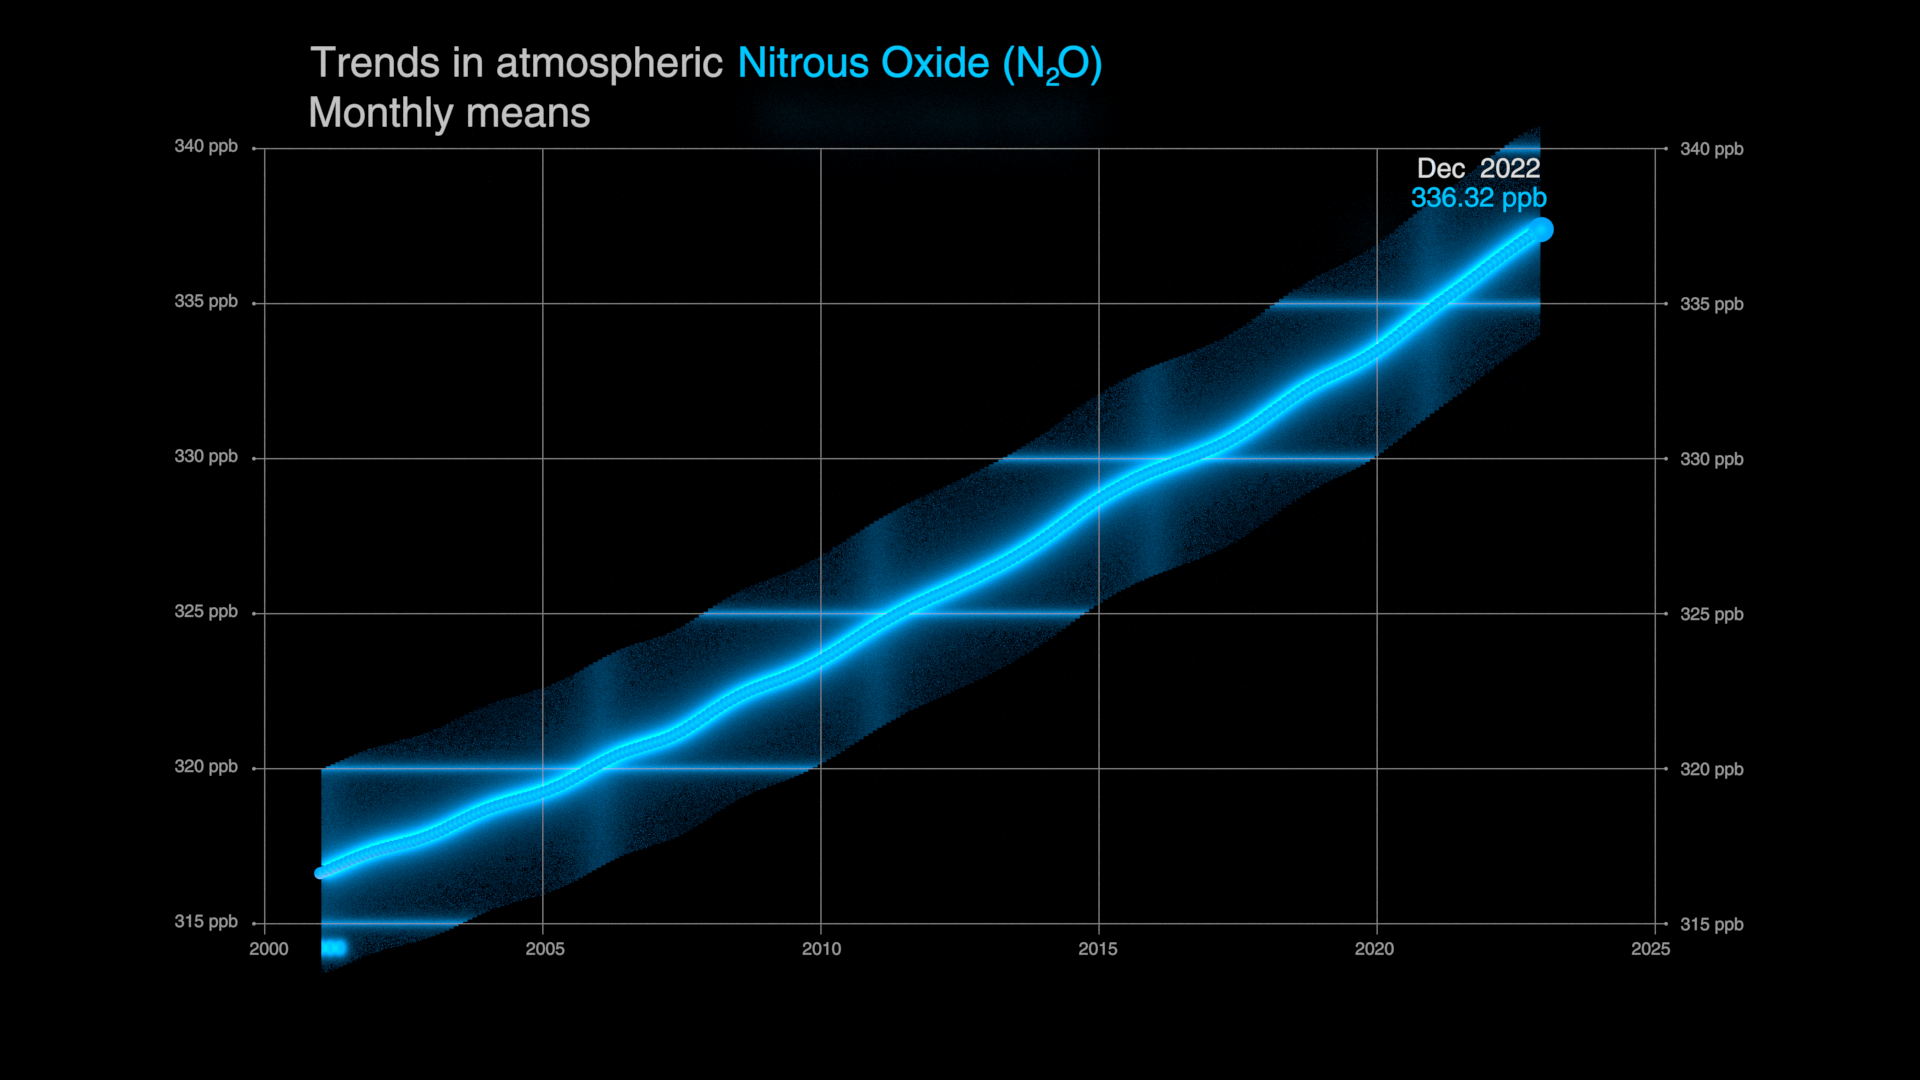
Trends in atmospheric Nitrous Oxide (N₂O)
Go to this pageGlobal trends in atmospheric Nitrous Oxide (N₂O) for the period January 2001-December 2022. || N2OTrends_1920x1080p30.00900_print.jpg (1024x576) [60.7 KB] || N2OTrends_1920x1080p30.00900.png (1920x1080) [685.4 KB] || N2OTrends_1920x1080p30.00900_searchweb.png (320x180) [24.2 KB] || N2OTrends_1920x1080p30.00900_thm.png (80x40) [3.0 KB] || 1920x1080_16x9_30p (1920x1080) [0 Item(s)] || N2O_Trends_1920x1080p30.mp4 (1920x1080) [7.4 MB] || N2OTrends_1920x1080p30.00900.exr (1920x1080) [1.8 MB] ||
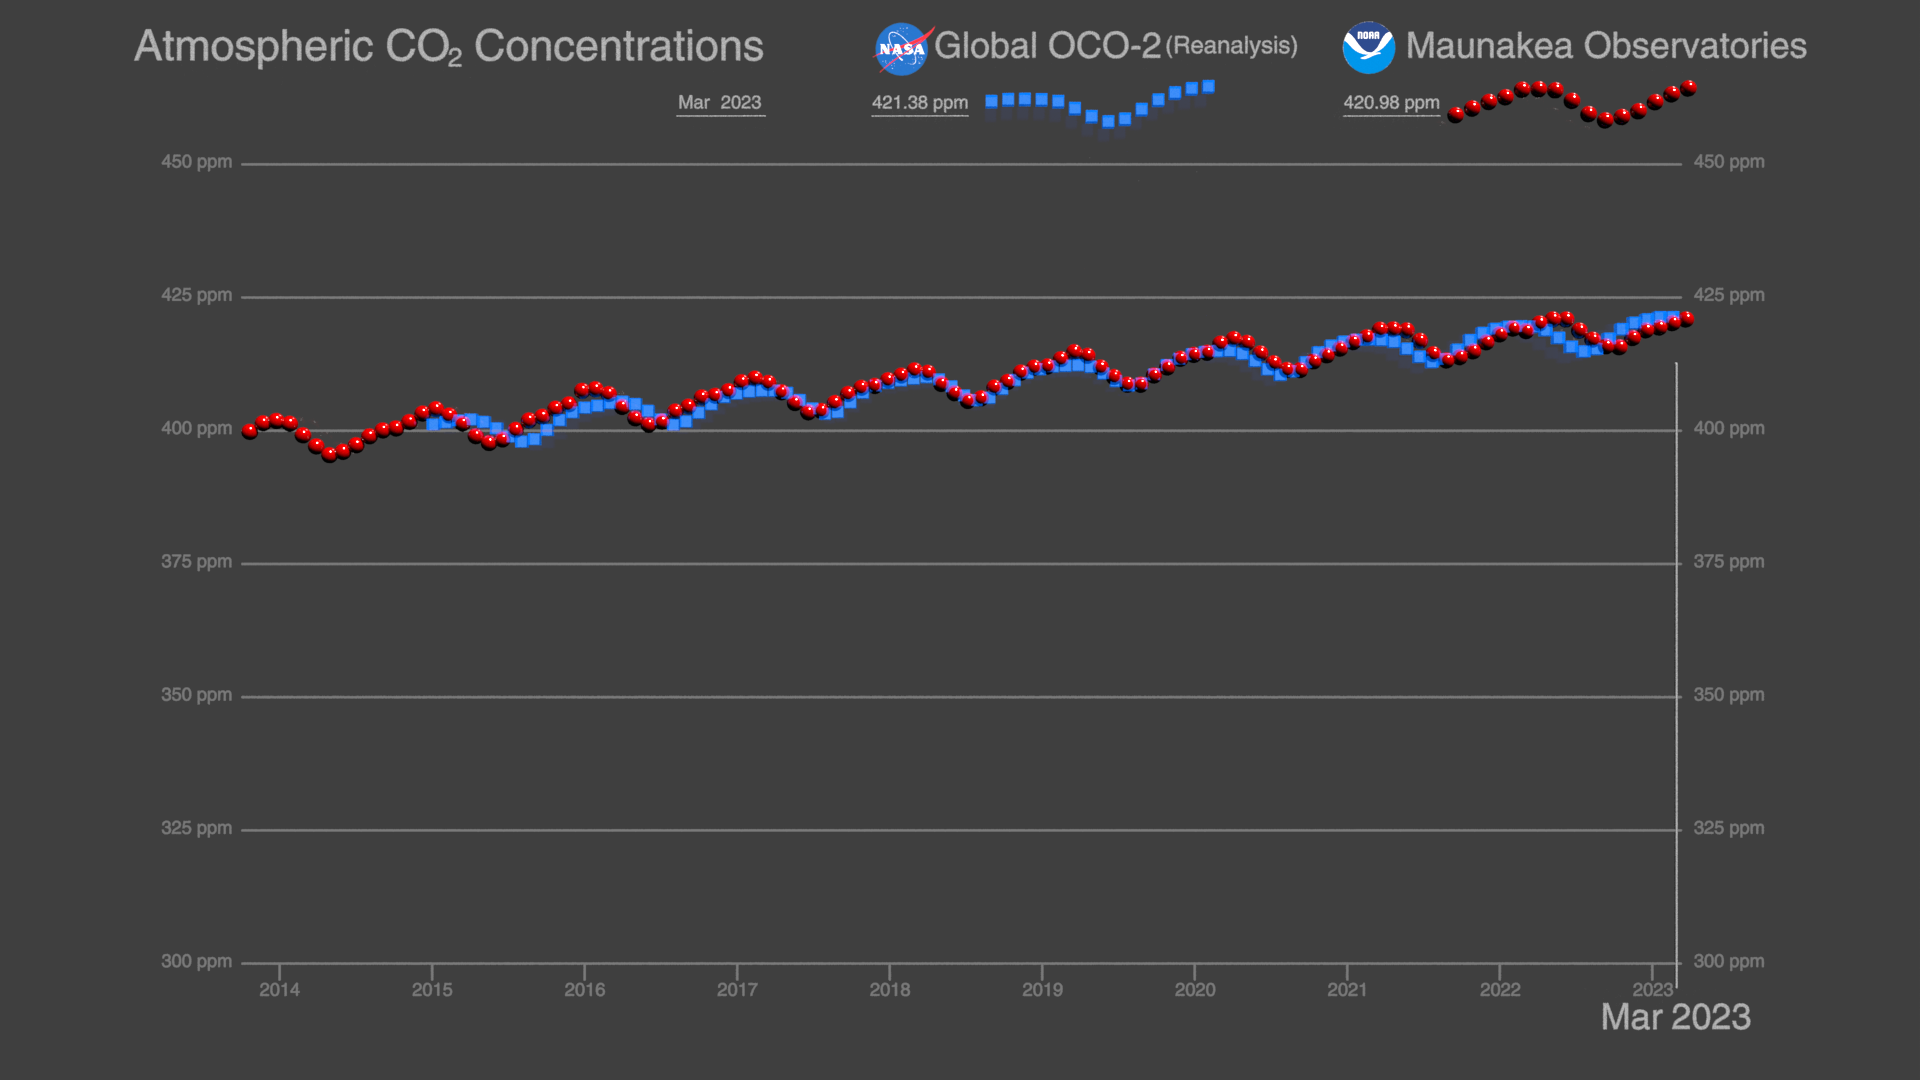
OCO-2 and Keeling Curve: Trends in global atmospheric Carbon Dioxide (CO₂)
Go to this pageOCO-2 and Keeling Curve trends in global atmospheric carbon dioxide. || KeelingCurve_OCO2_1920x1080p30.00370_print.jpg (1024x576) [49.6 KB] || KeelingCurve_OCO2_1920x1080p30.00370.png (1920x1080) [357.7 KB] || KeelingCurve_OCO2_1920x1080p30.00370_searchweb.png (320x180) [16.8 KB] || KeelingCurve_OCO2_1920x1080p30.00370_thm.png (80x40) [2.1 KB] || 1920x1080_16x9_30p (1920x1080) [0 Item(s)] || OCO2_KeelingCurve_1920x1080p30.mp4 (1920x1080) [5.3 MB] || KeelingCurve_OCO2_1920x1080p30.00370.exr (1920x1080) [2.3 MB] || OCO2_KeelingCurve_1920x1080p30.mp4.hwshow [225 bytes] ||
ODIAC: a map of human made carbon dioxide emissions
Go to this pageODIAC (Open-source Data Inventory for Anthropogenic CO2) map for December 2021. || odiac_2023_2160p60.00001_print.jpg (1024x1024) [310.4 KB] || odiac_2023_2160p60.00001_searchweb.png (320x180) [64.3 KB] || odiac_2023_2160p60.00001_thm.png (80x40) [5.2 KB] || 2160x2160_1x1_60p (2160x2160) [0 Item(s)] || odiac_2023_2160p60.mp4 (2160x2160) [126.7 MB] ||
NOAA Annual Greenhouse Gas Index
Go to this pageThis visualization of the NOAA Annual Greenhouse Gas Index shows the relative warming contribution from various greenhouse gasses (1979-2023). The donut chart shows 2023 AGGI data.
