Hyperwall Power Playlist - Earth Science Focus
Overview
This is a collection of our most powerful, newsworthy, and frequently used Hyperwall-ready visualizations, along with several that haven't gotten the attention they deserve. They're especially great for more general or top-level science talks, or to "set the scene" before a deep dive into a more focused subject or dataset. We've tried to cover the subject areas our speakers focus on most.
If you're not seeing what you're looking for, there is a huge library of visualizations more localized or specialized in subject - please use the Search function above, and filter "Result type" for "Hyperwall Visual."
![]() If you'd like to use one of these visualizations in your Hyperwall presentation, we'll need to know which element on which page. On the visualization's web page, below the visual you'd like to use, you'll see a Link icon next to the Download button. All we need is for you to click on that icon and include that link in your presentation Powerpoint/Keynote or visualization list. Additionally, please check our Hyperwall How-To Guide for tips on designing your Hyperwall presentation, file specifications, and Powerpoint/Keynote templates.
If you'd like to use one of these visualizations in your Hyperwall presentation, we'll need to know which element on which page. On the visualization's web page, below the visual you'd like to use, you'll see a Link icon next to the Download button. All we need is for you to click on that icon and include that link in your presentation Powerpoint/Keynote or visualization list. Additionally, please check our Hyperwall How-To Guide for tips on designing your Hyperwall presentation, file specifications, and Powerpoint/Keynote templates.
Science Mission Directorate
Visualizations that cross divisions
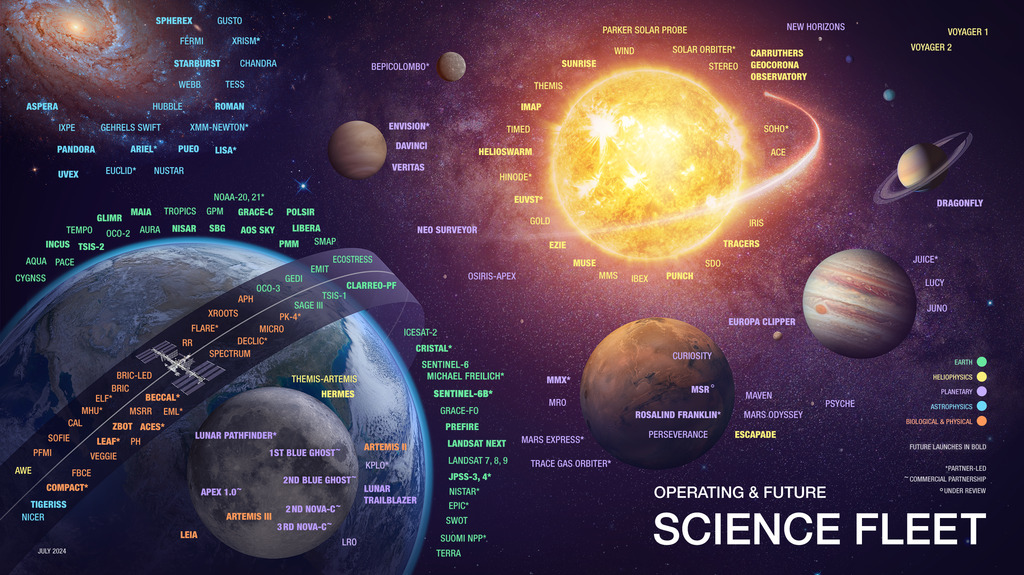
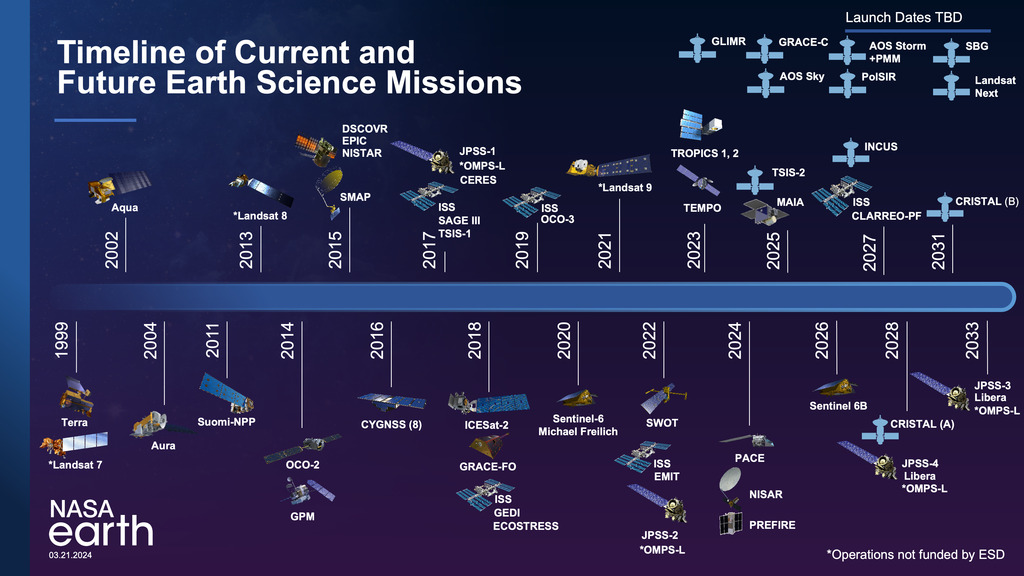
Operating and Future Science fleet
Go to this pageThe current operational and future science fleet. || SMD_MASTER_FLEET_07_29_2024-hw_tweaks_print.jpg (1024x575) [267.6 KB] || SMD_MASTER_FLEET_07_29_2024-hw_tweaks.png (2667x1500) [5.9 MB] || SMD_MASTER_FLEET_07_29_2024-hw_tweaks_searchweb.png (320x180) [191.9 KB] || SMD_MASTER_FLEET_07_29_2024-hw_tweaks_thm.png (80x40) [98.2 KB] || operating-and-future-science-fleet.hwshow ||
Our Solar System
Go to this pageThe 8 planets plus Pluto with planetary axis tilt || planets3x3_pluto_colorMercury_axis_tilt_1080p.00001_print.jpg (1024x576) [75.1 KB] || planets3x3_pluto_colorMercury_axis_tilt_1080p.00001_searchweb.png (320x180) [49.6 KB] || planets3x3_pluto_colorMercury_axis_tilt_1080p.00001_thm.png (80x40) [5.0 KB] || planets3x3_pluto_colorMercury_axis_tilt_720p.00001_web.png (320x180) [50.6 KB] || planets3x3_pluto_colorMercury_axis_tilt_720p.00001_thm.png (80x40) [5.0 KB] || planets3x3_pluto_colorMercury_axis_tilt_1080p.mp4 (1920x1080) [9.2 MB] || planets3x3_pluto_colorMercury_axis_tilt_720p.mp4 (1280x720) [4.7 MB] || planets3x3_pluto_colorMercury_axis_tilt_1080p.webm (1920x1080) [2.7 MB] || planets3x3_pluto_colorMercury_axis_tilt_2160p.mp4 (3840x2160) [28.7 MB] || 3x3_pluto_tilt (4104x2304) [0 Item(s)] || 100-science-overview-001.hwshow ||
Dynamic Earth-A New Beginning
Go to this pageThe visualization 'Excerpt from "Dynamic Earth"' has been one of the most popular visualizations that the Scientific Visualization Studio has ever created. It's often used in presentations and Hyperwall shows to illustrate the connections between the Earth and the Sun, as well as the power of computer simulation in understanding those connections.There is one part of this visualization, however, that has always seemed a little clumsy to us. The opening shot is a pullback from the limb of the sun, where the sun is represented by a movie of 304 Angstrom images from the Solar Dynamics Observatory (SDO). It is difficult to pull back from the limb of a flat sun image and make the sun look spherical, and the problem was made more difficult because the original sun images were in a spherical dome show format. As a result, the pullback from the sun showed some odd reprojection artifacts.The best solution to this issue was to replace the existing pullout with a new one, one which pulled directly out from the center of the solar disk. For the new beginning, we chose a series of SDO images in the 171 Angstrom channel that show a visible coronal mass ejection (CME) in the lower right corner of the solar disk. Although this is not the specific CME that is seen affecting Venus and Earth later in this visualization, its presence links the SDO animation thematically to the later solar storm. The SDO images were also brightened considerably and tinted yellow to match the common perception of the Sun as a bright yellow object (even though it is actually white).Please go to the original version of this visualization to see the complete credits and additional details. ||
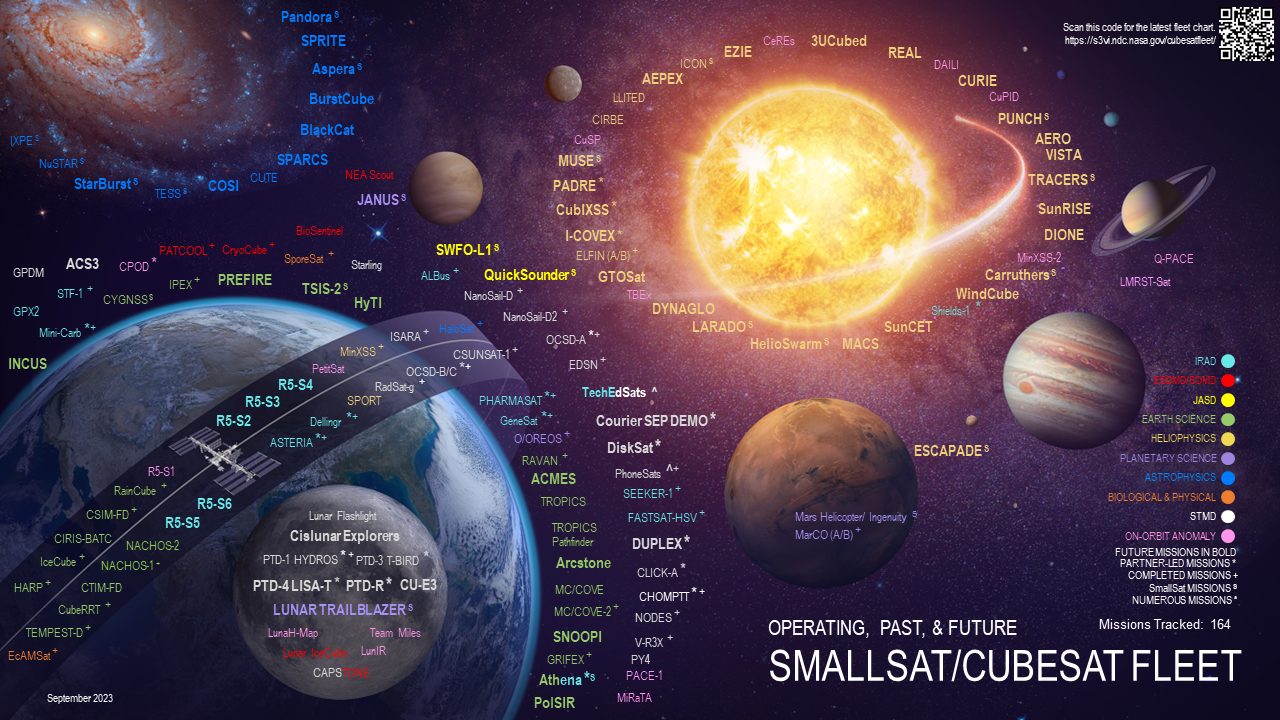
NASA's SmallSat & Cubesat Fleet
Go to this pageNASA's current SmallSat and CubeSat fleet || NASA_SmallSat_Fleet.png (1280x720) [1.9 MB] || NASA_SmallSat_Fleet_print.jpg (1024x576) [246.2 KB] || NASA_SmallSat_Fleet_searchweb.png (320x180) [104.9 KB] || NASA_SmallSat_Fleet_thm.png (80x40) [7.1 KB] || nasas-smallsat-cubesat-fleet.hwshow ||
Satellite Animations
Go to this pageA collection of spacecraft beauty pass animations for current missions.
Launches and Landings on the Hyperwall
Go to this pageLaunches and Landings of missions across all 5 divisions
Full Screen NASA Logo
Go to this sectionIn order to study the Earth as a whole system and understand how it is changing, NASA develops and supports a large number of Earth observing missions. These missions provide Earth science researchers the necessary data to address key questions about global climate change. Missions begin with a study phase during which the key science objectives of the mission are identified, and designs for spacecraft and instruments are analyzed. Following a successful study phase, missions enter a development phase whereby all aspects of the mission are developed and tested to insure it meets the mission objectives. Operating missions are those missions that are currently active and providing science data to researchers. Operating missions may be in their primary operational phase or in an extended operational phase. Missions begin with a study phase during which the key science objectives of the mission are identified, and designs for spacecraft and instruments are analyzed. Following a successful study phase, missions enter a development phase whereby all aspects of the mission are developed and tested to insure it meets the mission objectives.
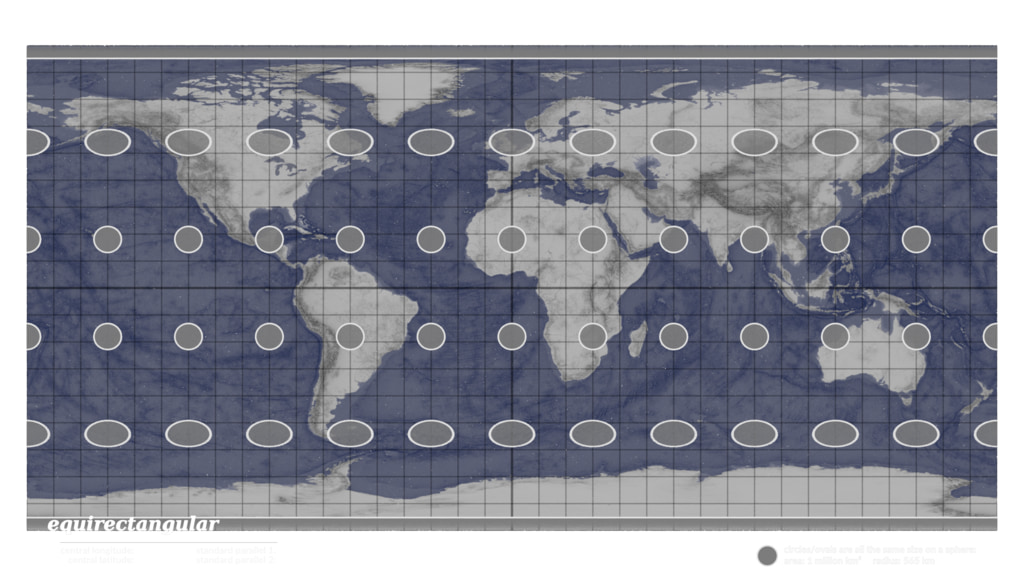
Map Projections Morph
Go to this pageMorphing between various map projections || projection_morph_comp.01000_print.jpg (1024x576) [139.0 KB] || projection_morph_comp.01000_searchweb.png (320x180) [77.1 KB] || projection_morph_comp.01000_thm.png (80x40) [6.6 KB] || comp (3840x2160) [0 Item(s)] || map_layer (3840x2160) [0 Item(s)] || overlay_layer (3840x2160) [0 Item(s)] || projection_morph_comp_2160p59.94_2.webm (3840x2160) [31.7 MB] || projection_morph_comp_2160p59.94_2.mp4 (3840x2160) [175.0 MB] ||
General Earth Science
Covering broad areas of Earth Science
- Hyperwall Visual
- Hyperwall Visual
- Gallery
- Hyperwall Visual
- Hyperwall Visual
- Hyperwall Visual
- Hyperwall Visual
- Hyperwall Visual
- Hyperwall Visual
- Visualization
- Visualization
- Hyperwall Visual
- Hyperwall Visual
- Visualization
- Hyperwall Visual
- Visualization
- Visualization
- Hyperwall Visual
- Hyperwall Visual
- Hyperwall Visual
- Hyperwall Visual
Earth Information Center (EIC)
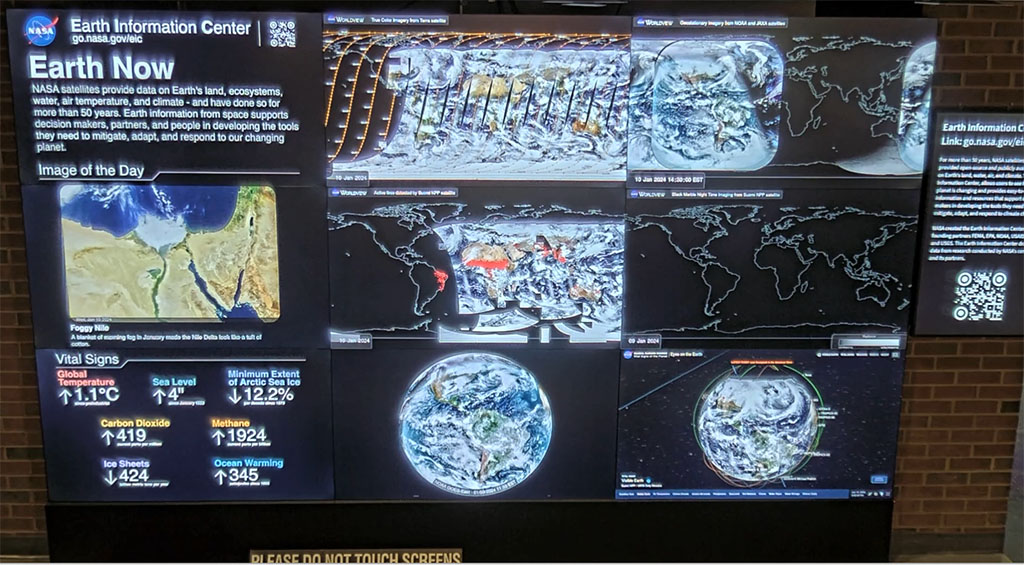
Dashboards from the EIC adapted for the traveling hyperwall. Many incorporate live, regularly updated data, and will require network access in order to be used at an event - please get in touch with us if you'd like to use them at an event; also, a gallery showing the full dashboards at NASA HQ and all the individual elements
- Link
EIC Shows on the Traveling Hyperwall
Dashboards from the EIC, ported over to the traveling hyperwall
Go to this link Earth Information Center (EIC)
Go to this pageFor more than 50 years, NASA satellites have provided data on Earth's land, water, air, temperature, and climate. The Earth Information Center (EIC) allows visitors to see how our planet is changing in nine key areas: sea level change, air quality, biodiversity, wildfires, greenhouse gases, energy, disasters, water resources, and agriculture. This information supports decision makers in developing the tools they need to mitigate, adapt, and respond to our changing planet. Drawing from insight provided by NASA centers from coast to coast, and in close coordination with other government agencies, industry partners and communities, the Earth Information Center delivers critical data directly into the hands of people in ways that they can immediately use. Through the Earth Information Center discover how NASA sees the unseen and consider why this information matters to us all. This gallery consists of content used in the hyperwall display in the Earth Information Center at NASA Headquarters.
From Observations to Models
Visualizations demonstrating how NASA uses actual observed data to build computer models
- Visualization
- Hyperwall Visual
- Visualization
- Hyperwall Visual
- Visualization
- Visualization
- Visualization
- Visualization
- Visualization
- Visualization
- Visualization
- Visualization
- Visualization
- Hyperwall Visual
- Visualization
- Hyperwall Visual
- Hyperwall Visual
- Section
- Section
- Section
- Hyperwall Visual
- Hyperwall Visual
- Section
Greenhouse Gases
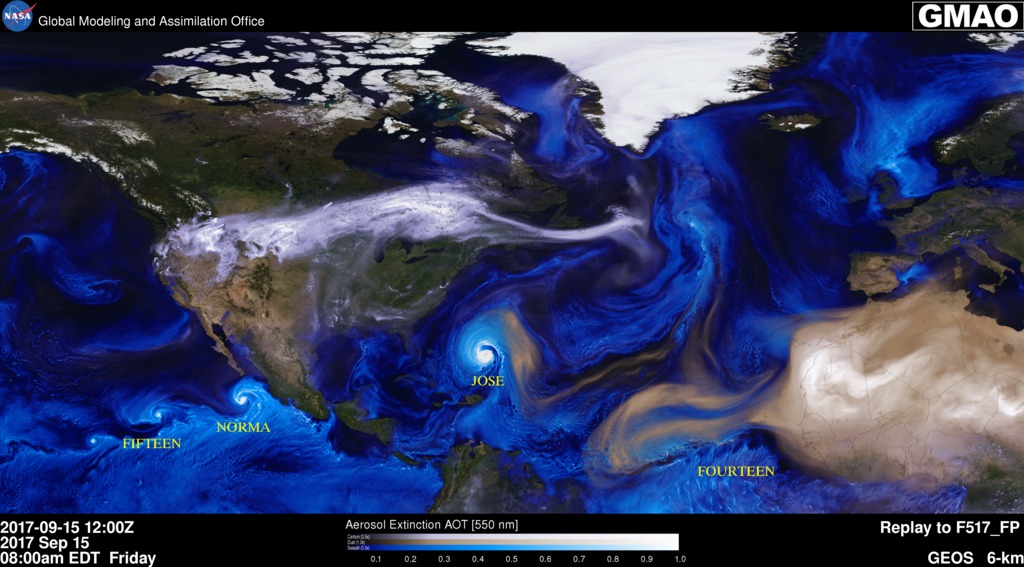
Aerosol visualizations that are related to Climate Change
- Visualization
- Hyperwall Visual
- Visualization
- Visualization
- Hyperwall Visual
- Hyperwall Visual
- Visualization
- Visualization
- Visualization
- Hyperwall Visual
- Visualization
- Visualization
- Visualization
- Visualization
- Visualization
- Visualization
- Hyperwall Visual
- Visualization
- Visualization
Air Quality and Composition
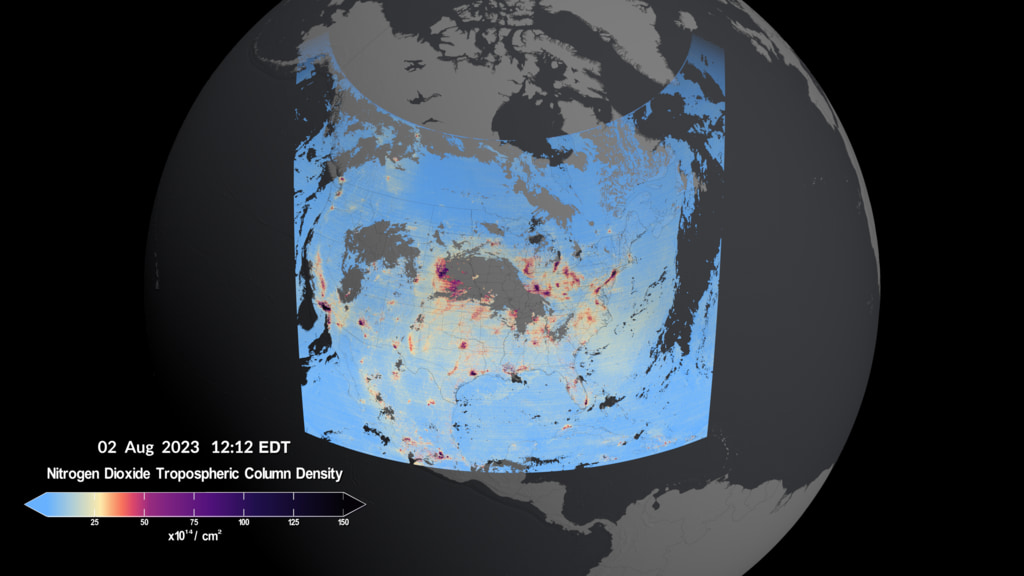
Aerosol visualizations more related to air quality and pollutants
- Hyperwall Visual
- Visualization
- Visualization
- Visualization
- Hyperwall Visual
- Visualization
- Visualization
- Hyperwall Visual
- Visualization
- Visualization
- Hyperwall Visual
Antarctic Ozone Hole
It's getting better...
Antarctic Ozone Hole Maximum, 1979-2024
Go to this pageHere, the globes show ozone data on the day that the minimum ozone concentration was reached over Antarctica, each year from 1979 and 2024. || annual_minimum_ozone_hole_area_yesColorbar_1080pa.00001_print.jpg (1024x576) [115.6 KB] || annual_minimum_ozone_hole_area_yesColorbar_1080pa.00001_searchweb.png (320x180) [54.4 KB] || annual_minimum_ozone_hole_area_yesColorbar_1080pa.00001_thm.png (80x40) [5.0 KB] || annual_minimum_ozone_hole_area_yesColorbar_1080pa.mp4 (1920x1080) [82.2 MB] || annual_minimum_ozone_hole_area_yesColorbar_1080pa.webm (1920x1080) [7.6 MB] || annual_minimum_ozone_hole_area_yesColorbar_4ka.mp4 (3840x2160) [228.9 MB] || antarctic-ozone-hole-maximum-1979-2024-4k-movie.hwshow [361 bytes] || antarctic-ozone-hole-maximum-1979-2024-1080p-movie.hwshow [370 bytes] ||
Ozonewatch 2022
Go to this pagePlots showing the size of the ozone hole between 1979 and 2022. || 2022-ozone-all-elements_print.jpg (1024x576) [89.7 KB] || 2022-ozone-all-elements.png (3840x2160) [1.2 MB] || 2022-ozone-all-elements_searchweb.png (320x180) [37.1 KB] || 2022-ozone-all-elements_thm.png (80x40) [4.3 KB] || 2022-ozone-all-elements.hwshow [77 bytes] ||
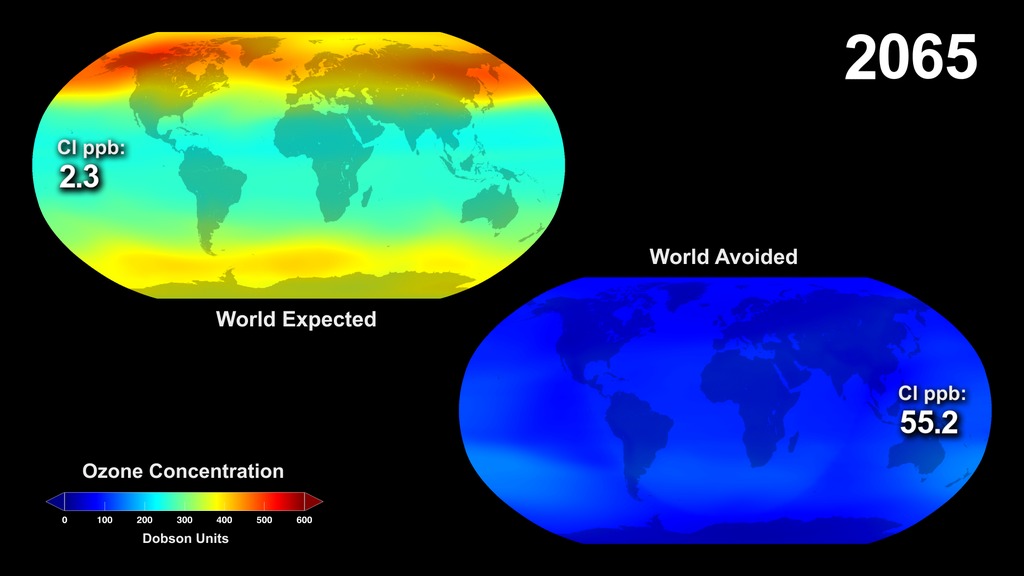
What Would have Happened to the Ozone Layer if Chlorofluorocarbons (CFCs) had not been Regulated? (UPDATED)
Go to this pageWorld Avoided Ozone Full AnimationThis video is also available on our YouTube channel. || world_avoided_robinson.1830_print.jpg (1024x576) [70.0 KB] || world_avoided_robinson.1830_searchweb.png (180x320) [38.8 KB] || world_avoided_robinson.1830_thm.png (80x40) [4.7 KB] || full_movie (1920x1080) [128.0 KB] || world_avoided_robinson_1080.mp4 (1920x1080) [26.3 MB] || world_avoided_robinson_1080.webm (1920x1080) [7.2 MB] || world_avoided_robinson_4272.pptx [27.2 MB] || world_avoided_robinson_4272.key [29.8 MB] || world_avoided_robinson_1080.mp4.hwshow [222 bytes] ||
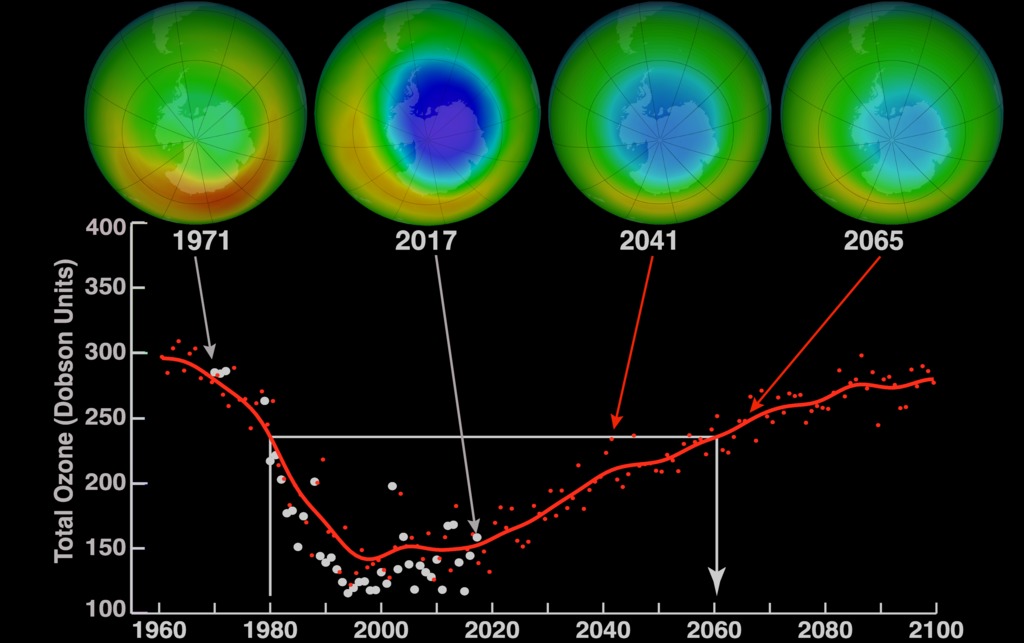
The Antarctic Ozone Hole Will Recover
Go to this pageOctober average minimum ozone over Antarctica || ozone_recovery_update_2017_print.jpg (1024x643) [96.8 KB] || ozone_recovery_update_2017.png (3800x2389) [34.7 MB] || ozone_recovery_update_2017_searchweb.png (320x180) [45.8 KB] || ozone_recovery_update_2017_thm.png (80x40) [4.8 KB] || ozone_hole_recover_30602.key [4.9 MB] || ozone_hole_recover_30602.pptx [2.4 MB] || the-antarctic-ozone-hole-will-recover-in-the-latter-half-of-the-21st-century.hwshow [205 bytes] ||
Total Column Ozone from EP-TOMS and MERRA-2 GMI
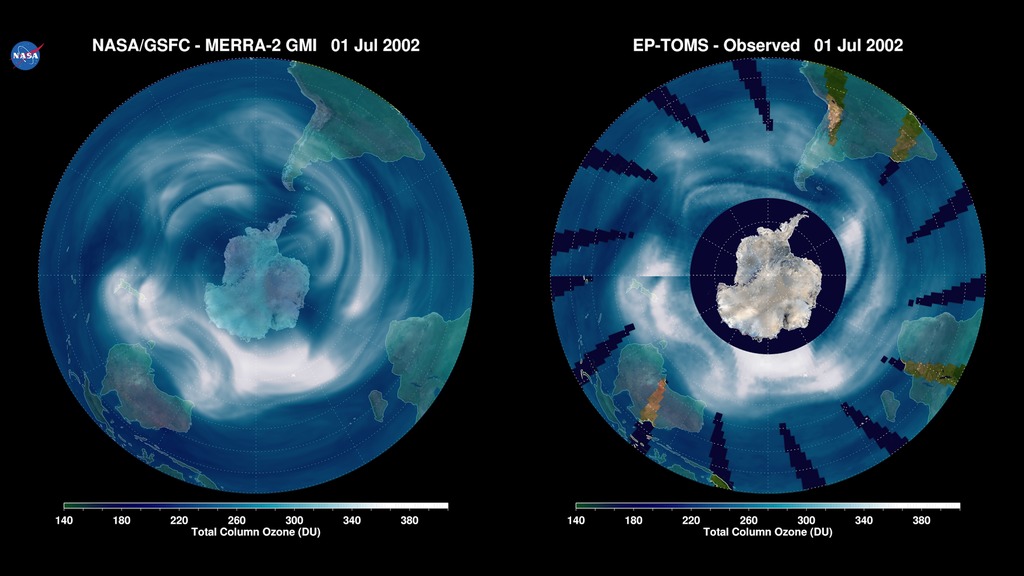
Go to this pageTotal Column Ozone from EP-TOMS and MERRA-2 GMIThe ozone layer is Earth’s protection from harmful ultraviolet radiation. NASA has a long history of measuring total column ozone using a variety of instruments, typically with polar orbiting satellites measuring backscattered solar radiation. This produces near global coverage over the course of a day over the sunlit portion of Earth. Some missing data occurs between swaths, over the polar region during winter, and during satellite outages. This animation shows the evolution of daily composites of total column ozone as observed with Earth Probe Total Ozone Mapping Spectrometer (EP-TOMS), on the right panel, from July 1, 2002 to Oct. 31, 2002. On the left panel is the total column ozone from the MERRA-2 GMI simulation, with hourly time resolution over the same time period. MERRA-2 GMI is a Goddard Earth Observing System version 5 (GEOS-5) “replay” simulation at 0.5° (~50km) horizontal resolution, driven by MERRA-2 reanalyzed winds, temperature, and pressure, coupled to the comprehensive Global Modeling Initiative (GMI) stratosphere-troposphere chemical mechanism. This animation shows the onset of the Antarctic ozone hole formation during austral winter of the dynamically active 2002 season and its breakdown during spring. In September 2002, the Antarctic polar vortex split into 2 lobes following the first and only observed major stratospheric warming in the Southern Hemisphere over our observational record. By combining NASA’s observations and chemistry simulations we have a clearer view of the evolution of Earth’s ozone layer over the recent past. || oman_toz_2002_pngs_1080.00001_print.jpg (1024x576) [117.1 KB] || oman_toz_2002_pngs_1080.00001_searchweb.png (320x180) [61.2 KB] || oman_toz_2002_pngs_1080.00001_web.png (320x180) [61.2 KB] || oman_toz_2002_pngs_1080.00001_thm.png (80x40) [6.0 KB] || oman_toz_2002_pngs_1080.webm (1920x1080) [10.5 MB] || oman_toz_2002_pngs_1080.mp4 (1920x1080) [187.7 MB] ||
Wildfires and Smoke
Tracking the coverage, damage, and carry-on effects
- Visualization
- Visualization
- Hyperwall Visual
- Visualization
- Visualization
- Hyperwall Visual
- Visualization
- Hyperwall Visual
- Visualization
- Produced Video
Weather and Atmospheric Dynamics
Hurricanes, precipitation, and related phenomena such as clouds, lightning, and winds
- Hyperwall Visual
- Visualization
- Visualization
- Visualization
- Visualization
- Hyperwall Visual
- Hyperwall Visual
- Hyperwall Visual
- Visualization
- Visualization
- Visualization
- Hyperwall Visual
- Visualization
- Visualization
- Hyperwall Visual
- Visualization
- Visualization
- Visualization
- Hyperwall Visual
- Visualization
- Visualization
Individual Hurricanes and Typhoons
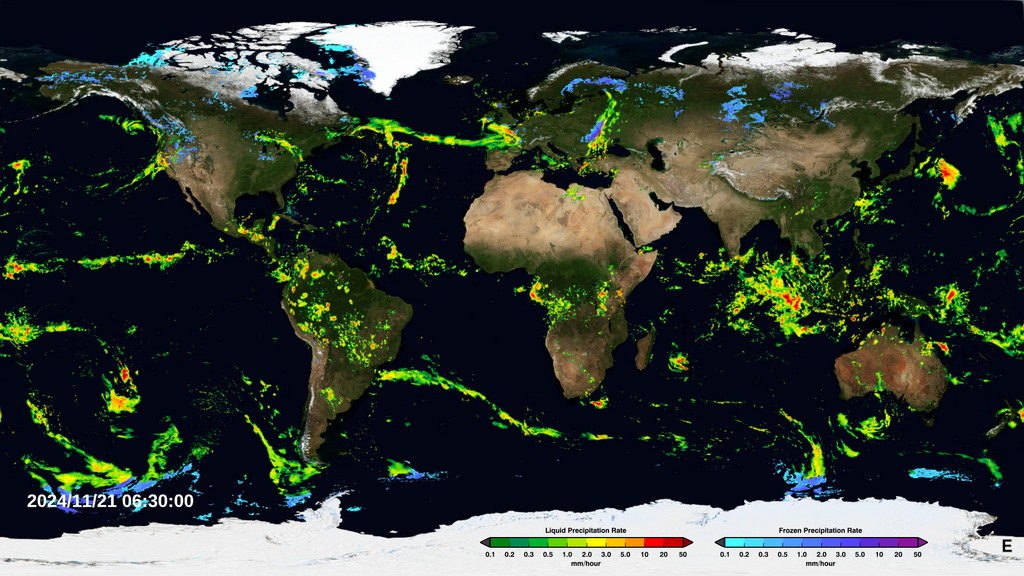
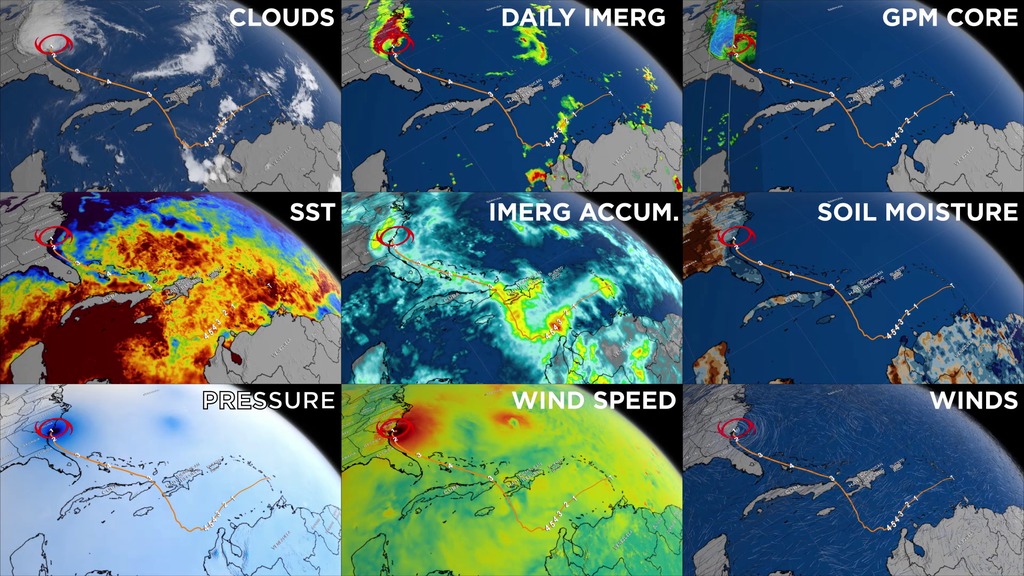
In addition to TROPICS hurricane passes shown here, the Global Precipitation Measurement Gallery (first item) contains the full list of GPM event passes, or use the Search function at top for those not listed below
- Visualization
- Visualization
- Visualization
- Visualization
- Visualization
- Visualization
- Gallery
- Visualization
Other Natural Hazards and Disasters
NASA's work in predicting and tracking various natural hazards and assisting disaster response
- Produced Video
- Visualization
- Hyperwall Visual
- Produced Video
- Visualization
- Hyperwall Visual
- Visualization
- Hyperwall Visual
Biosphere
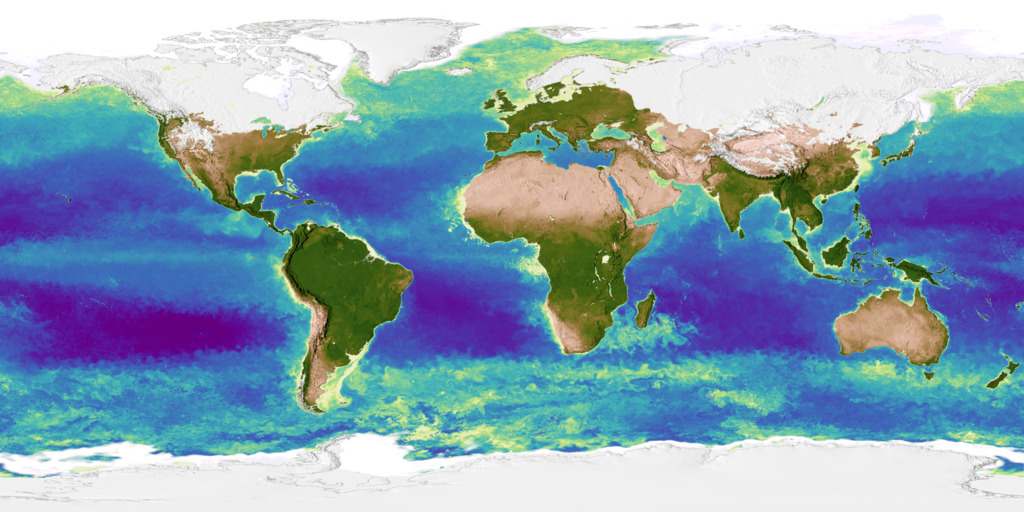
Global and regional measures of ground water and vegetation both land and sea
- Visualization
- Hyperwall Visual
- Visualization
- Hyperwall Visual
- Visualization
- Visualization
- Hyperwall Visual
- Visualization
- Visualization
- Visualization
- Visualization
- Produced Video
- Produced Video
- Visualization
Agriculture and Groundwater
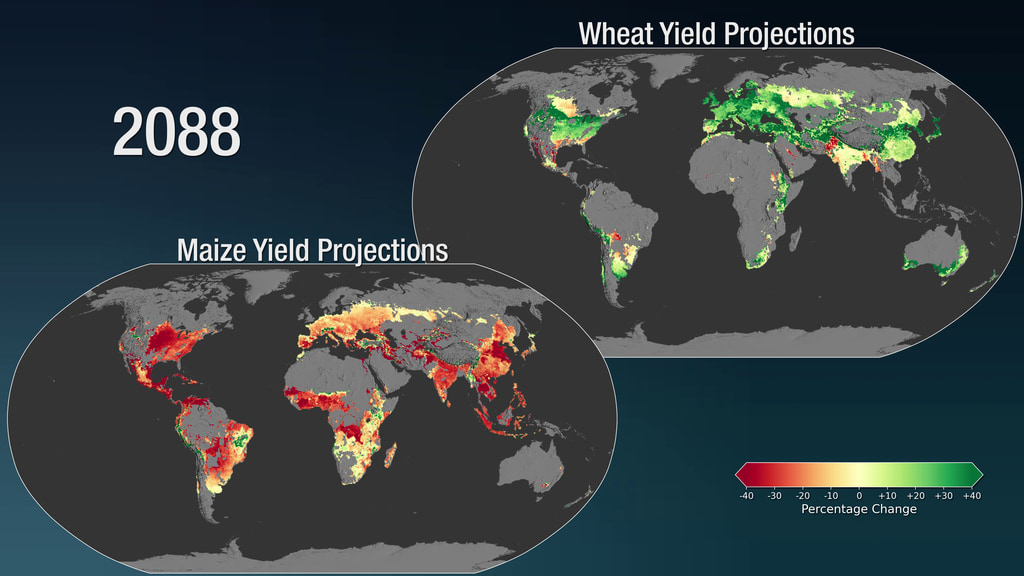
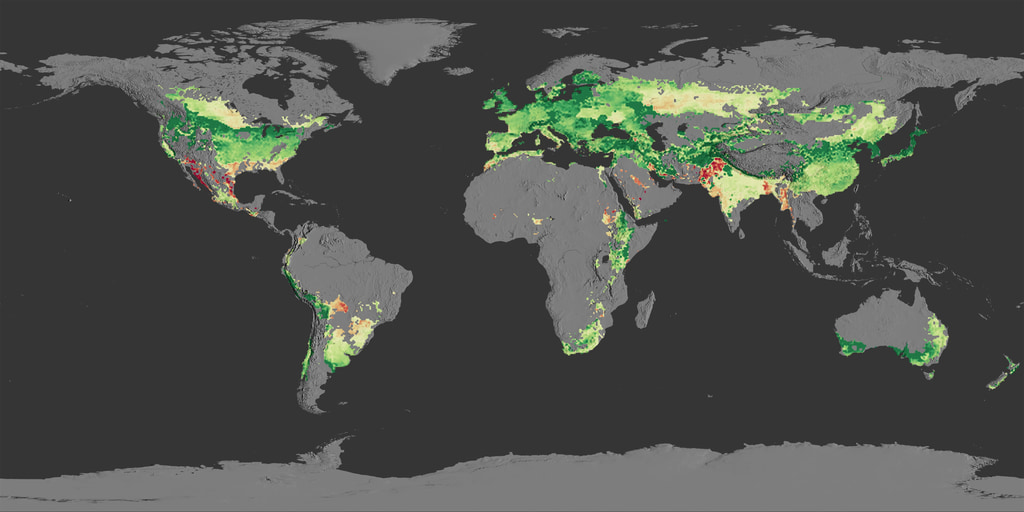
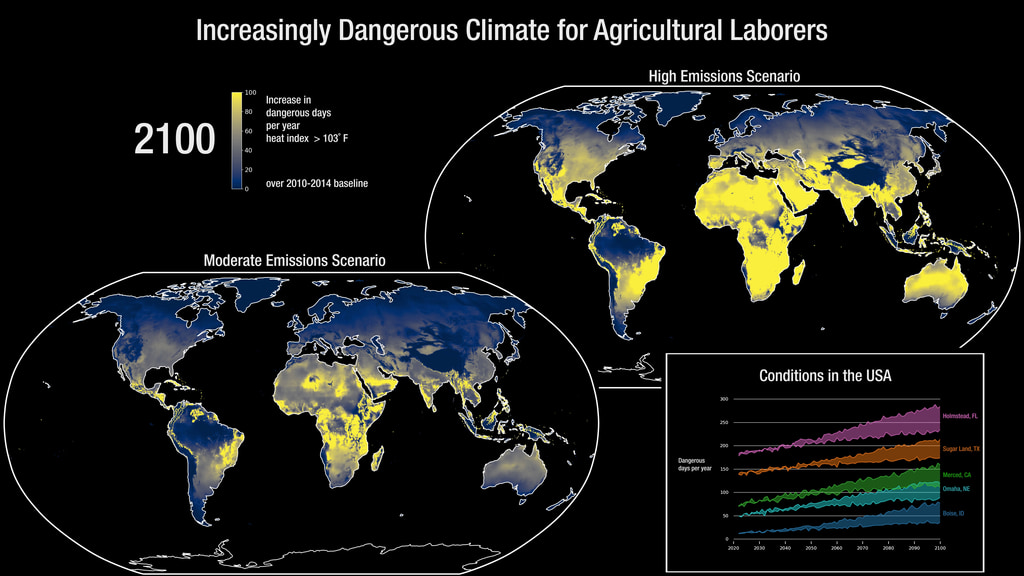
The effects of climate change on agriculture
- Produced Video
- Produced Video
- Visualization
- Hyperwall Visual
- Produced Video
- Produced Video
- Hyperwall Visual
- Visualization
- Visualization
- Visualization
- Visualization
- Hyperwall Visual
- Hyperwall Visual
- Visualization
- Hyperwall Visual
- Hyperwall Visual
- Hyperwall Visual
- Visualization
- Visualization
- Section
Environment and Disease
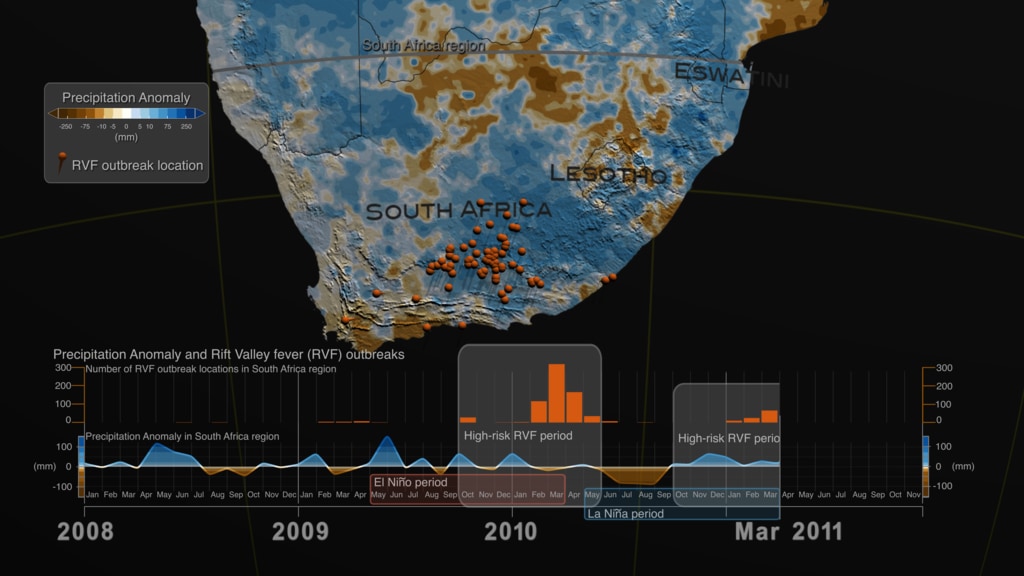
Measures of environmental-related disease vectors
- Hyperwall Visual
Climate Variability and Change Indicators
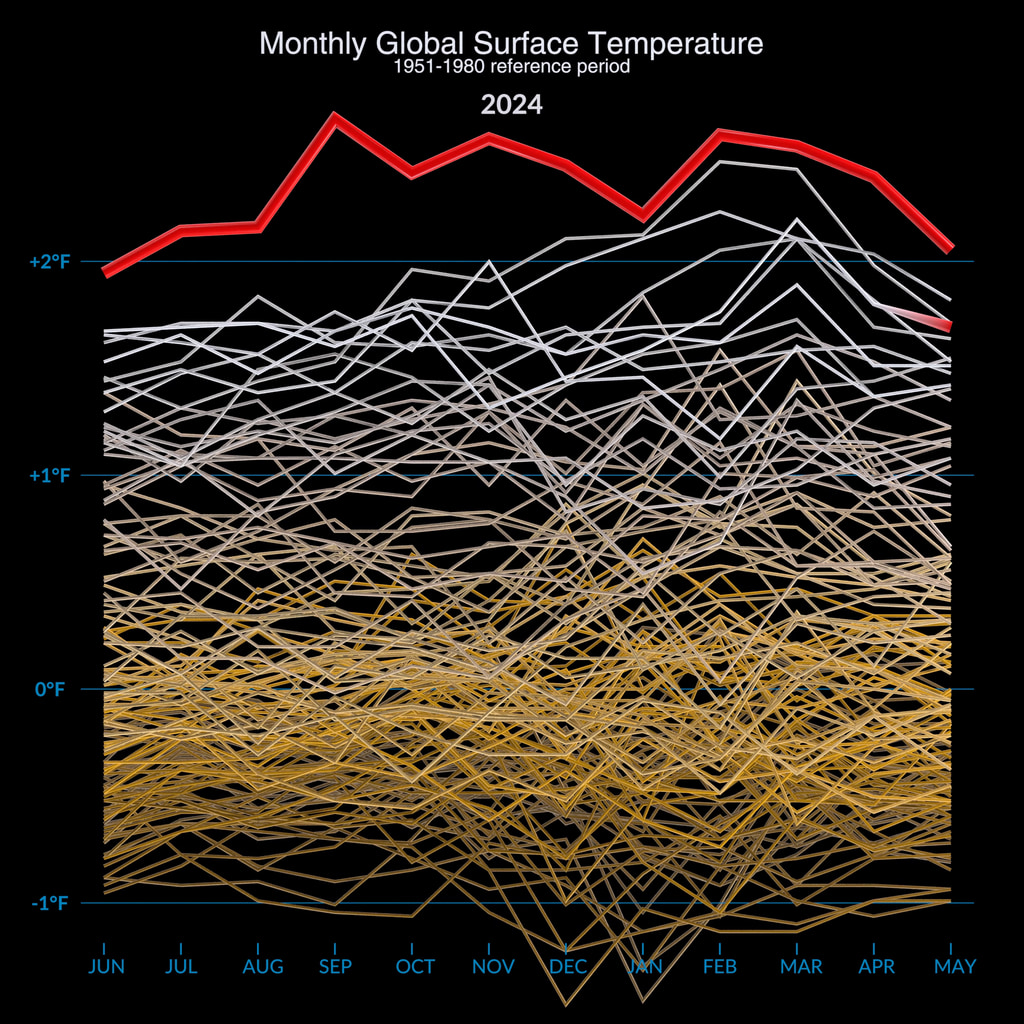
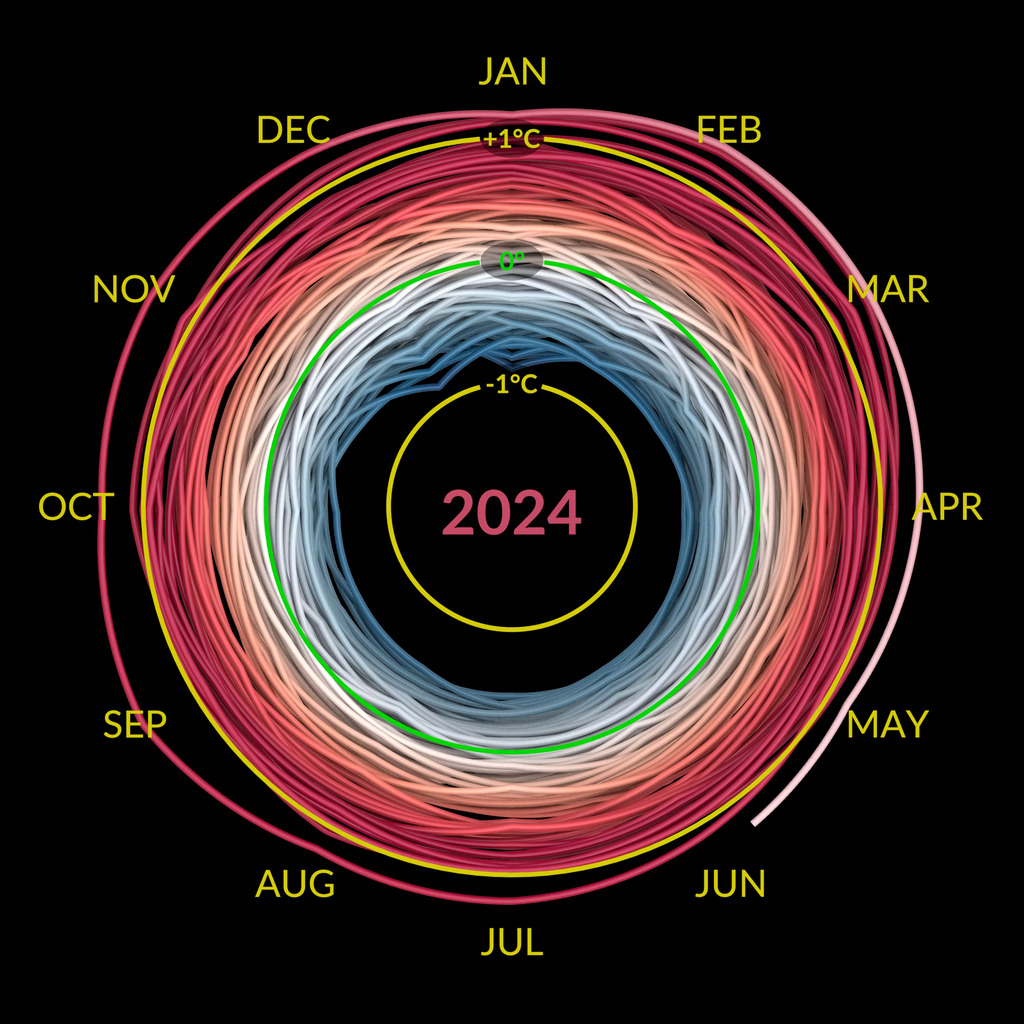
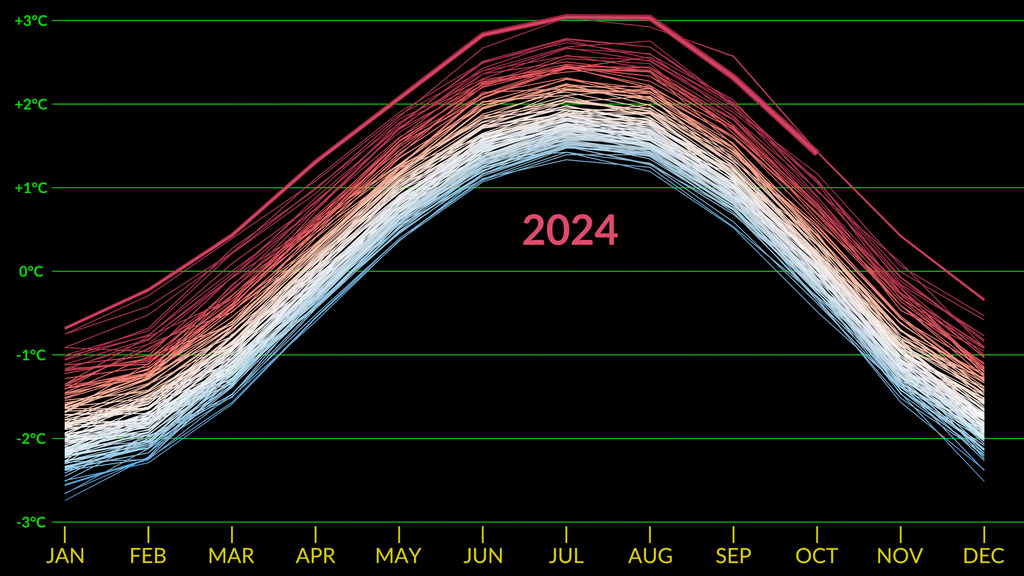
Measures of the changing climate from global temperatures to sea level rise and beyond
- Visualization
- Visualization
- Visualization
- Visualization
- Visualization
- Visualization
- Visualization
- Visualization
- Visualization
- Visualization
- Hyperwall Visual
- Visualization
- Visualization
- Visualization
- Visualization
- Hyperwall Visual
- Hyperwall Visual
- Animation
- Visualization
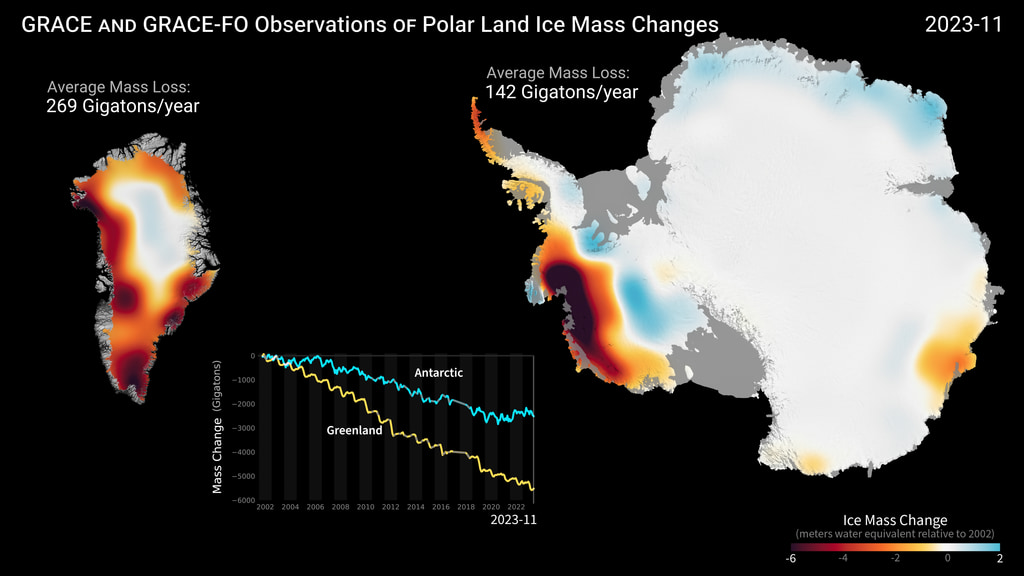
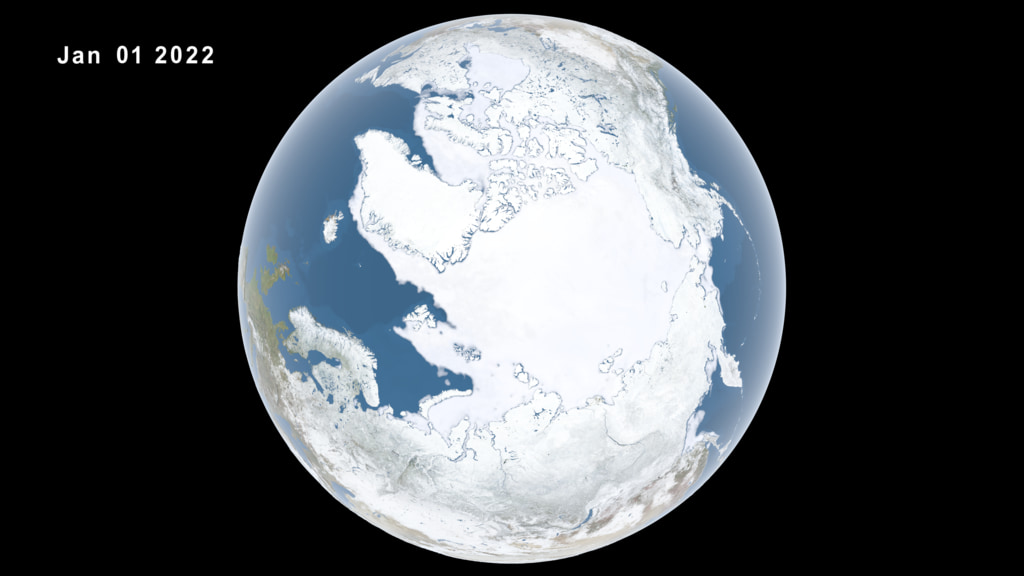
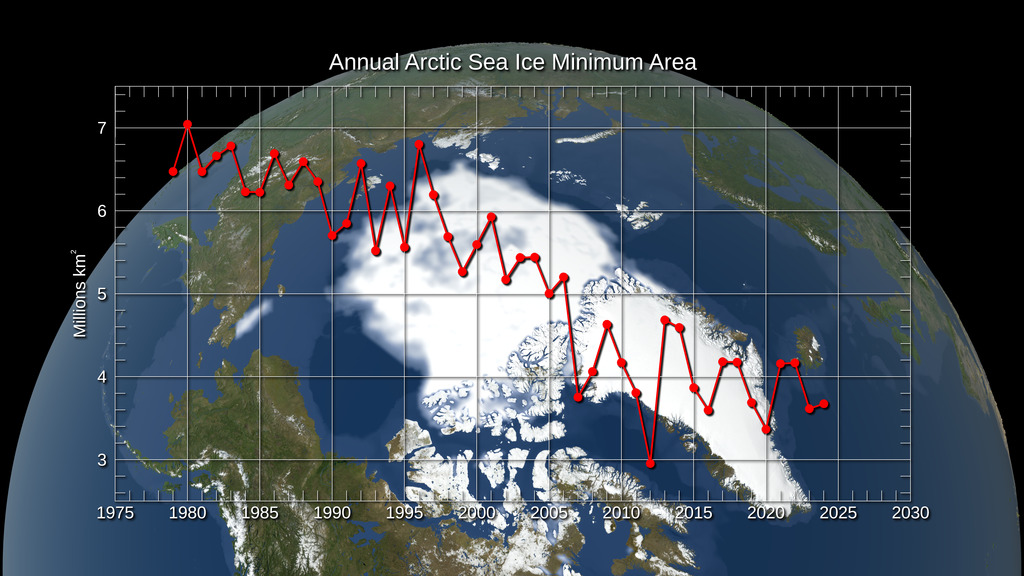
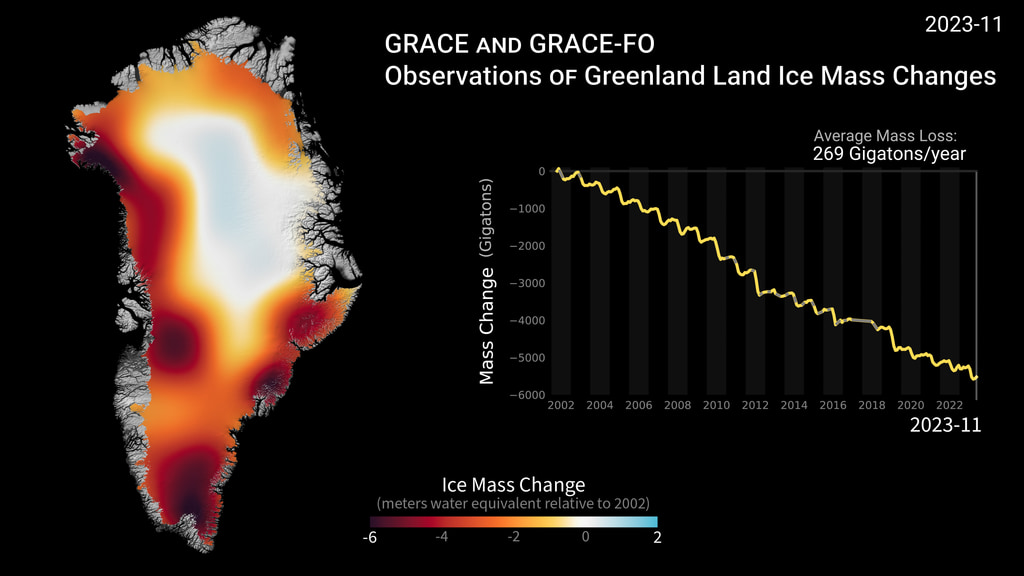
Ice
The Arctic, Greenland, and Antarctica
- Visualization
- Visualization
- Visualization
- Hyperwall Visual
- Visualization
- Visualization
- Visualization
- Hyperwall Visual
- Visualization
- Visualization
- Visualization
- Hyperwall Visual
- Visualization
- Section
- Visualization
- Visualization
- Visualization
- Visualization
- Produced Video
- Visualization
- Visualization
Oceans and Sea Level Rise
Tracking changes in the oceans and sea level
- Visualization
- Visualization
- Visualization
- Visualization
- Visualization
- Visualization
- Visualization
- Hyperwall Visual
- Visualization
- Hyperwall Visual
- Visualization
- Visualization
- Visualization
- Hyperwall Visual
- Visualization
- Visualization
Earth's Changing Surface Over Time & Landsat
Small areas showing big changes over the years as observed by many of NASA's satellites and instruments, including Landsat, Terra/MODIS, and SNPP/VIIRS
- Produced Video
- Hyperwall Visual
- Hyperwall Visual
- Hyperwall Visual
- Hyperwall Visual
- Hyperwall Visual
- Hyperwall Visual
- Hyperwall Visual
- Visualization
- Visualization
- Hyperwall Visual
- Visualization
- Produced Video
- Hyperwall Visual
International Space Station
Measurements from instruments on the ISS along with astronaut photography
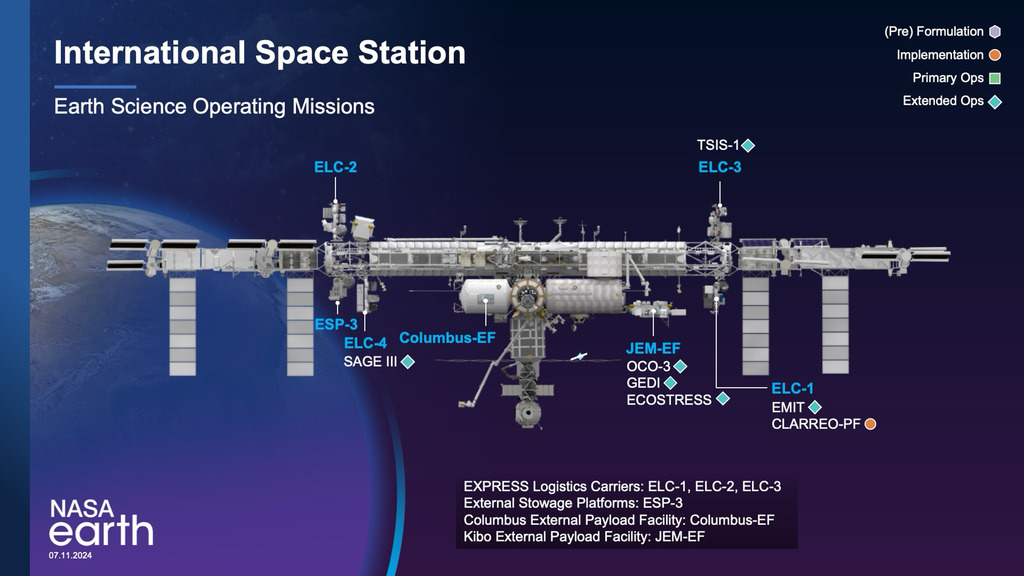
NASA Science Facilities on the International Space Station
Go to this pageThe International Space Station offers a unique vantage point for observing the Earth's ecosystems with hands-on and automated equipment. These options enable astronauts to observe and explain what they witness in real time. Station crews can observe and collect camera images of events as they unfold and may also provide input to ground personnel programming the station's automated Earth-sensing systems. This flexibility is an advantage over sensors on unmanned spacecraft, especially when unexpected natural events such as volcanic eruptions and earthquakes occur.A wide variety of Earth-observation payloads can be attached to the exposed facilities on the station's exterior; already, several instruments have been proposed by researchers from the partner countries. The station contributes to humanity by collecting data on the global climate, environmental change and natural hazards using its unique complement of crew-operated and automated Earth-observation payloads. ||
4K Video from the ISS, April 2016
Go to this pageISS crew Earth observations, || earth_obs_00720_print.jpg (1024x576) [164.4 KB] || earth_obs_00720.png (3840x2160) [31.7 MB] || earth_obs_00720_searchweb.png (320x180) [85.1 KB] || earth_obs_00720_thm.png (80x40) [6.3 KB] || ISS_Crew_Earth_Observations_720p.mp4 (1280x720) [19.7 MB] || ISS_Crew_Earth_Observations_720p.webm (1280x720) [7.5 MB] || ISS_Crew_Earth_Observations_2160p.mp4 (3840x2160) [80.1 MB] ||
Ultra-High-Definition Video from the International Space Station
Go to this pageFootage from a 4k video camera on ISS || iss_red_camera_2015.png (3840x1920) [5.4 MB] || iss_red_camera_2015_print.jpg (1024x512) [94.4 KB] || iss_red_camera_2015_searchweb.png (180x320) [65.2 KB] || iss_red_camera_2015_thm.png (80x40) [4.9 KB] || iss_red_camera_2015_720p.mp4 (1280x720) [25.7 MB] || iss_red_camera_2015_1080p.mp4 (1920x1080) [51.5 MB] || iss_red_camera_2015_720p.webm (1280x720) [14.3 MB] || UDH_ISS_30623.key [29.1 MB] || UDH_ISS_30623.pptx [26.6 MB] || iss_red_camera_2015_3840x1920.mp4 (3840x1920) [145.3 MB] ||
ISS Timelapse: Aurora Australis
Go to this pageThe photographs used to make this video were taken on September 17, 2011 from 17:22:27 to 17:37:21 GMT from the International Space Station (ISS). This image sequence begins over the Indian Ocean halfway between Madagascar and Antarctica. Aurora Australis is present for the first 2/3rds of the video, then Australis comes into view. Yellow lights near the coast show the presence of cities, while interior oragne lights indicate brush fires.http://eol.jsc.nasa.gov ||
Three years of SAGE III/ISS Stratospheric Aerosol Data
Go to this pageAbout three years of stratospheric aerosol data from SAGE III visualizing a zonal mean and measurements of various high aerosol events across the globe || sage3_final_full_60fps.7300_print.jpg (1024x576) [98.9 KB] || sage3_final_full_60fps.7300_searchweb.png (320x180) [57.4 KB] || sage3_final_full_60fps.7300_thm.png (80x40) [4.4 KB] || sage3_final_full_1080p59.94.webm (1920x1080) [25.5 MB] || orig (3840x2160) [1.0 MB] || sage3_final_full_1080p59.94.mp4 (1920x1080) [234.0 MB] || sage3_final_full_2160p59.94.mp4 (3840x2160) [1.0 GB] ||
EMIT Spots Methane Hotspots
Go to this pageA plume of methane is detected flowing from an area southeast of Carlsbad, New Mexico. || PIA25592_new_mexico_methane.png (1547x805) [1.8 MB] || PIA25592_new_mexico_methane_print.jpg (1024x532) [183.9 KB] || PIA25592_new_mexico_methane_searchweb.png (320x180) [109.3 KB] || PIA25592_new_mexico_methane_thm.png (80x40) [6.9 KB] || PIA25592_new_mexico_methane.hwshow [222 bytes] ||
Earth Surface Mineral Dust Source Investigation (EMIT) for hyperwall
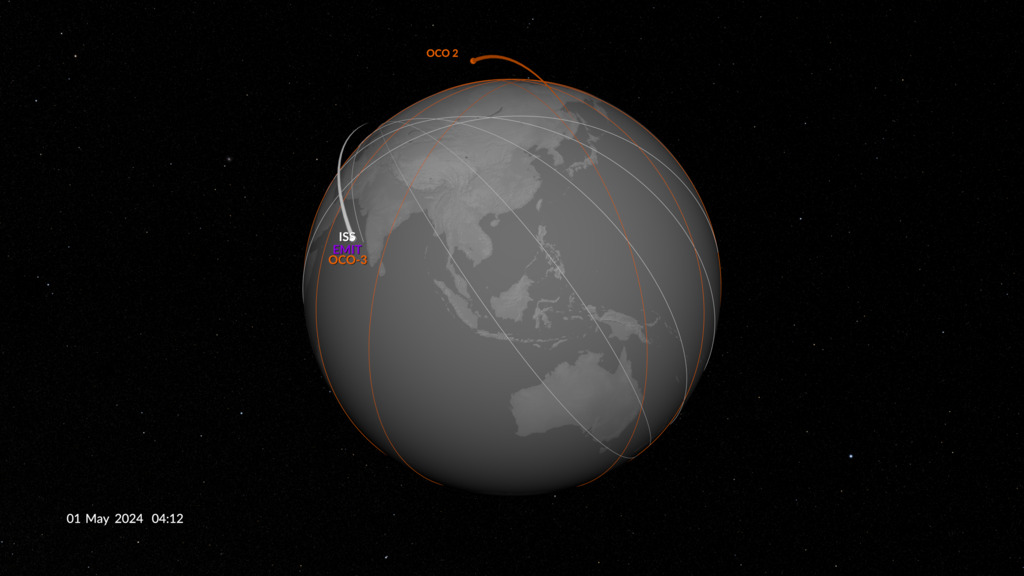
Go to this pageAnimation showing location of EMIT on the ISS || emit_on_iss_print.jpg (1024x576) [93.5 KB] || emit_on_iss.png (3840x2160) [3.2 MB] || emit_on_iss_searchweb.png (320x180) [67.7 KB] || emit_on_iss_thm.png (80x40) [6.1 KB] || emit_on_iss_1080p60.mp4 (1920x1080) [10.8 MB] || emit_on_iss_1080p60.webm (1920x1080) [3.0 MB] || emit_on_iss_2160p60.mp4 (3840x2160) [28.3 MB] || emit_on_iss.hwshow [198 bytes] || Images and videos prepared for hyperwall for EMIT. ||
GEDI Media Resources
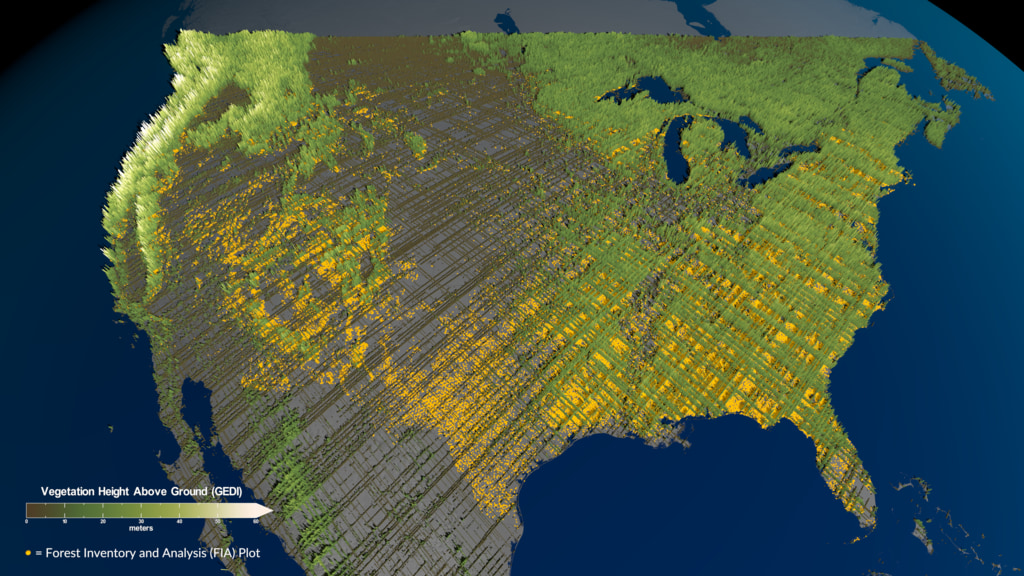
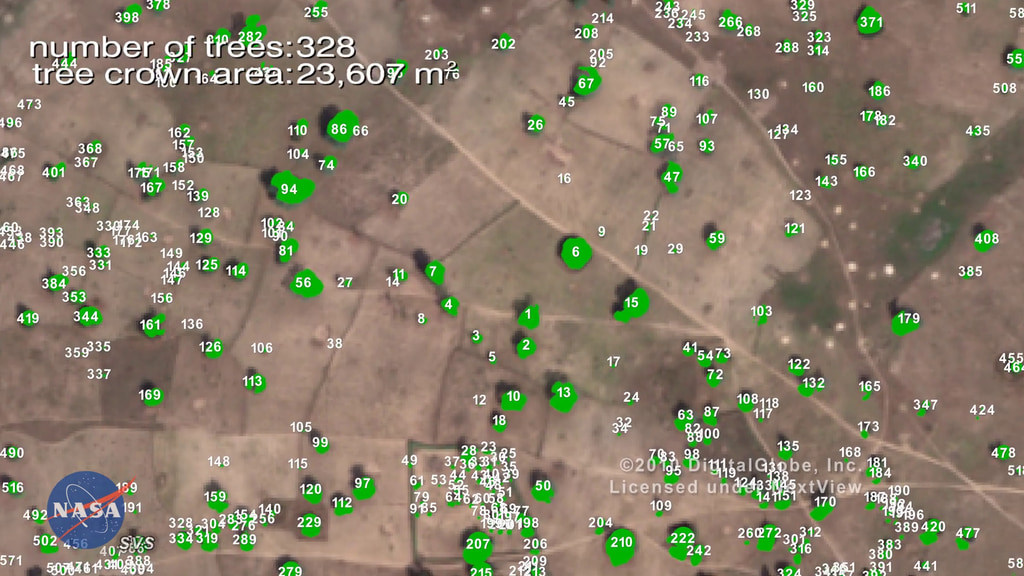
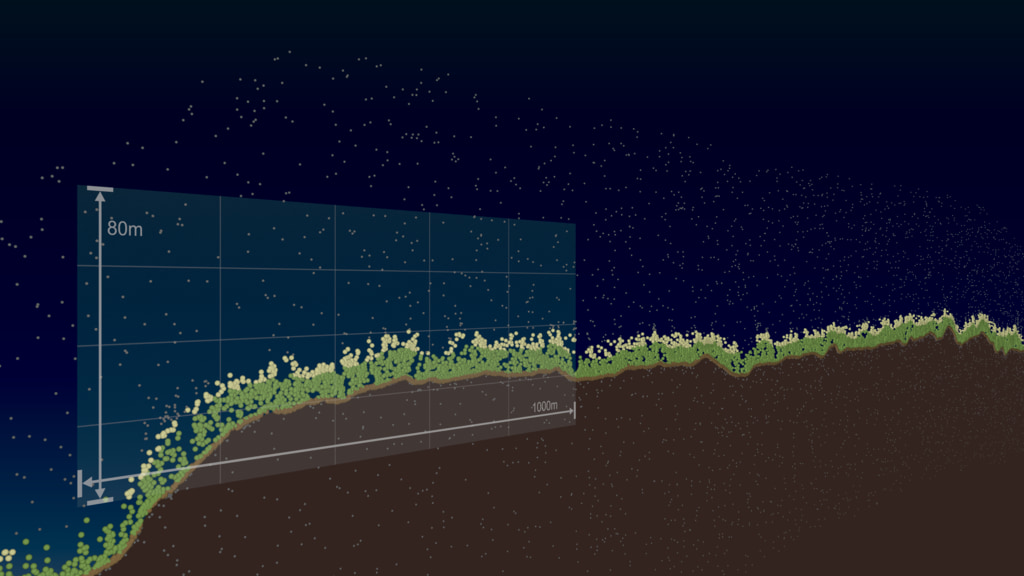
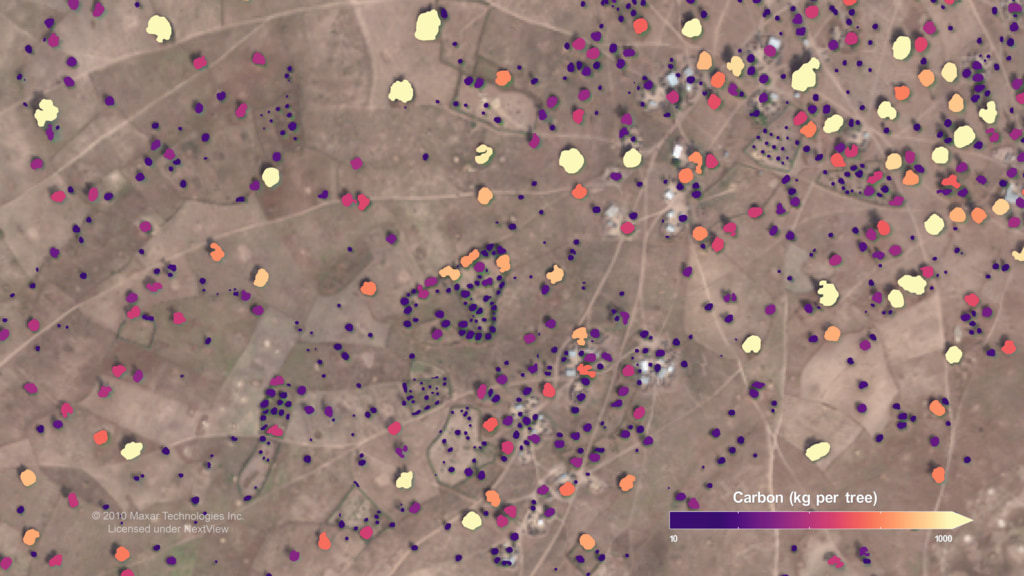
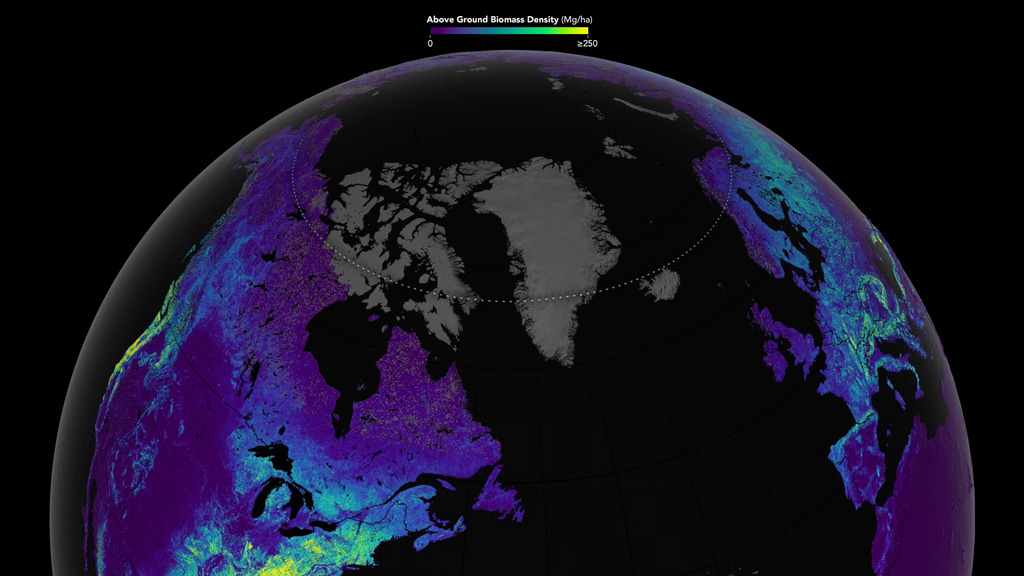
Go to this pageThe Global Ecosystem Dynamics Investigation (GEDI) uses laser pulses to give a view of the 3D structure of the Earth. GEDI’s precise measurements of the height and vertical structure of forest canopy, along with the surface elevation, will greatly advance our ability to characterize important carbon and water cycling processes, biodiversity, and habitat. The mission is led by the University of Maryland, College Park, and the instrument was built and tested at NASA's Goddard Space Flight Center.GEDI observes nearly all tropical and temperate forests using a self-contained laser altimeter on the International Space Station. GEDI has the highest resolution and densest sampling of any lidar ever put in orbit. This has required a number of innovative technologies to be developed at NASA Goddard.GEDI has three lasers that produce 8 parallel tracks of observations. Each laser fires 242 times per second and illuminates a 25-meter footprint on the surface over which 3D structure is measured. Each footprint is separated by 60 meters along the track, with an across-track distance of about 600 m between each of the 8 tracks. GEDI is expected to produce about 10 billion cloud-free observations during its nominal 24-month mission length.With these observations, GEDI will provide answers to how deforestation has contributed to atmospheric CO2 concentrations, how much carbon forests will absorb in the future, and how habitat degradation will affect global biodiversity. This data is of immense value for forest and water resource management, carbon cycle science, and weather prediction.For more information about GEDI: https://gedi.umd.edu ||
ECOSTRESS observes Summer 2023 heatwaves
Go to this pageECOSTRESS image of Houston, Texas heatwave || ecostress_00109_Houston_13Jun2023_print.jpg (1024x724) [400.0 KB] || ecostress_00109_Houston_13Jun2023.png (3507x2480) [7.2 MB] || ecostress_00109_Houston_13Jun2023_searchweb.png (320x180) [129.1 KB] || ecostress_00109_Houston_13Jun2023_thm.png (80x40) [8.4 KB] || ecostress_00109_Houston_13Jun2023.hwshow [115 bytes] ||
Lightning Events Detected from the International Space Station (ISS) 2017-2023
Go to this pageLightning events detected by the LIS sensor on the ISS between January 2017 and July 2023 using a 10-day roving window. Data is from the quality controlled science dataset. Available resolution in the download menu are 1920x1080, 3840x2160 (4k), and 7680x2160 (created for EIC display). || iss_lightning_preview.jpg (1024x576) [260.7 KB] || iss_lightning_preview_searchweb.png (320x180) [59.3 KB] || iss_lightning_preview_thm.png (80x40) [4.9 KB] || iss_lightning_sphere_07312023.mp4 (1920x1080) [127.0 MB] || iss_lightning_sphere_07312023_60p4k.mp4 (3840x2160) [414.2 MB] || iss_lightning_eic_display_2160p30_h2652.mp4 (7680x2160) [579.9 MB] || iss_lightning_sphere_07312023.mp4.hwshow ||
Airborne and Balloon Program
NASA's airborne fleet and experiments
- Hyperwall Visual
- Hyperwall Visual
- Hyperwall Visual
- Hyperwall Visual
- Produced Video
- Produced Video
- Produced Video
- Produced Video
- Produced Video
- Produced Video






















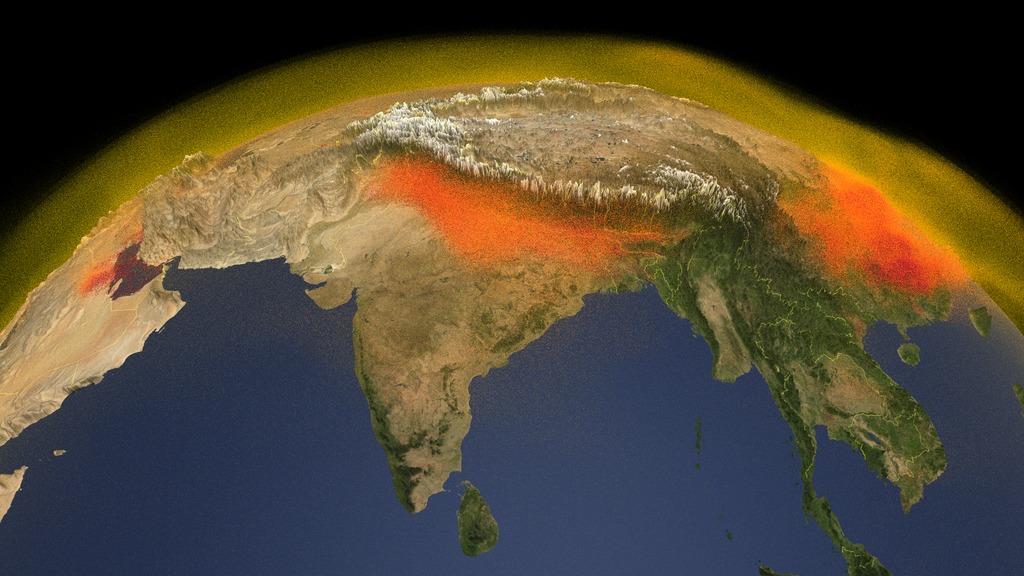


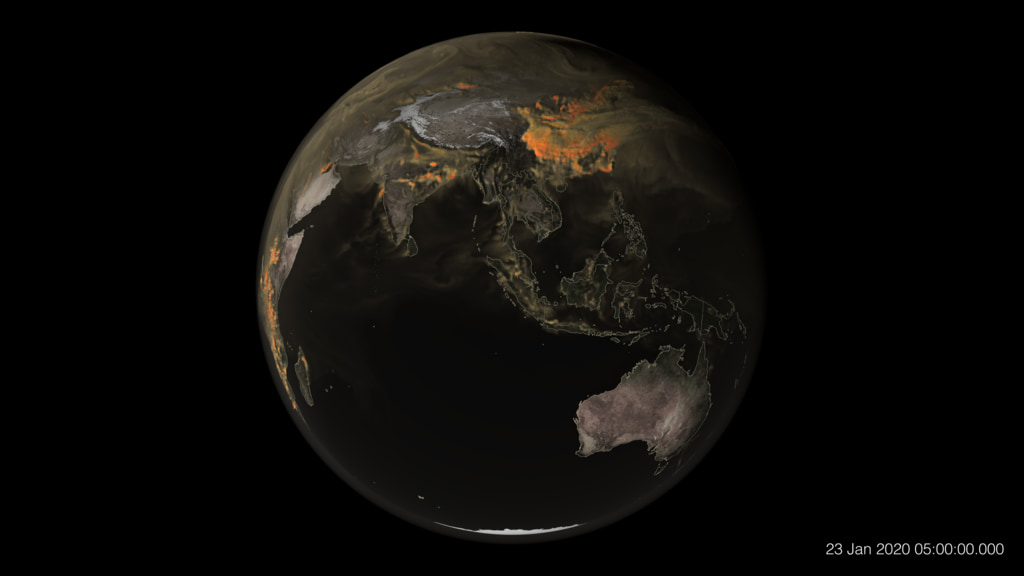
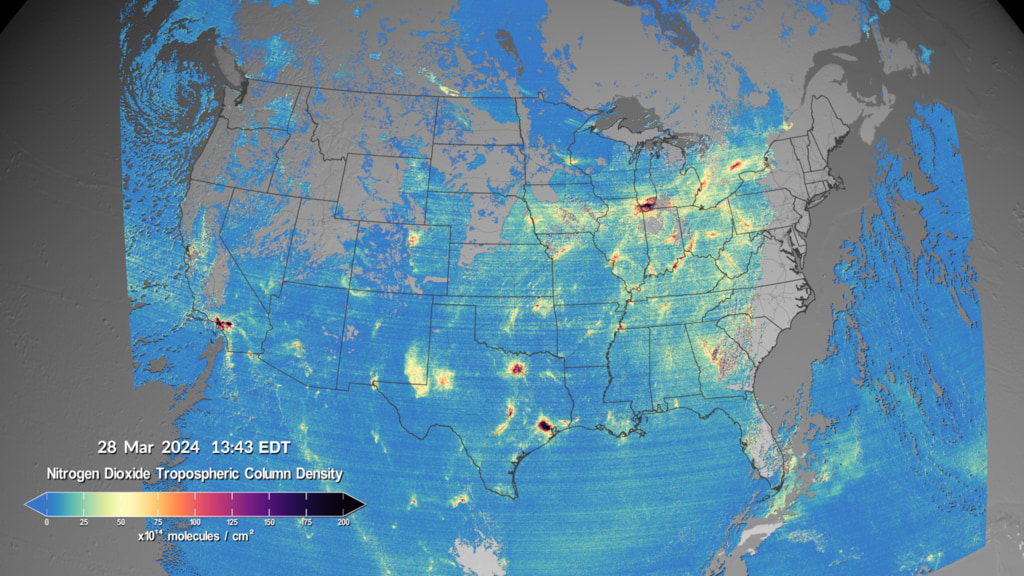

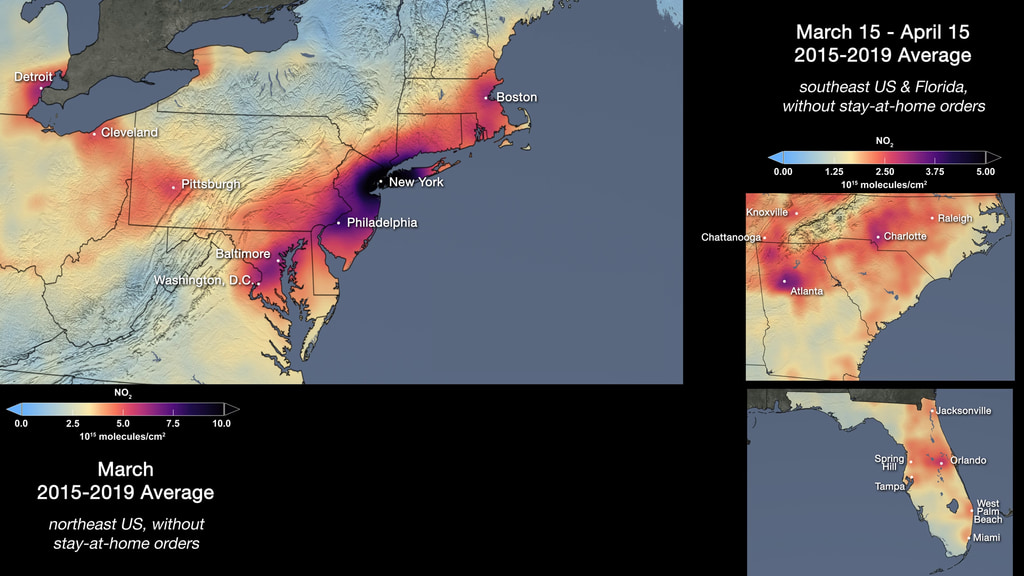









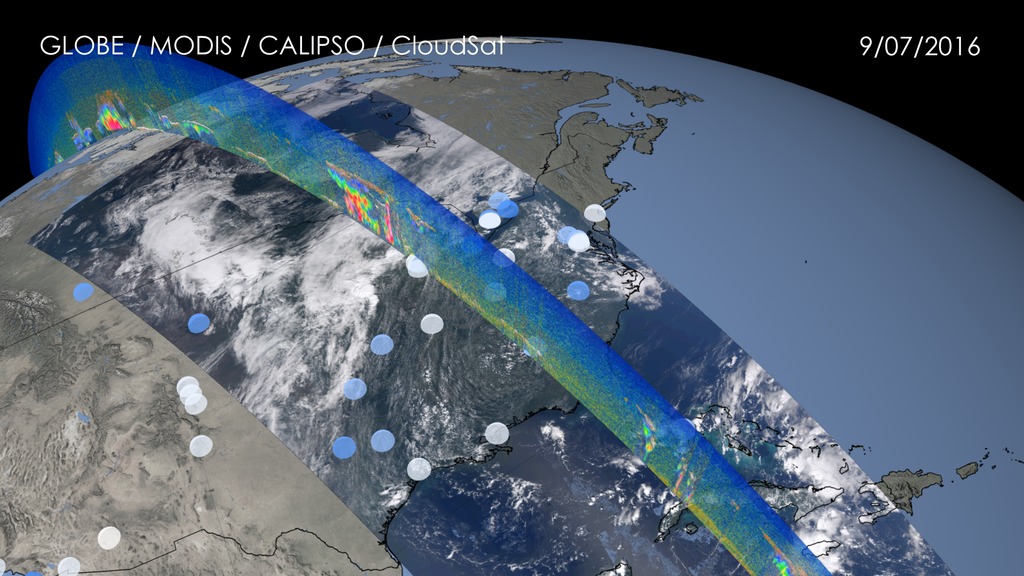
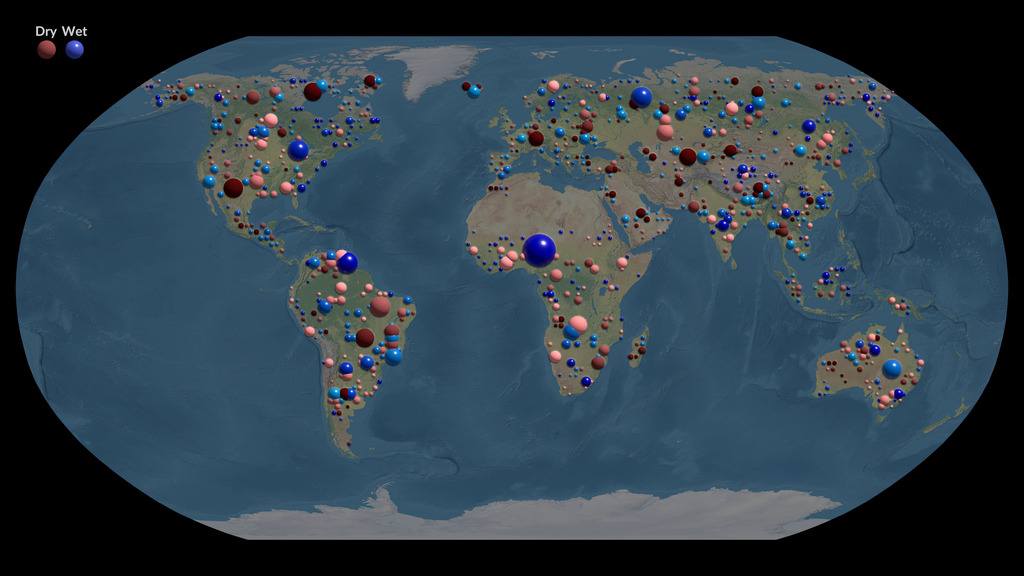
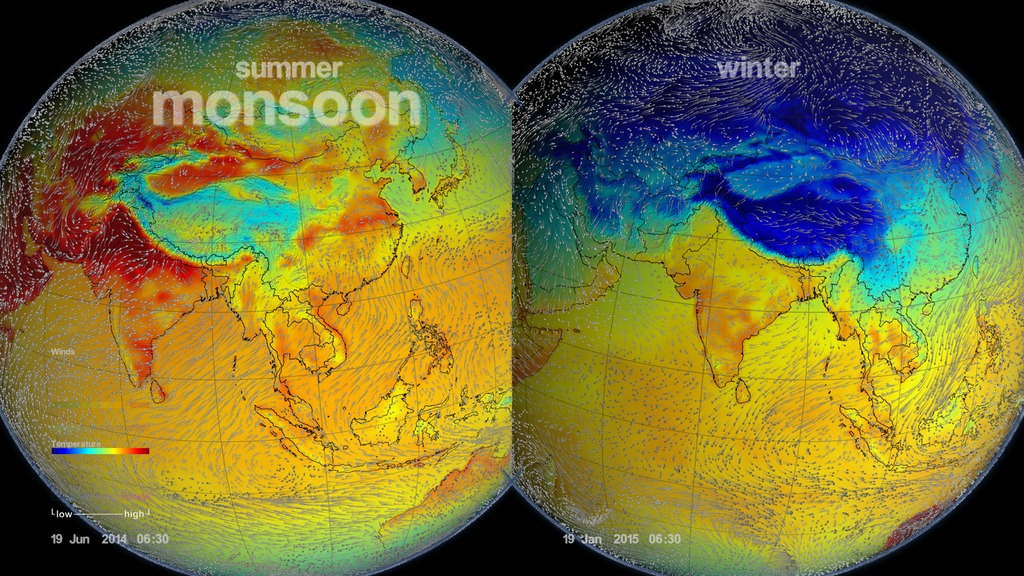
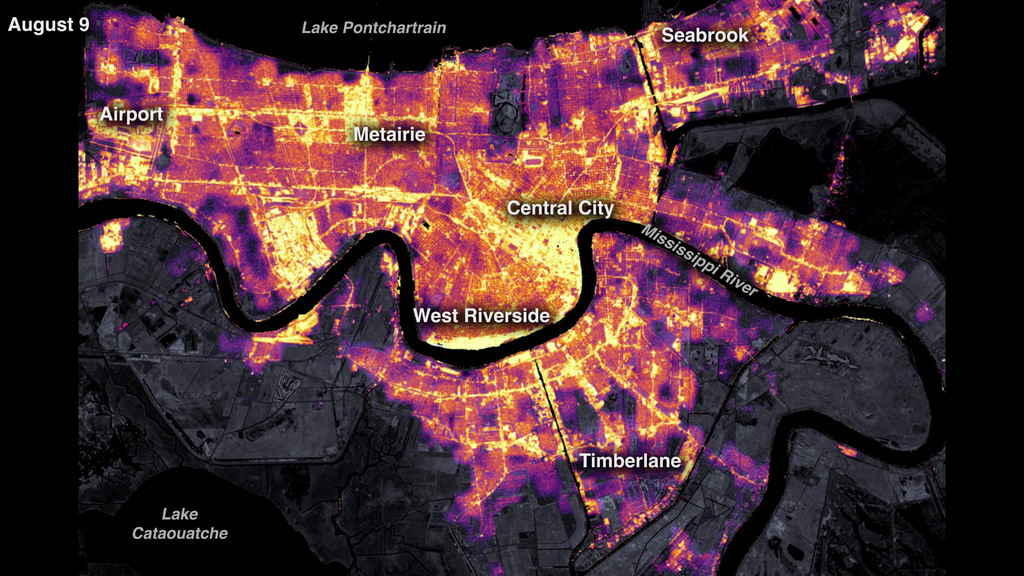







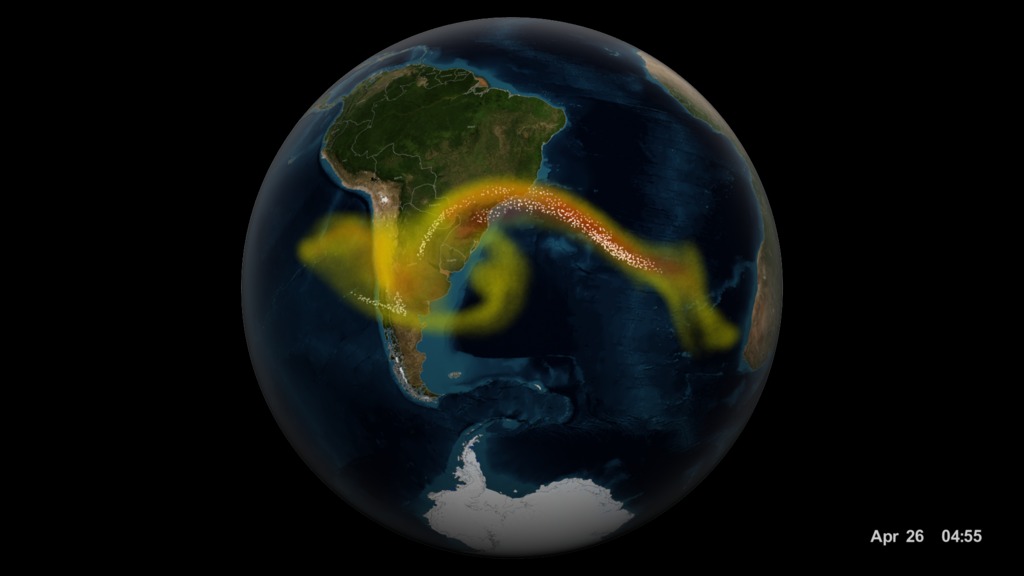
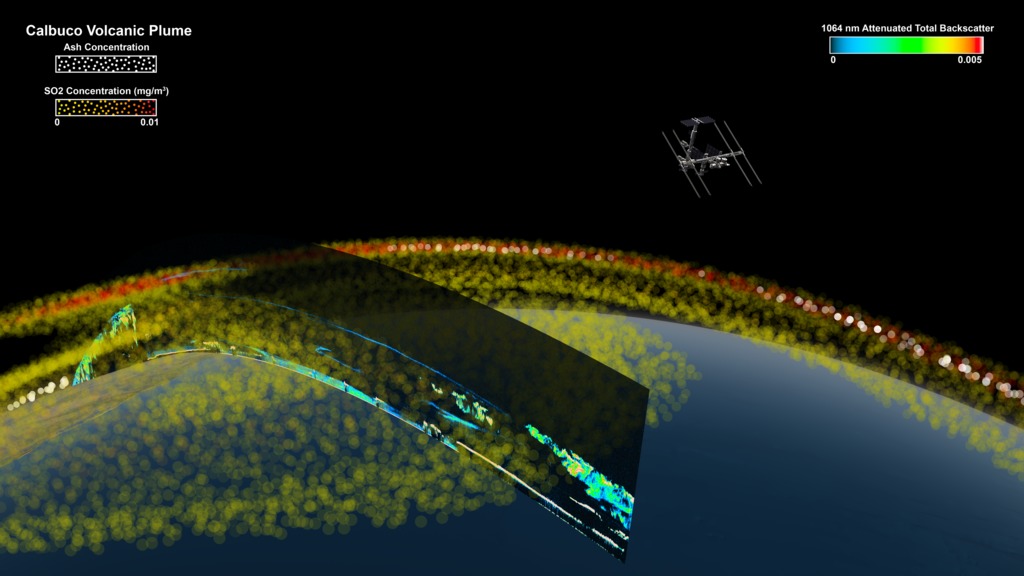


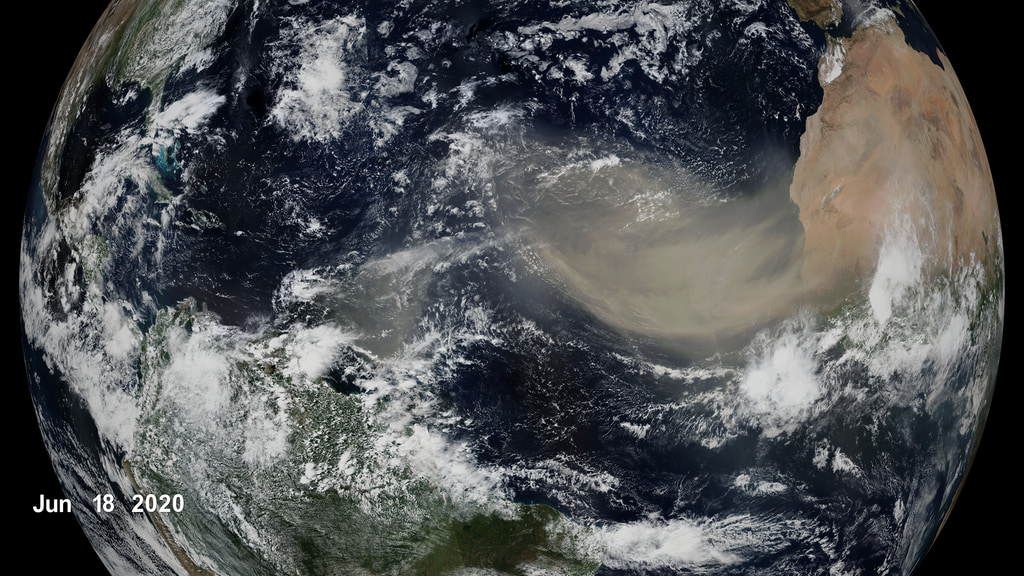

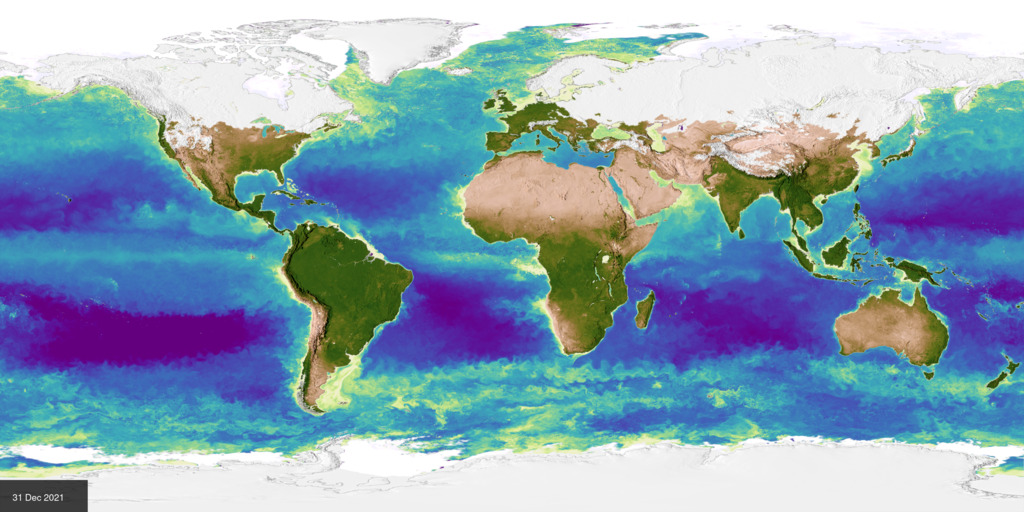








![The U.S. Department of Agriculture tracks how many acres and the annual yield for every crop produced. One method used to estimate crop acreage and yield is remote-sensing data from the NASA-USGS Landsat satellite program. The program started in 1997,with North Dakota, and by 2008 covered the entire lower 48 states and the District of Columbia. Music: "Downloading Landscapes" by Andrew Michael Britton [PRS] and David Stephen Goldsmith [PRS]. Published by Atmosphere Music Ltd [PRS].Complete transcript available.Watch this video on the NASA Goddard YouTube channel.](/vis/a010000/a013400/a013417/13417_Landsat_Croplands_print.jpg)
![Music: Building Ideas [Instrumental] by Todd James Carlin BakerComplete transcript available.](/vis/a010000/a013800/a013894/GLAM_thumbnail.png)


![Music: Futurity by Lee Groves [PRS] and Peter George Marett [PRS]Complete transcript available.](/vis/a010000/a013900/a013979/Screen_Shot_2021-10-28_at_2.29.18_PM.png)

![Music: Lines of Enquiry by Theo Golding [PRS]Complete transcript available.](/vis/a010000/a013500/a013574/Still.png)


![Music: “The Slickness” by Brett Engel [BMI]; Killer Tracks; Killer Edge; Universal Production Music“Shaking It Up” by Andrew Lappin [ASCAP]; Soundcast Music; Killer Edge; Universal Production Music](/vis/a010000/a013600/a013689/13689_GO_GettingStarted_MHM_SampleCollection.jpg)










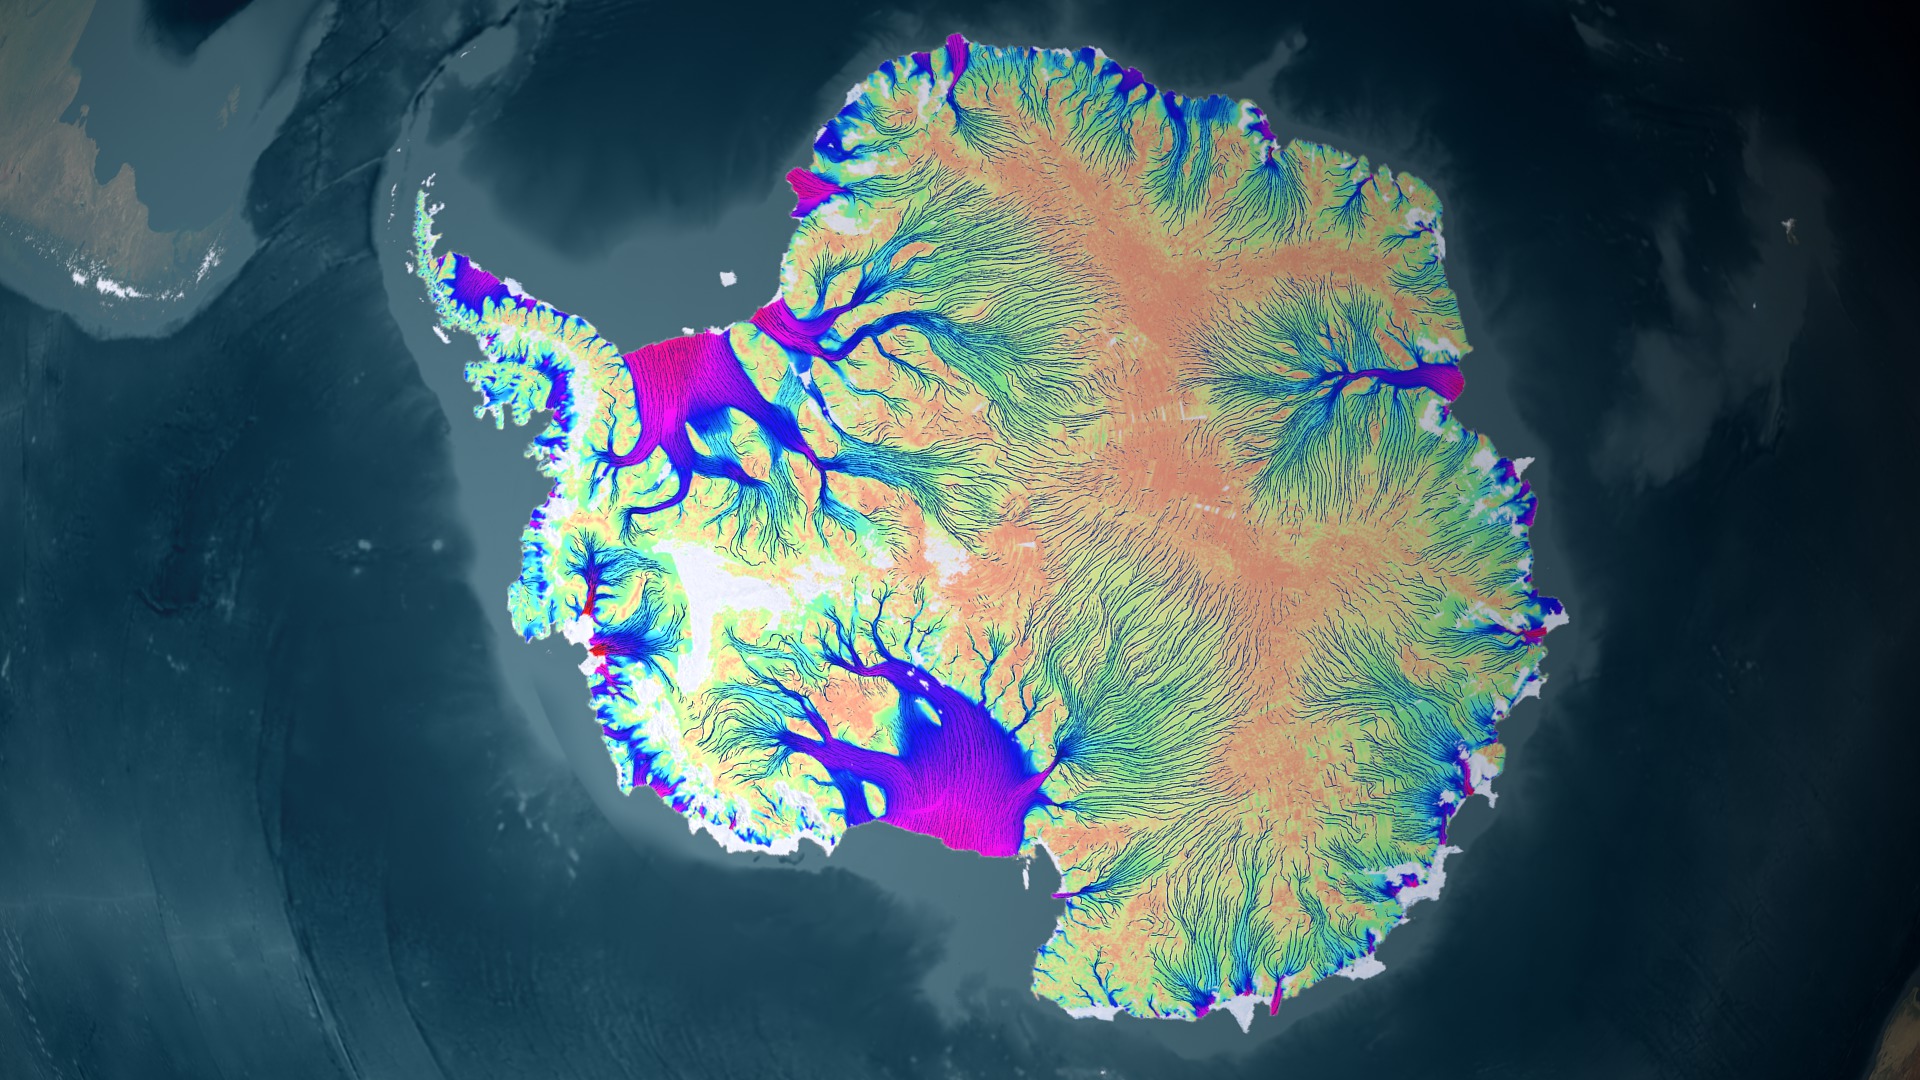


![VIDEO: "Witness the Breathtaking Beauty of Earth’s Polar Regions"
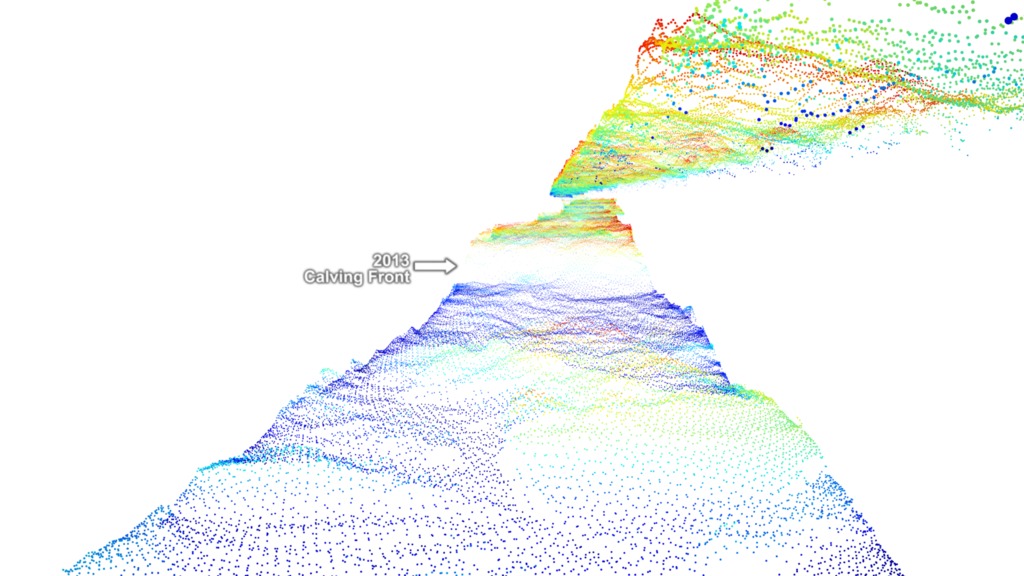
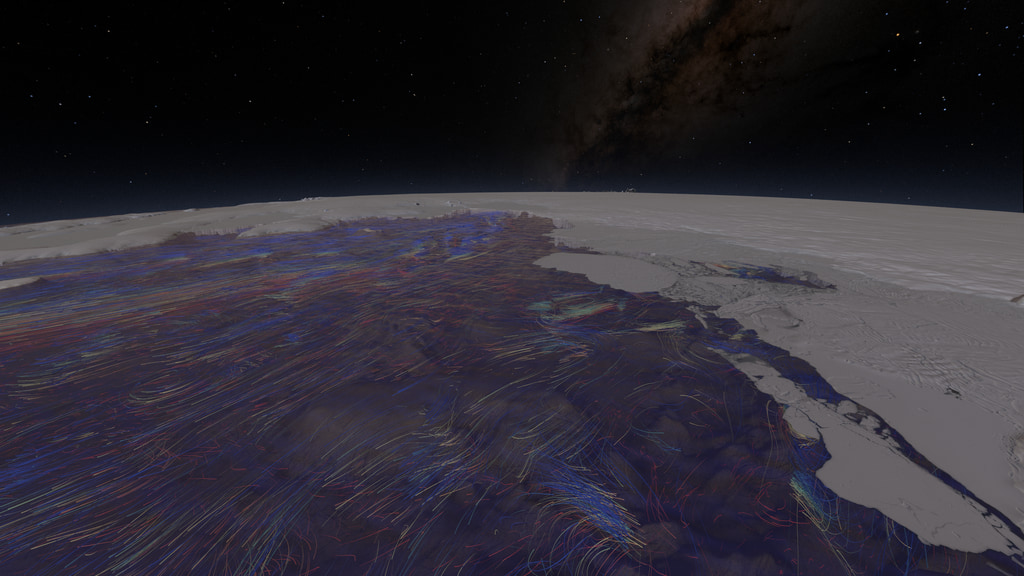
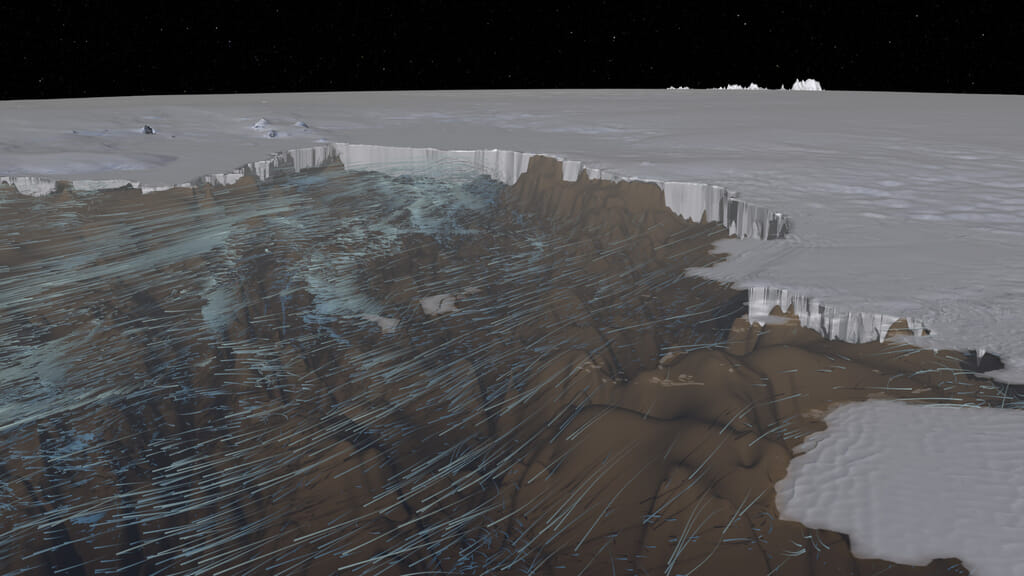
Operation IceBridge recorded the diversity and fragility of our rapidly changing polar regions. These areas are some of the most inhospitable, but breathtaking places on Earth. Sit back and witness the polar regions, from western Greenland to Antarctica. Notable features include the Pine Island Glacier, Larsen C ice shelf, and rapid summer melt on the western Greenland Ice Sheet.
Learn more: Operation IceBridge
Music Provided by Universal Production Music: "Arabesque No.1" by Claude Debussy [PD]
This video is also available on our YouTube channel.](/vis/a010000/a013500/a013577/13577_Cryosphere_Beauty_Classic.00018_print.jpg)








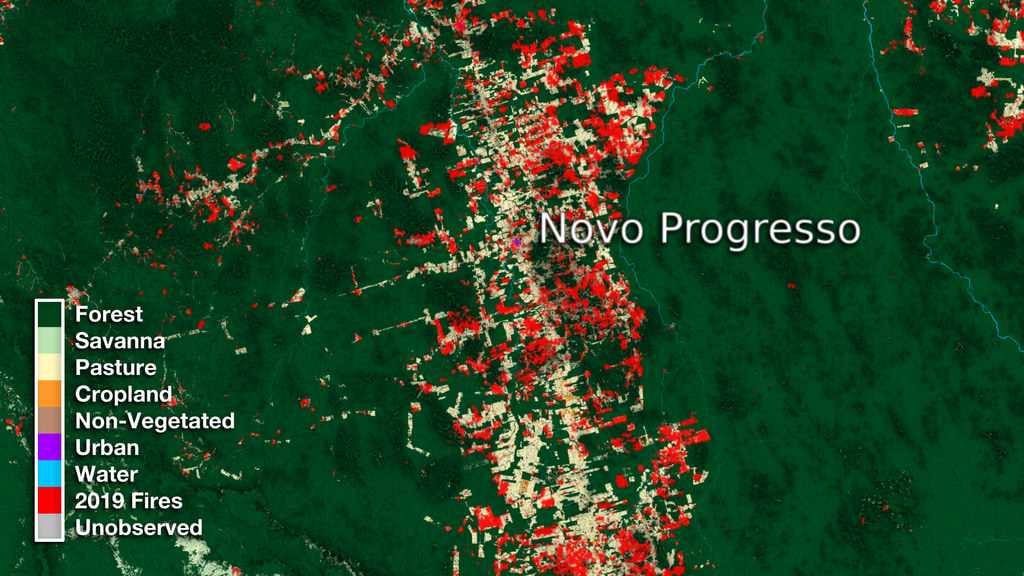
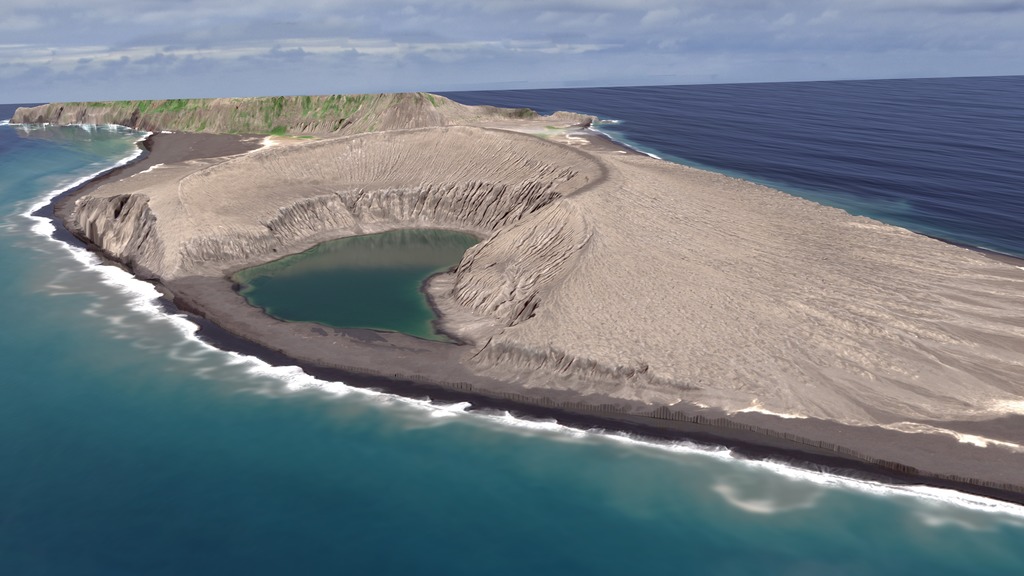


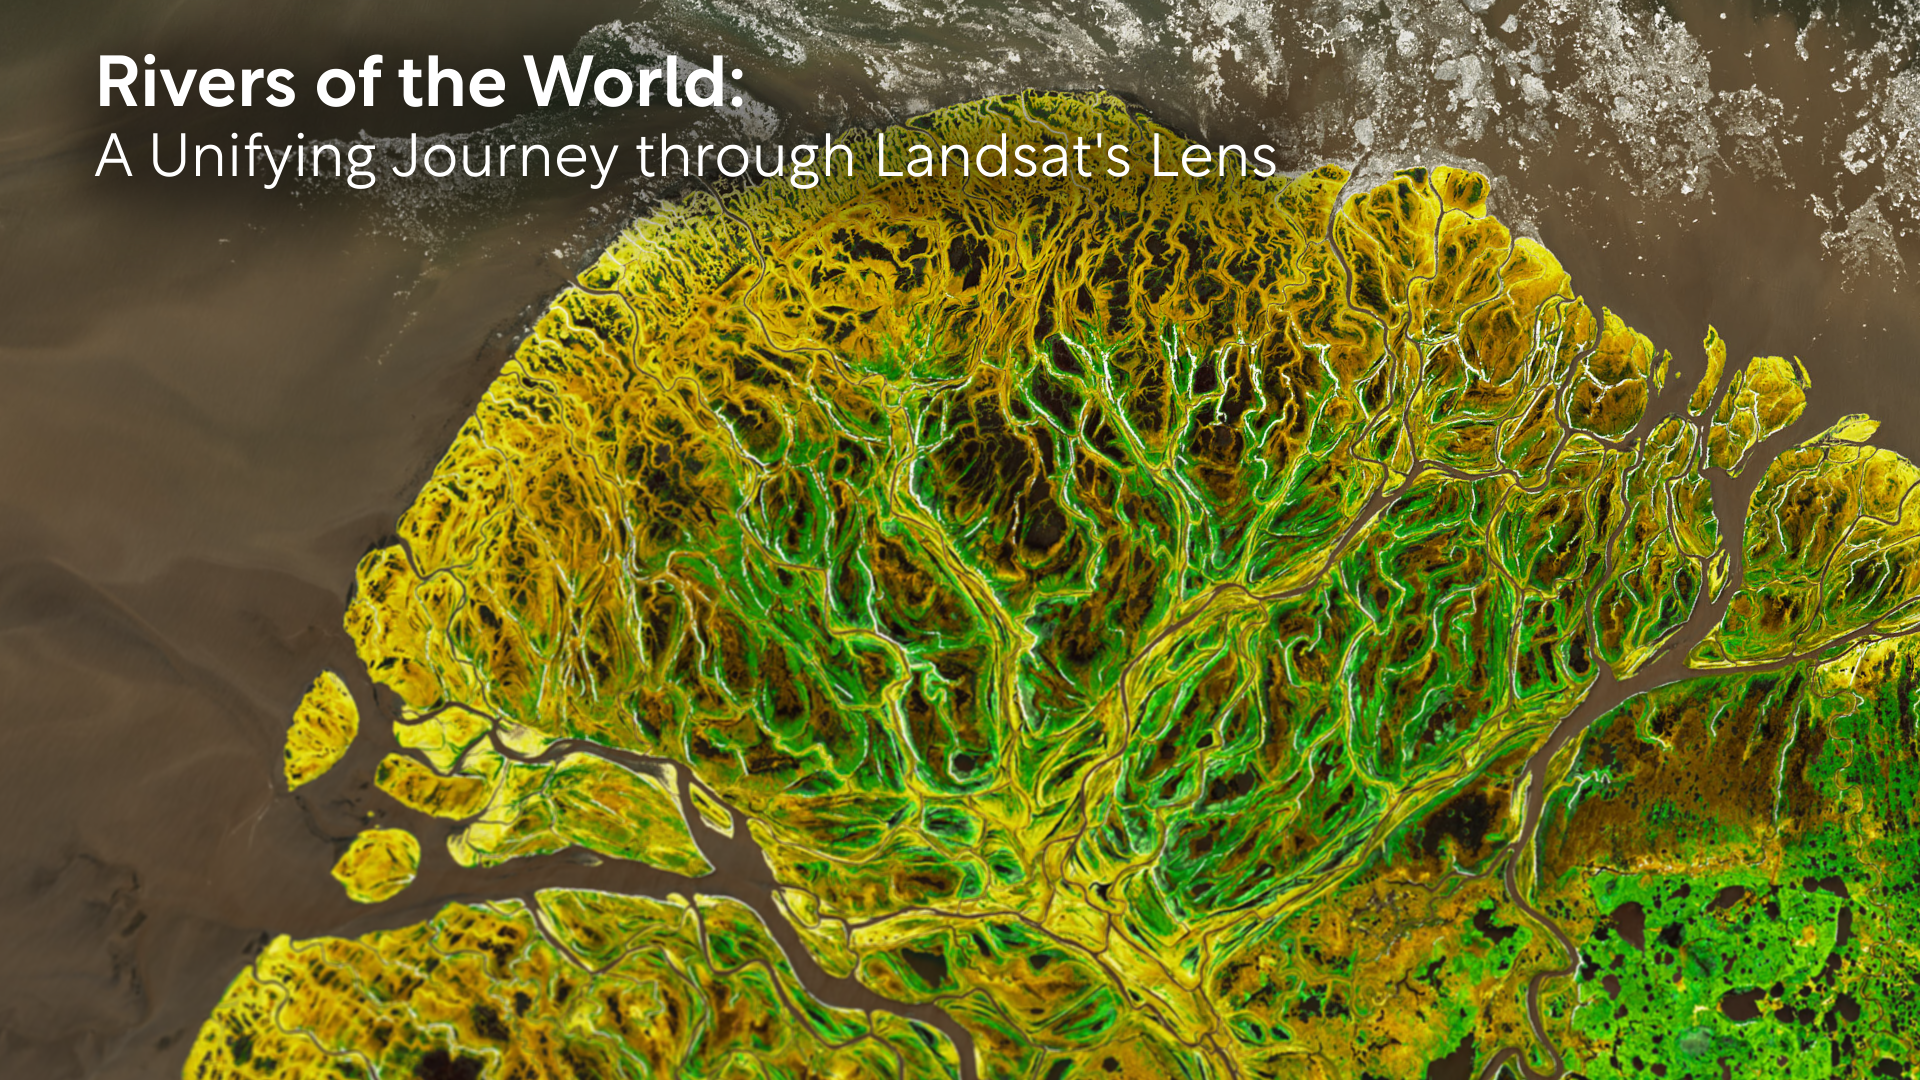


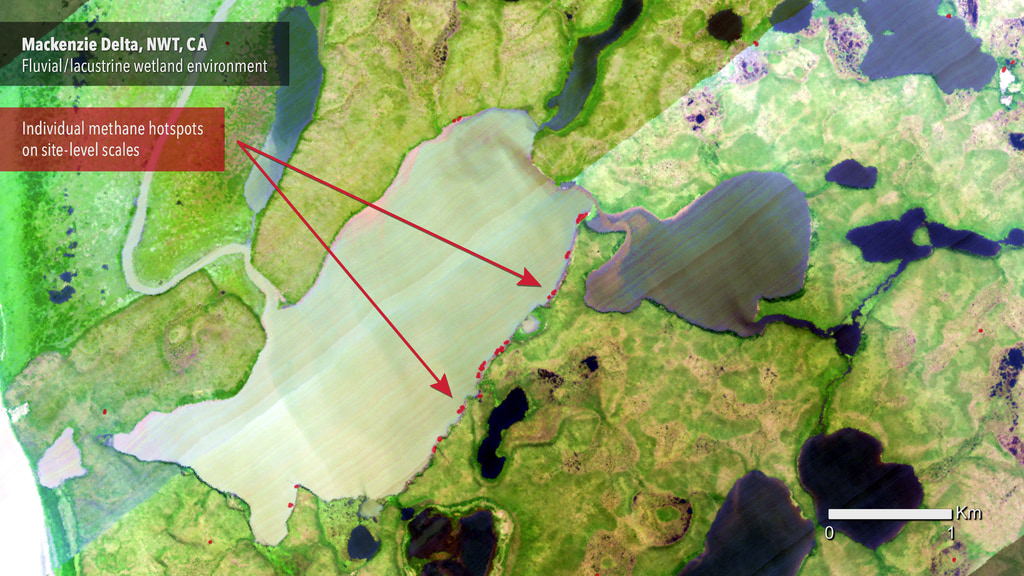

![Music: Circles of Life and Building Ideas by Todd James Carlin Baker [DPRS]Complete transcript available.](/vis/a010000/a013800/a013836/Delta-X_Final_4_12_W_Broll.00001_print.jpg)

![This vertical version of the video is for social media.NASA and NOAA, among other agencies, worked together this summer through the STAQS and AEROMMA missions to calibrate and validate NASA’s new TEMPO satellite. The satellite and missions combined aim to not only better measure air quality, and the major pollutants that impact it, but also to improve air quality, from street to stratosphere. This effort was documented during the August 2023 campaign leg, which took place over the Chicago region. Universal Music Production: Night Swimmer Instrumental [PRS], Living In The Light Instrumental [PRS], Nanofiber Instrumental [PRS], Results Take Time Instrumental [PRS], Spin Foam Instrumental [PRS], and Mindful Instrumental [PRS].
Additional images courtesy of Rafael Méndez Peña Additional images courtesy of Community Research On Climate and Urban Science Department of Energy Integrated Urban Field LaboratoryThis video can be freely shared and downloaded. While the video in its entirety can be shared without permission, some individual imagery provided by ASF is obtained through permission and may not be excised or remixed in other products. For more information on NASA’s media guidelines, visit https://www.nasa.gov/multimedia/guidelines/index.htmlComplete transcript available.](/vis/a010000/a014400/a014432/FINAL_IG.jpg)
