Hyperwall Power Playlist - Heliophysics Focus
Overview
This is a collection of our most powerful, newsworthy, and frequently used Hyperwall-ready visualizations, along with several that haven't gotten the attention they deserve. They're especially great for more general or top-level science talks, or to "set the scene" before a deep dive into a more focused subject or dataset. We've tried to cover the subject areas our speakers focus on most.
If you're not seeing what you're looking for, there is a huge library of visualizations more localized or specialized in subject - please use the Search function above, and filter "Result type" for "Hyperwall Visual."
![]() If you'd like to use one of these visualizations in your Hyperwall presentation, we'll need to know which element on which page. On the visualization's web page, below the visual you'd like to use, you'll see a Link icon next to the Download button. All we need is for you to click on that icon and include that link in your presentation Powerpoint/Keynote or visualization list. Additionally, please check our Hyperwall How-To Guide for tips on designing your Hyperwall presentation, file specifications, and Powerpoint/Keynote templates.
If you'd like to use one of these visualizations in your Hyperwall presentation, we'll need to know which element on which page. On the visualization's web page, below the visual you'd like to use, you'll see a Link icon next to the Download button. All we need is for you to click on that icon and include that link in your presentation Powerpoint/Keynote or visualization list. Additionally, please check our Hyperwall How-To Guide for tips on designing your Hyperwall presentation, file specifications, and Powerpoint/Keynote templates.
Science Mission Directorate and General Heliophysics
General Heliophysics and visualizations that cross divisions
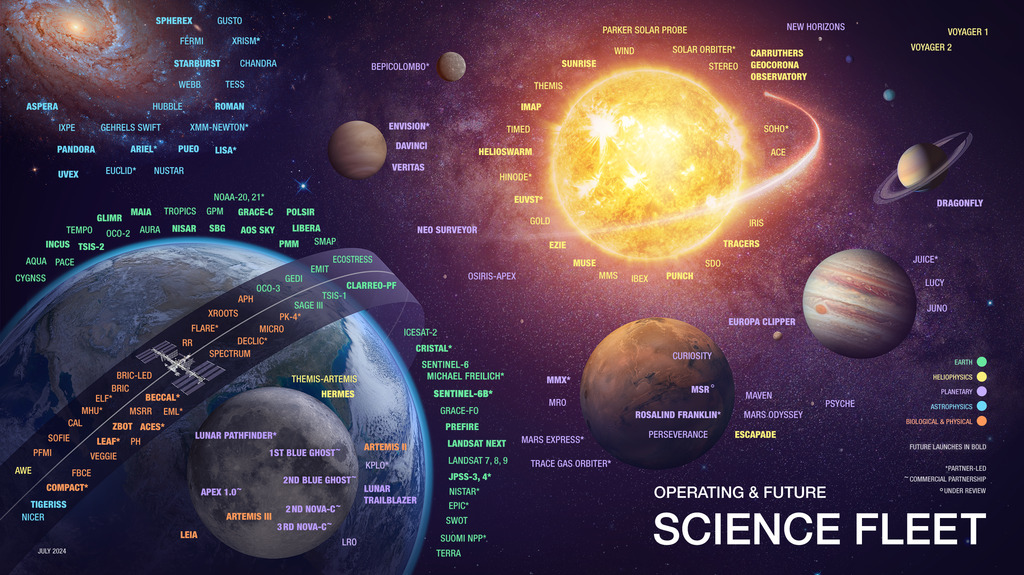
Operating and Future Science fleet
Go to this pageThe current operational and future science fleet. || SMD_MASTER_FLEET_07_29_2024-hw_tweaks_print.jpg (1024x575) [267.6 KB] || SMD_MASTER_FLEET_07_29_2024-hw_tweaks.png (2667x1500) [5.9 MB] || SMD_MASTER_FLEET_07_29_2024-hw_tweaks_searchweb.png (320x180) [191.9 KB] || SMD_MASTER_FLEET_07_29_2024-hw_tweaks_thm.png (80x40) [98.2 KB] || operating-and-future-science-fleet.hwshow ||
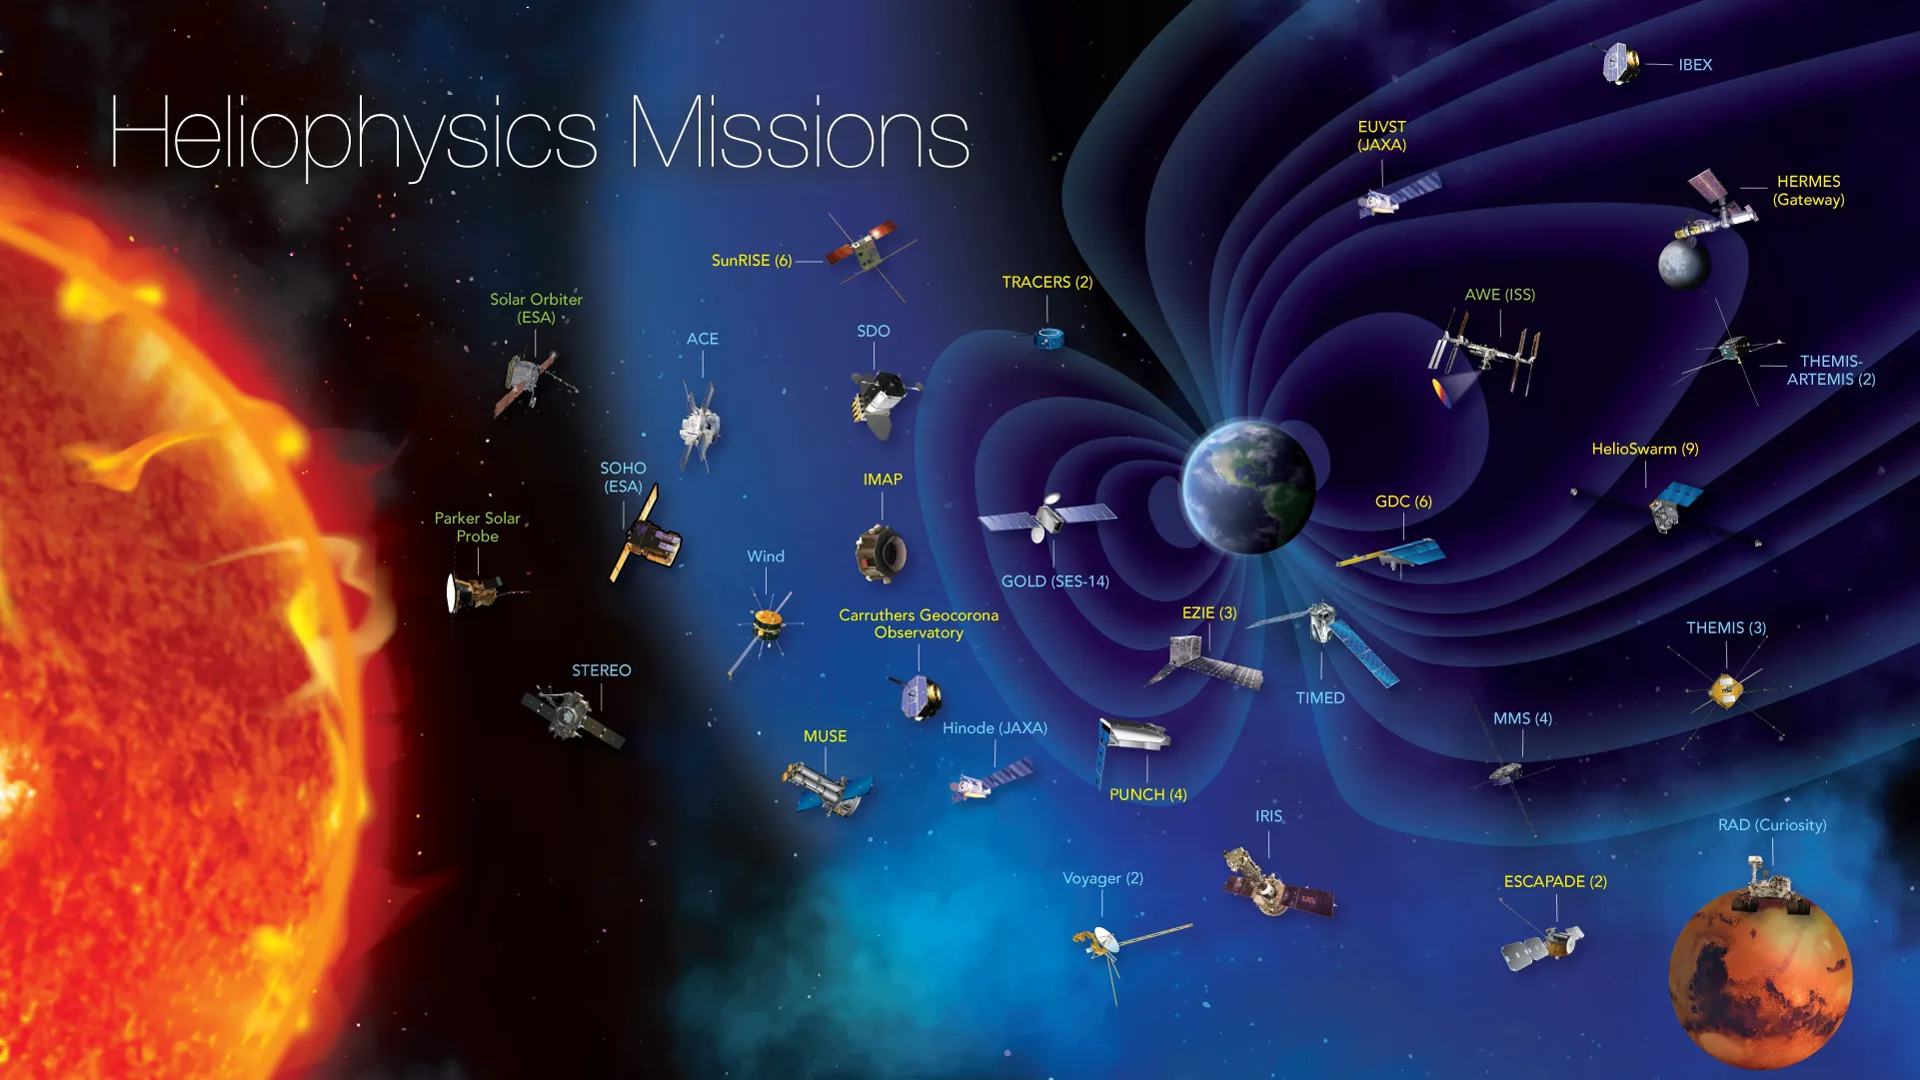
NASA's Heliophysics Fleet
Go to this pageThe current Heliophysics fleet || hpd-fleet-chart-jan-2024_print.jpg (1024x576) [180.0 KB] || hpd-fleet-chart-jan-2024.png (3840x2160) [7.3 MB] || hpd-fleet-chart-jan-2024_searchweb.png (320x180) [91.3 KB] || hpd-fleet-chart-jan-2024_thm.png (80x40) [7.2 KB] || nasas-fleets-by-division-helio-jewel.hwshow [228 bytes] ||
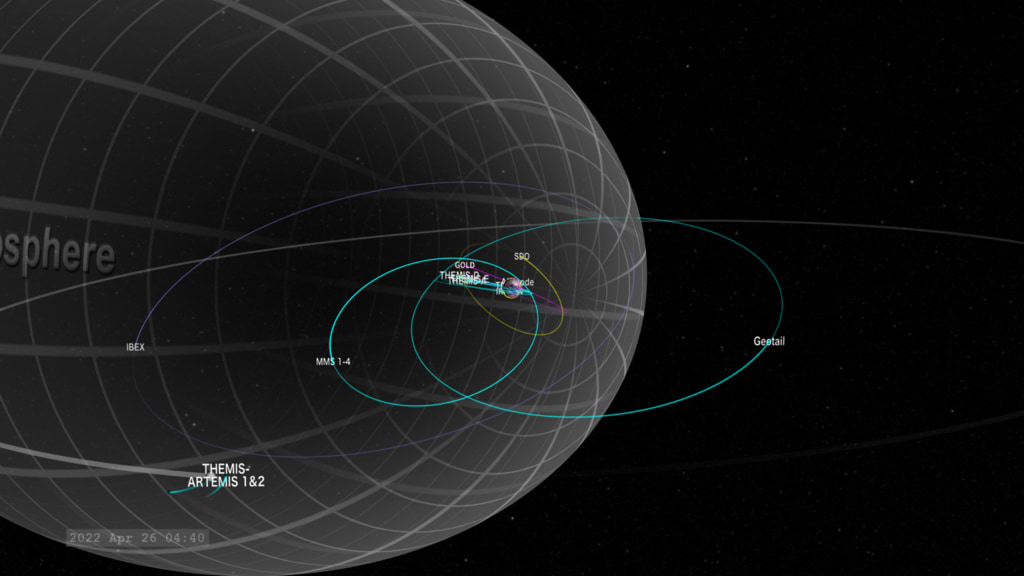
Heliophysics Sentinels 2022
Go to this pageThere has been one significant change since the 2020 Heliophysics Fleet. SET has been decommissioned. As of Fall 2022, here's a tour of the NASA Heliophysics fleet from the near-Earth satellites out to the Voyagers beyond the heliopause.Excepting the Voyager missions, the satellite orbits are color coded for their observing program:Magenta: TIM (Thermosphere, Ionosphere, Mesosphere) observationsYellow: solar observations and imageryCyan: Geospace and magnetosphereViolet: Heliospheric observations ||
Heliophysics Big Year Graphic Elements
Go to this sectionThe Heliophysics Big Year is a NASA-led public engagement campaign designed to promote heliophysics broadly, make heliophysics science and information accessible to all, and showcase ongoing efforts to understand the Sun and all that it touches. We are challenging the public to participate in as many Sun science activities as possible from October 2023 to December 2024, leading up to and around solar maximum.This page contains graphic elements for use in promotion and support of the Heliophysics Big Year. Anyone supporting the Heliophysics Big Year effort may use these resources in accordance with the guidance listed in the captions.
Our Solar System
Go to this pageThe 8 planets plus Pluto with planetary axis tilt || planets3x3_pluto_colorMercury_axis_tilt_1080p.00001_print.jpg (1024x576) [75.1 KB] || planets3x3_pluto_colorMercury_axis_tilt_1080p.00001_searchweb.png (320x180) [49.6 KB] || planets3x3_pluto_colorMercury_axis_tilt_1080p.00001_thm.png (80x40) [5.0 KB] || planets3x3_pluto_colorMercury_axis_tilt_720p.00001_web.png (320x180) [50.6 KB] || planets3x3_pluto_colorMercury_axis_tilt_720p.00001_thm.png (80x40) [5.0 KB] || planets3x3_pluto_colorMercury_axis_tilt_1080p.mp4 (1920x1080) [9.2 MB] || planets3x3_pluto_colorMercury_axis_tilt_720p.mp4 (1280x720) [4.7 MB] || planets3x3_pluto_colorMercury_axis_tilt_1080p.webm (1920x1080) [2.7 MB] || planets3x3_pluto_colorMercury_axis_tilt_2160p.mp4 (3840x2160) [28.7 MB] || 3x3_pluto_tilt (4104x2304) [0 Item(s)] || 100-science-overview-001.hwshow ||
Dynamic Earth-A New Beginning
Go to this pageThe visualization 'Excerpt from "Dynamic Earth"' has been one of the most popular visualizations that the Scientific Visualization Studio has ever created. It's often used in presentations and Hyperwall shows to illustrate the connections between the Earth and the Sun, as well as the power of computer simulation in understanding those connections.There is one part of this visualization, however, that has always seemed a little clumsy to us. The opening shot is a pullback from the limb of the sun, where the sun is represented by a movie of 304 Angstrom images from the Solar Dynamics Observatory (SDO). It is difficult to pull back from the limb of a flat sun image and make the sun look spherical, and the problem was made more difficult because the original sun images were in a spherical dome show format. As a result, the pullback from the sun showed some odd reprojection artifacts.The best solution to this issue was to replace the existing pullout with a new one, one which pulled directly out from the center of the solar disk. For the new beginning, we chose a series of SDO images in the 171 Angstrom channel that show a visible coronal mass ejection (CME) in the lower right corner of the solar disk. Although this is not the specific CME that is seen affecting Venus and Earth later in this visualization, its presence links the SDO animation thematically to the later solar storm. The SDO images were also brightened considerably and tinted yellow to match the common perception of the Sun as a bright yellow object (even though it is actually white).Please go to the original version of this visualization to see the complete credits and additional details. ||
Satellite Animations
Go to this pageA collection of spacecraft beauty pass animations for current missions.
Launches and Landings on the Hyperwall
Go to this pageLaunches and Landings of missions across all 5 divisions
Full Screen NASA Logo
Go to this sectionIn order to study the Earth as a whole system and understand how it is changing, NASA develops and supports a large number of Earth observing missions. These missions provide Earth science researchers the necessary data to address key questions about global climate change. Missions begin with a study phase during which the key science objectives of the mission are identified, and designs for spacecraft and instruments are analyzed. Following a successful study phase, missions enter a development phase whereby all aspects of the mission are developed and tested to insure it meets the mission objectives. Operating missions are those missions that are currently active and providing science data to researchers. Operating missions may be in their primary operational phase or in an extended operational phase. Missions begin with a study phase during which the key science objectives of the mission are identified, and designs for spacecraft and instruments are analyzed. Following a successful study phase, missions enter a development phase whereby all aspects of the mission are developed and tested to insure it meets the mission objectives.
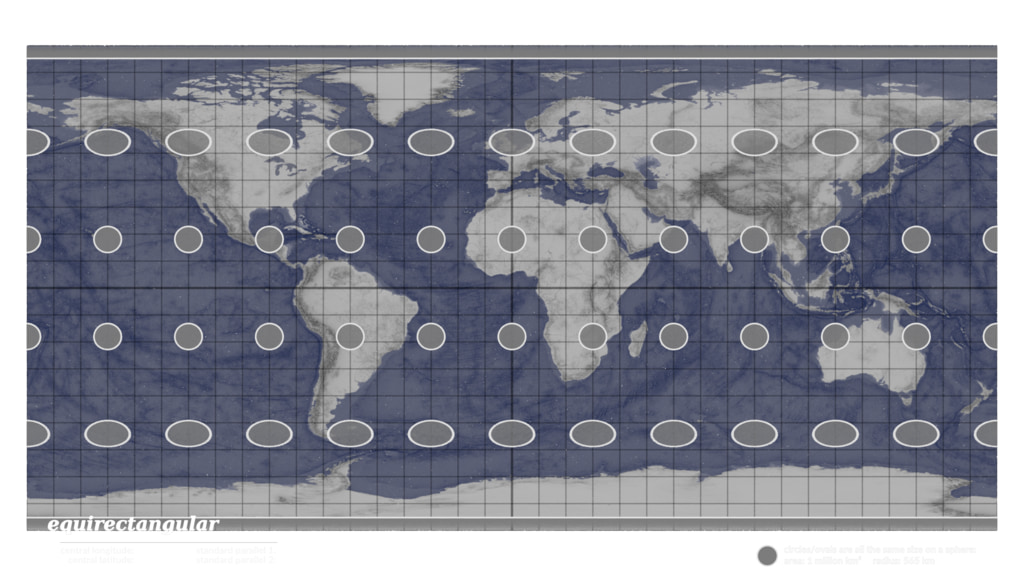
Map Projections Morph
Go to this pageMorphing between various map projections || projection_morph_comp.01000_print.jpg (1024x576) [139.0 KB] || projection_morph_comp.01000_searchweb.png (320x180) [77.1 KB] || projection_morph_comp.01000_thm.png (80x40) [6.6 KB] || comp (3840x2160) [0 Item(s)] || map_layer (3840x2160) [0 Item(s)] || overlay_layer (3840x2160) [0 Item(s)] || projection_morph_comp_2160p59.94_2.webm (3840x2160) [31.7 MB] || projection_morph_comp_2160p59.94_2.mp4 (3840x2160) [175.0 MB] ||
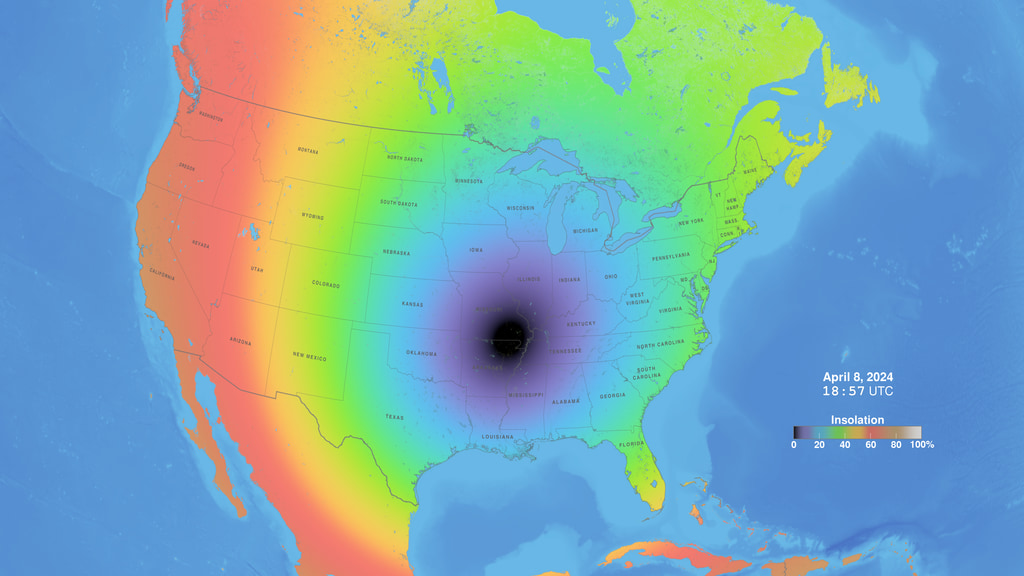
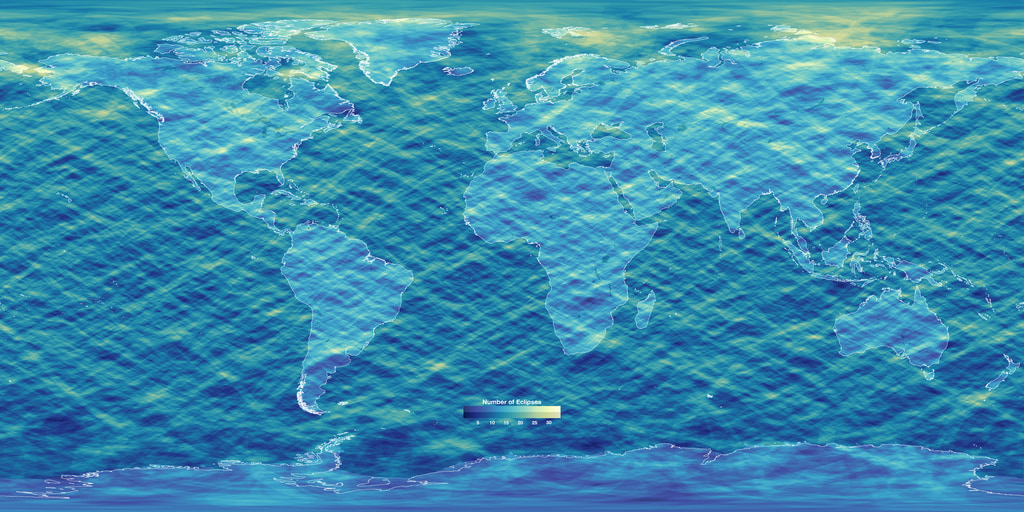
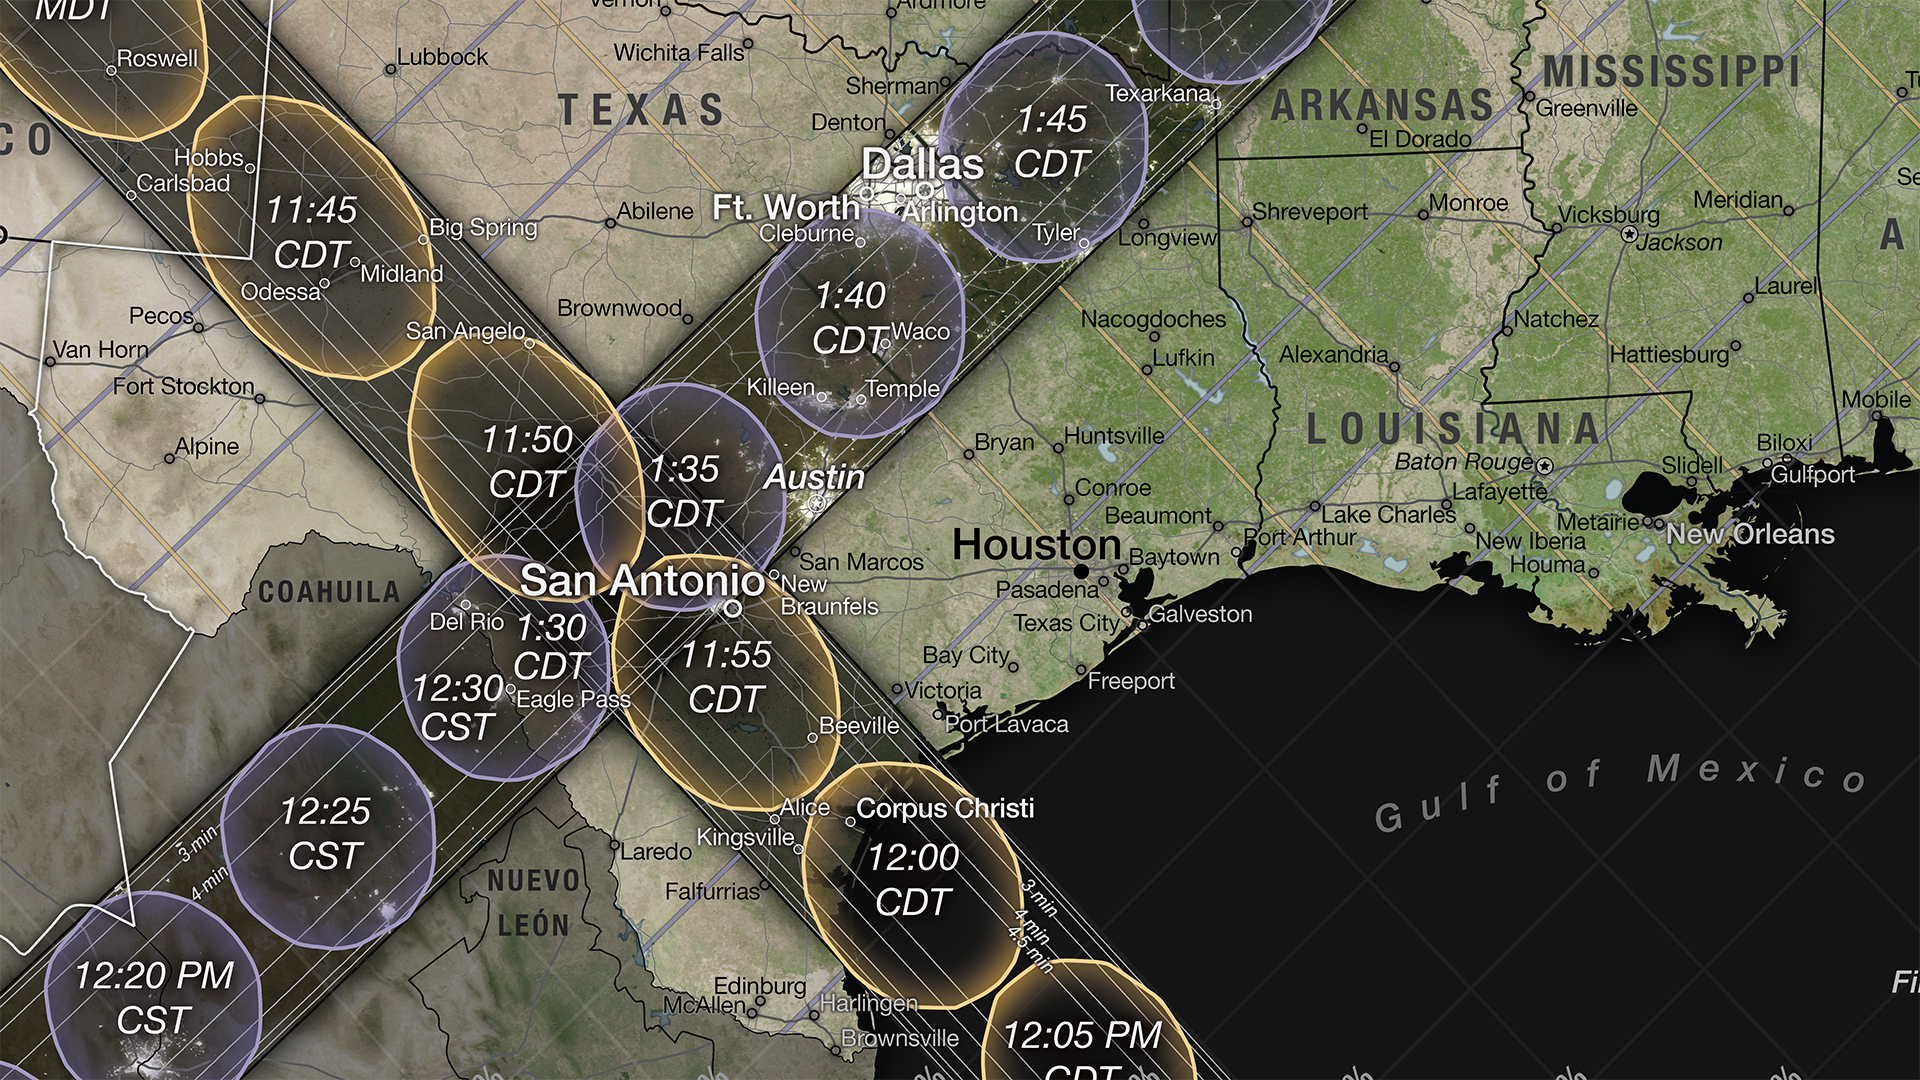
Eclipse
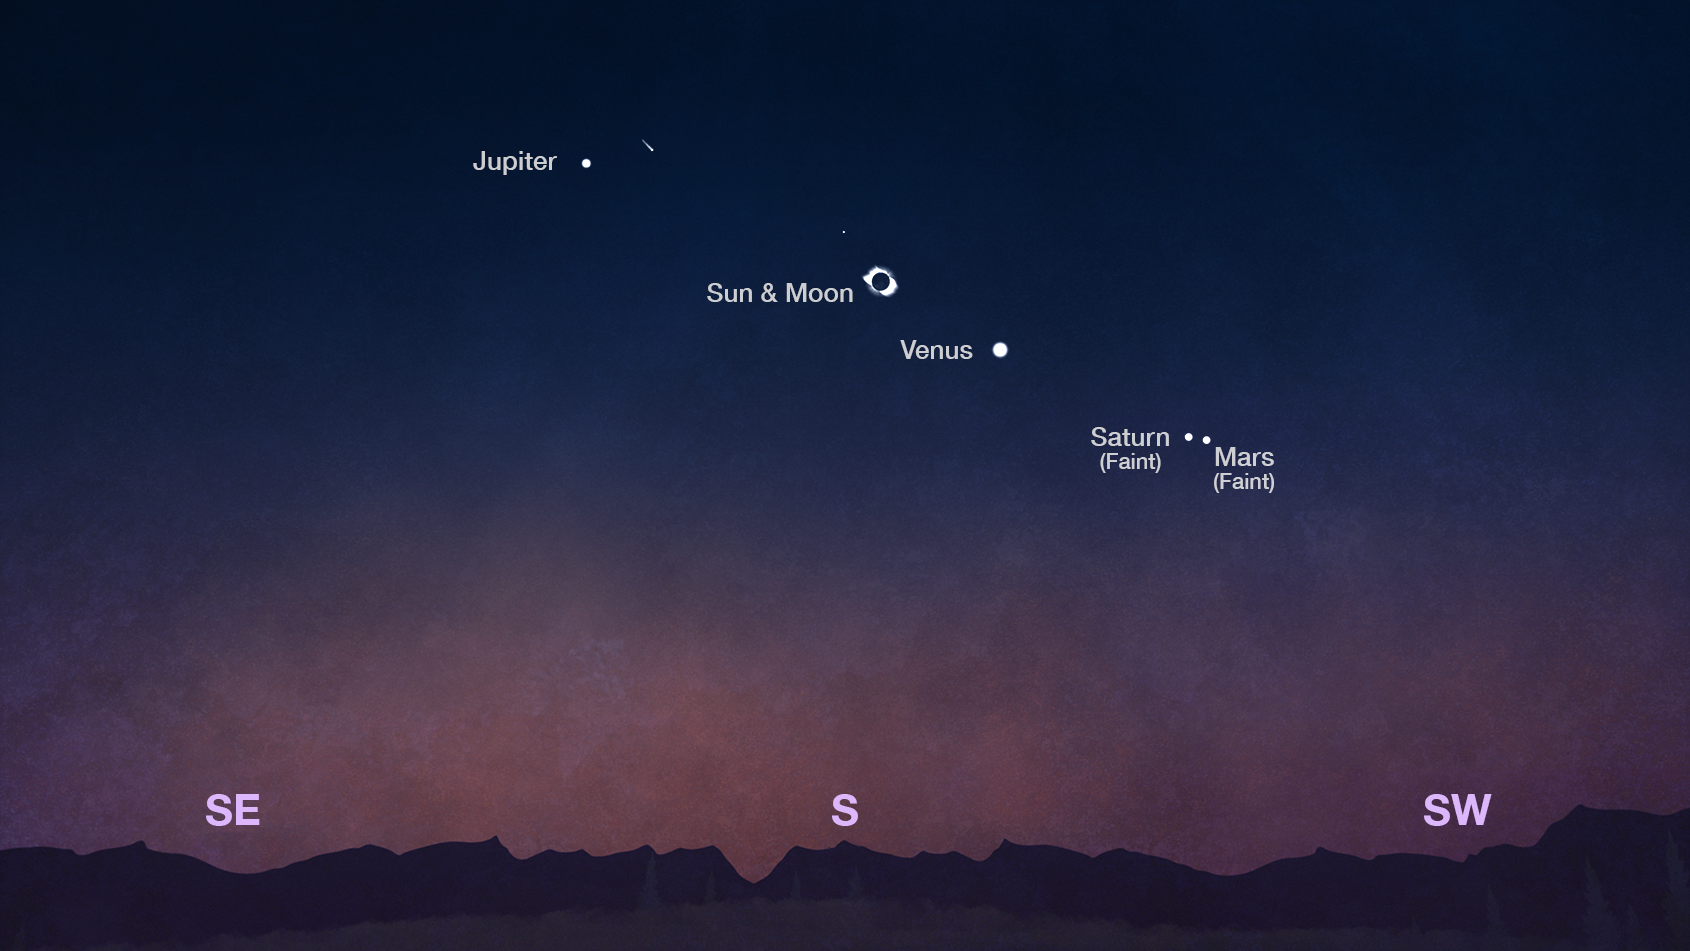
2023 Annular Eclipse, 2024 Total Eclipse, and beyond
- Produced Video
- Produced Video
- Visualization
- Visualization
- Visualization
- Visualization
- Visualization
- Visualization
- Visualization
- Visualization
- Visualization
The Solar Dynamics Observatory
SDO observations
Solar Dynamics Observatory - Argo view
Go to this pageArgos (or Argus Panoptes) was the 100-eyed giant in Greek mythology (wikipedia).While the Solar Dynamics Observatory (SDO) has significantly less than 100 eyes, (see "SDO Jewelbox: The Many Eyes of SDO"), seeing connections in the solar atmosphere through the many filters of SDO presents a number of interesting challenges. This visualization experiment illustrates a mechanism for highlighting these connections.The wavelengths presented are: 617.3nm optical light from SDO/HMI. From SDO/AIA we have 170nm (pink), then 160nm (green), 33.5nm (blue), 30.4nm (orange), 21.1nm (violet), 19.3nm (bronze), 17.1nm (gold), 13.1nm (aqua) and 9.4nm (green).We've locked the camera to rotate the view of the Sun so each wedge-shaped wavelength filter passes over a region of the Sun. As the features pass from one wavelength to the next, we can see dramatic differences in solar structures that appear in different wavelengths.Filaments extending off the limb of the Sun which are bright in 30.4 nanometers, appear dark in many other wavelengths.Sunspots which appear dark in optical wavelengths, are festooned with glowing ribbons in ultraviolet wavelengths.Small flares, invisible in optical wavelengths, are bright ribbons in ultraviolet wavelengths.If we compare the visible light limb of the Sun with the 170 nanometer filter on the left, with the visible light limb and the 9.4 nanometer filter on the right, we see that the 'edge' is at different heights. This effect is due to the different amounts of absorption, and emission, of the solar atmosphere in ultraviolet light.In far ultraviolet light, the photosphere is dark since the black-body spectrum at a temperature of 5700 Kelvin emits very little light in this wavelength. ||
SDO Jewelbox: The Many Eyes of SDO
Go to this page5x3 Layout view. This version has the imagery organized in order of increasing wavelength, from upper left to lower right for AIA. The HMI products occupy the bottom row. || SDOJewelbox_5x3.0100.jpg (2400x810) [317.7 KB] || SDOJewelbox_5x3.0100_web.png (320x108) [28.9 KB] || SDOJewelbox_5x3.0100_thm.png (80x40) [3.7 KB] || SDOJewelbox_5x3.0100_searchweb.png (320x180) [29.2 KB] || SDOJewelbox_5x3.webmhd.webm (960x540) [3.3 MB] || SDOJewelbox_5x3.mov (2400x810) [91.5 MB] || SDOJewelbox_5x3.mp4 (2400x810) [91.5 MB] || 2400x810_80x27_30p (2400x810) [0 Item(s)] ||
Incredible Solar Flare, Prominence Eruption and CME Event (304 angstroms)
Go to this pageOn June 7, 2011, an M-2 flare occurred on the Sun which released a very large coronal mass ejection (CME). Much of the ejected material is much cooler (less than about 80,000K) and therefore appears dark against the brighter solar disk.Material which does not reach solar escape velocity can be seen falling back and striking the solar surface, sometimes triggering smaller events.This image sequence is captured at one minute intervals and designed to play synchronously with animations 3839 (171 Ångstroms), 3840 (211 Ångstroms) and 3841 (1700 Ångstroms). ||
A Smiling Sun
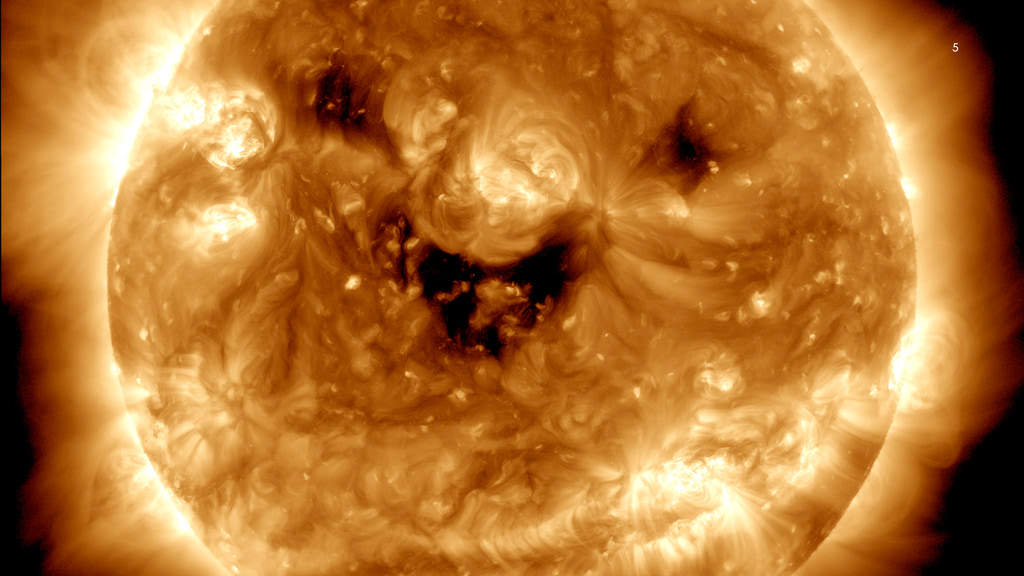
Go to this pageSolar Dynamics Observatory image of the Sun from October, 2022 || 2022-agu-fox-slide5_print.jpg (1024x576) [144.3 KB] || 2022-agu-fox-slide5.png (3840x2160) [10.5 MB] || 2022-agu-fox-slide5_searchweb.png (320x180) [93.5 KB] || 2022-agu-fox-slide5_thm.png (80x40) [7.5 KB] || a-smiling-sun.hwshow [275 bytes] ||
Several impressive filament eruptions leading up to an M 8.7 Flare at Active Region 13234 - February 27-28, 2023
Go to this pageSolar Dynamics Observatory (SDO) operates in a geosynchronous orbit around Earth to obtain a continuous view of the Sun. The particular instrument in this visualization records imagery in the ultraviolet portion of the spectrum at wavelengths normally absorbed by Earth's atmosphere - so we need to observe them from space.Some impressive filaments erupt on the solar limb (lower left and lower right) in the early part of this image series. Later (17:46:42 TAI), an active region in the upper right quadrant of the solar disk launches a mid-level M 8.7 class flare.Event Description ||
Dancing on the Limb - May 1, 2023
Go to this pageSolar Dynamics Observatory (SDO) operates in a geosynchronous orbit around Earth to obtain a continuous view of the Sun. The particular instrument in this visualization records imagery in the ultraviolet portion of the spectrum at wavelengths normally absorbed by Earth's atmosphere - so we need to observe them from space.A large loop of solar plasma executes some interesting long-lived (15 hours in this series) gyrations on the lower solar limb. ||
133 Days on the Sun
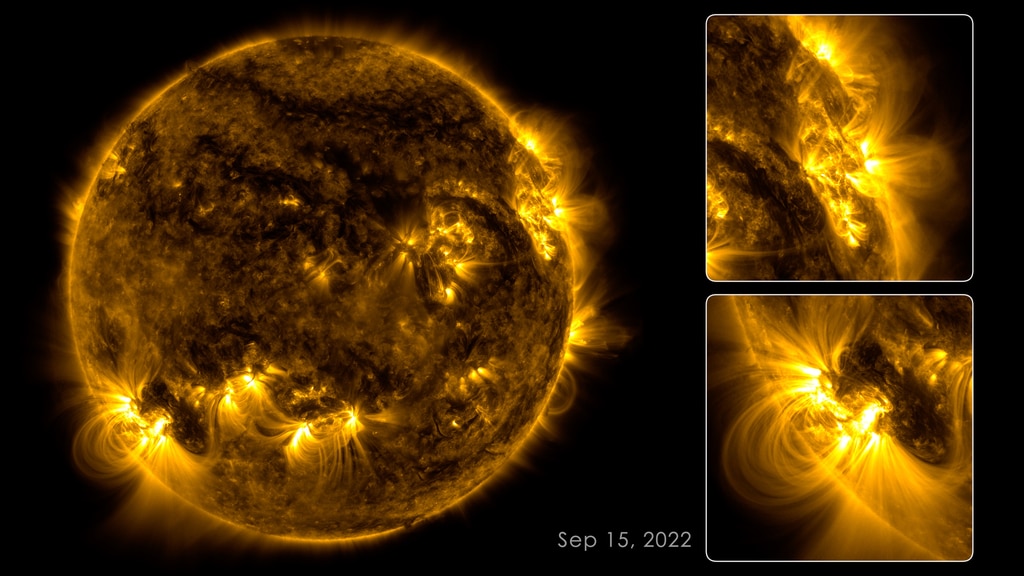
Go to this pageThis 133-day time lapse of the Sun at 17.1nm shows brilliant active regions, dynamic loops of plasma and numerous solar eruptions.Music (in order): Concave Hexagon, Heptagon, Tetrahedron, Triangular Prism, Square-based Pyramid, Irregular Quadrilateral, Equilateral Triangle, Dodecahedron, Icosahedron, all from "Geometric Shapes" written and produced by Lars Leonhard.Credit: NASA's Goddard Space Flight Center/SDOWatch this video on the NASA Goddard YouTube channel.Complete transcript available.Video Descriptive Text available. || 133DaysontheSun_StillSept15_print.jpg (1024x576) [134.4 KB] || 133DaysontheSun_StillSept15.png (3840x2160) [25.3 MB] || 133DaysontheSun_StillSept15.jpg (3840x2160) [1.1 MB] || 133DaysontheSun_StillSept15_searchweb.png (320x180) [74.6 KB] || 133DaysontheSun_StillSept15_thm.png (80x40) [6.8 KB] || 14263_133_Days_on_the_Sun_1080.mp4 (1920x1080) [4.3 GB] || 14263_133_Days_on_the_Sun_1080.webm (1920x1080) [470.3 MB] || 14263_133_Days_on_the_Sun_ProRes_3840x2160_2997.mov (3840x2160) [156.8 GB] || 14263_133_Days_on_the_Sun_4k_100mbps.mp4 (3840x2160) [41.5 GB] || 14263_133_Days_on_the_Sun_4k.mp4 (3840x2160) [10.5 GB] || 133_Days-on_the_Sun_SRT_Captions.en_US.srt [2.5 KB] || 133_Days-on_the_Sun_SRT_Captions.en_US.vtt [2.6 KB] ||
SDO Video Toolkit
Go to this pageThe Trebuchet eruption (upper left) as seen in the SDO AIA 304 angstrom filter. This is probably one of the more popular views of the event.4k source files || New_Trebuchet_mkII.00300_print.jpg (1024x576) [336.5 KB] || New_Trebuchet_mkII.00300_print_searchweb.png (320x180) [95.4 KB] || New_Trebuchet_mkII.00300_print_thm.png (80x40) [6.2 KB] || New_Trebuchet_mkII.mp4 (1920x1080) [32.4 MB] || New_Trebuchet_mkII.webm (1920x1080) [3.7 MB] || New_Trebuchet_mkII.mov (1920x1080) [443.3 MB] ||
Other Heliophysics Missions
Parker Solar Probe, SOHO, MMS, and others in the Heliophysics fleet
Parker Solar Probe's WISPR Images Inside The Sun's Atmosphere
Go to this pageFor the first time in history, a spacecraft has touched the Sun. NASA’s Parker Solar Probe has now flown through the Sun’s upper atmosphere – the corona – and sampled particles and magnetic fields there. As Parker Solar Probe flew through the corona, its WISPR instrument captured images.The Wide-Field Imager for Parker Solar Probe (WISPR) is the only imaging instrument aboard the spacecraft. WISPR looks at the large-scale structure of the corona and solar wind before the spacecraft flies through it. About the size of a shoebox, WISPR takes images from afar of structures like coronal mass ejections, or CMEs, jets and other ejecta from the Sun. These structures travel out from the Sun and eventually overtake the spacecraft, where the spacecraft’s other instruments take in-situ measurements. WISPR helps link what’s happening in the large-scale coronal structure to the detailed physical measurements being captured directly in the near-Sun environment.To image the solar atmosphere, WISPR uses the heat shield to block most of the Sun’s light, which would otherwise obscure the much fainter corona. Specially designed baffles and occulters reflect and absorb the residual stray light that has been reflected or diffracted off the edge of the heat shield or other parts of the spacecraft.WISPR uses two cameras with radiation-hardened Active Pixel Sensor CMOS detectors. These detectors are used in place of traditional CCDs because they are lighter and use less power. They are also less susceptible to effects of radiation damage from cosmic rays and other high-energy particles, which are a big concern close to the Sun. The camera’s lenses are made of a radiation hard BK7, a common type of glass used for space telescopes, which is also sufficiently hardened against the impacts of dust.WISPR was designed and developed by the Solar and Heliophysics Physics Branch at the Naval Research Laboratory in Washington, D.C. (principal investigator Russell Howard), which will also develop the observing program. ||
The Many Eyes on the Parker Solar Probe Perihelion (February 2022)
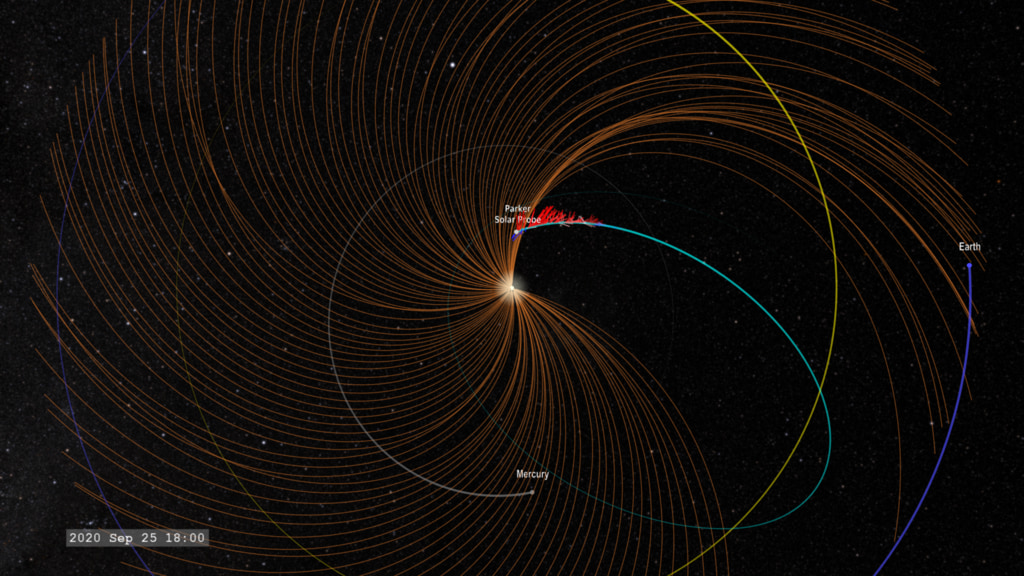
Go to this pageThis visualization opens with a top-down view, then transtions to an oblique view of the inner solar system with the various solar-observing missions conducting coordinated observations of the plasma environment. This version displays the imaging instrument camera frustums and solar magnetic field alignments - the 'glyph' version. A version with just the orbits, no 'glyphs' is available in the [Download Options] menu. || SolarSynergiesPlus.Encounter2022FebTop2Side.HAE.AU.glyphs_CRTT.HD1080.01300_print.jpg (1024x576) [123.3 KB] || SolarSynergiesPlus.Encounter2022FebTop2Side.HAE.AU.glyphs_CRTT.HD1080.01300_searchweb.png (320x180) [78.9 KB] || SolarSynergiesPlus.Encounter2022FebTop2Side.HAE.AU.glyphs_CRTT.HD1080.01300_thm.png (80x40) [5.2 KB] || Encounter2022FebTop2Side (1920x1080) [0 Item(s)] || Encounter2022FebTop2Side.glyphs (1920x1080) [0 Item(s)] || SolarSynergiesPlus.Encounter2022FebTop2Side.HD1080_p30.mp4 (1920x1080) [47.0 MB] || SolarSynergiesPlus.Encounter2022FebTop2Side.glyphs.HD1080_p30.mp4 (1920x1080) [60.7 MB] || SolarSynergiesPlus.Encounter2022FebTop2Side.HD1080_p30.webm (1920x1080) [9.7 MB] || Encounter2022FebTop2Side (3840x2160) [0 Item(s)] || Encounter2022FebTop2Side.glyphs (3840x2160) [0 Item(s)] || SolarSynergiesPlus.Encounter2022FebTop2Side.UHD2160_p30.mp4 (3840x2160) [143.6 MB] || SolarSynergiesPlus.Encounter2022FebTop2Side.glyphs.UHD2160_p30.mp4 (3840x2160) [176.4 MB] || SolarSynergiesPlus.Encounter2022FebTop2Side.HD1080_p30.mp4.hwshow [220 bytes] ||
Parker Solar Probe: The Origins of Switchbacks
Go to this pageMost of the magnetic field measured at Parker during this time is directed sunward (blue field lines and vectors). A switchback occurs when the field changes direction almost 180 degrees for a short period of time. FIELDS instrument magnetic vector data are projected from the spacecraft position as arrows. The arrows are colored deep blue for sunward vectors, deep red for anti-sunward, and in between for directions off from this line. The heliospheric magnetic field lines are represented as gold. || ParkerSP.ChaseCloseupAft.Switchbacks20181106A.FIELDS.clockSlate_EarthTarget.HD1080.00990_print.jpg (1024x576) [114.9 KB] || ParkerSP.ChaseCloseupAft.Switchbacks20181106A.FIELDS.clockSlate_EarthTarget.HD1080.00990_searchweb.png (320x180) [71.7 KB] || ParkerSP.ChaseCloseupAft.Switchbacks20181106A.FIELDS.clockSlate_EarthTarget.HD1080.00990_thm.png (80x40) [4.5 KB] || Switchbacks20181106A (1920x1080) [0 Item(s)] || ParkerSP.ChaseCloseupAft.Switchbacks20181106A.FIELDS.HD1080_p30.mp4 (1920x1080) [25.7 MB] || ParkerSP.ChaseCloseupAft.Switchbacks20181106A.FIELDS.HD1080_p30.webm (1920x1080) [4.4 MB] || Switchbacks20181106A (3840x2160) [0 Item(s)] || ParkerSP.ChaseCloseupAft.Switchbacks20181106A.FIELDS.UHD3840_2160p30.mp4 (3840x2160) [100.2 MB] || ParkerSP.ChaseCloseupAft.Switchbacks20181106A.FIELDS.HD1080_p30.mp4.hwshow [229 bytes] ||
Halloween 2003 Solar Storms: SOHO/EIT and SOHO/LASCO
Go to this pageHere is a view of the solar disk in 195 Å ultraviolet light (colored green in this movie) and the Sun's extended atmosphere, or corona, (blue and white in this movie). The corona is visible to the SOHO/LASCO coronagraph instruments, which block the bright disk of the Sun so the significantly fainter corona can be seen. In this movie, the inner coronagraph (designated C2) is combined with the outer coronagraph (C3). This movie covers a two week period in October and November 2003 which exhibited some of the largest solar activity events since the advent of space-based solar observing.As the movie plays, we can observe a number of features of the active Sun. Long streamers radiate outward from the Sun and wave gently due to their interaction with the solar wind. The bright white regions are visible due to their high density of free electrons which scatter the light from the photosphere towards the observer. Protons and other ionized atoms are there as well, but are not as visible since they do not interact with photons as strongly as electrons. Coronal Mass Ejections (CMEs) are occasionally observed launching from the Sun. Some of these launch particle events which can saturate the cameras with snow-like artifacts.Also visible in the coronagraphs are stars and planets. Stars are seen to drift slowly to the right, carried by the relative motion of the Sun and the Earth. The planet Mercury is visible as the bright point moving left of the Sun. The horizontal 'extension' in the image is called 'blooming' and is due to a charge leakage along the readout wires in the CCD imager in the camera.This movie is part of a series of movies with matching cadence designed to play synchronously with each other. The other movies in this series are Halloween 2003 Solar Storms: SOHO/EIT Ultraviolet, 195 angstromHalloween 2003 Solar Storms: SOHO/EIT Ultraviolet, 304 angstromHalloween 2003 Solar Storms: SOHO/MDI Continuum Halloween 2003 Solar Storms: SOHO/MDI Magnetograms For more information, visit the SOHO project page.. ||
STEREO-A Returns by Earth
Go to this pageThe Solar Terrestrial Relations Observatory (STEREO) mission was launched on October 25, 2006, with the purpose of tracing the flow of energy and matter from the Sun to Earth. The STEREO mission began with two spacecraft: STEREO-A and STEREO-B. Each was launched into Sun-orbiting trajectories - STEREO-A moving ahead of Earth, and STEREO-B moving behind Earth (STEREO's Routes to Solar Orbits). In mid-August 2023, the still-operational STEREO-A (STEREO-B went offline in October 2014) will pass Earth for the first time since its launch 17 years ago. Like race cars driving different speeds around a circular track, STEREO-A is traveling slightly faster than Earth around the Sun. After launch, STEREO-A pulled ahead of Earth and extended its lead a little bit more with each orbit. Now, STEREO-A’s lead is so great that it is catching up to Earth from behind and is about to “lap” Earth, having completed 18 circuits around the Sun while Earth completed just 17. ||
The Solar Polar Magnetic Field
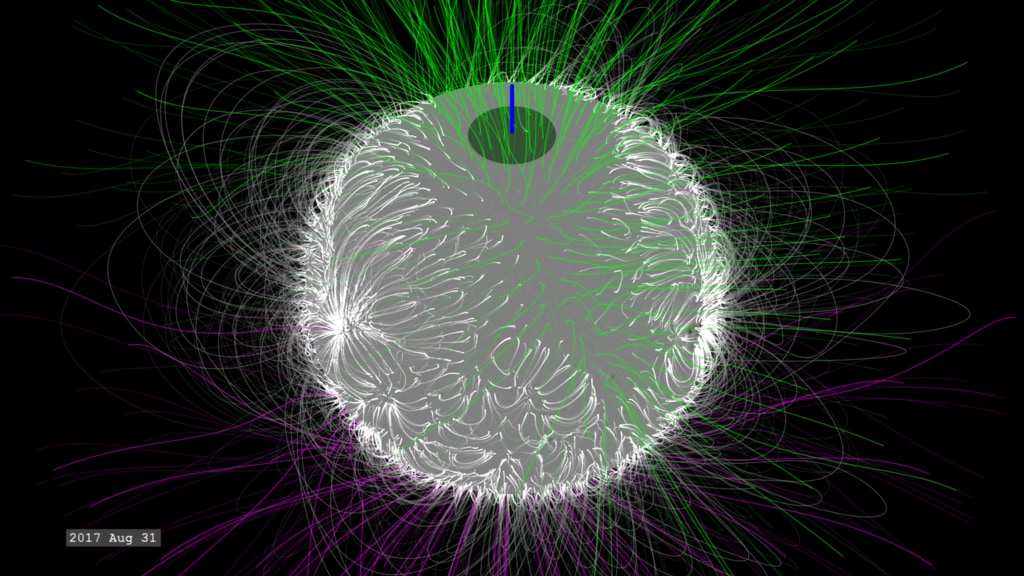
Go to this pageFrom our single vantage point of Earth, our view of the Sun is never complete. While the far-side of the Sun eventually rotates into view, coverage of the Sun's polar regions is never satisfactory as perspective effects either completely block our view or create a distorted view. We must often resort to computer modeling of these solar polar regions.This visualization presents the Potential Field Source Surface (PFSS) magnetic field model based on solar observations covering the years 2017-2019. One version also presents the 'hole' in our measurements of the solar polar region. The region oscillates in size over the course of the year due to the changing perspective created by the tilt of Earth's orbital plane with the solar equator. In this region, researchers must resort to approximations to build a more complete view of the solar magnetic field.Why is the solar magnetic field in this region important? Because the combined with the outgoing flow of the solar wind, the magnetic field lines from the polar regions curve up, and then back down to near the Sun's equatorial plane, which is still fairly close to the orbital plane of Earth and other planets in our solar system. This gives the Sun's polar magnetic field a significant influence on the space weather impacting Earth and crewed and uncrewed assets around the solar system. ||
MMS Sees a New Type of Reconnection
Go to this pageThe Magnetospheric Multiscale (MMS) mission consists of four identical satellites that traverse various regions of Earth's magnetosphere measuring the particles and electric and magnetic field which influence them.In the turbulent plasma between Earth's magnetopause and bow shock, a region called the magnetosheath, the MMS satellite constellation has measured multiple jets of energetic electrons between magnetic bubbles. This appears to be a new 'flavor' of magnetic reconnection based on electrons and occuring on smaller time and spatial scales than the standard model of magnetic reconnection with ions.In these data visualizations, the arrows represent the data collected by the spacecraft. To better comprehend changes as the spacecraft moves along, the data are allowed to 'echo' along the spacecraft trail. The length of the vectors represent the relative magnitude of the vector. However, the electron and proton vectors are scaled so equal velocities correspond to vectors of equal magnitude.Magenta represents the direction and magnitude of the magnetic field at the spacecraft position.Green represents the direction and magnitude of the net electric current created by the motion of the electrons and ions measured at the spacecraft position.The four MMS spacecraft are represented by colored spheres, corresponding to the plotted data lines in the lower graphicMMS1MMS2MMS3MMS4The clocks on MMS are synchronized for the TAI (International Atomic Time) system provided through the Global Positioning System (GPS) satellites. It provides a high-precision time reference for comparing MMS measurements to other datasets. ||
THEMIS/ASI Nights - High Resolution
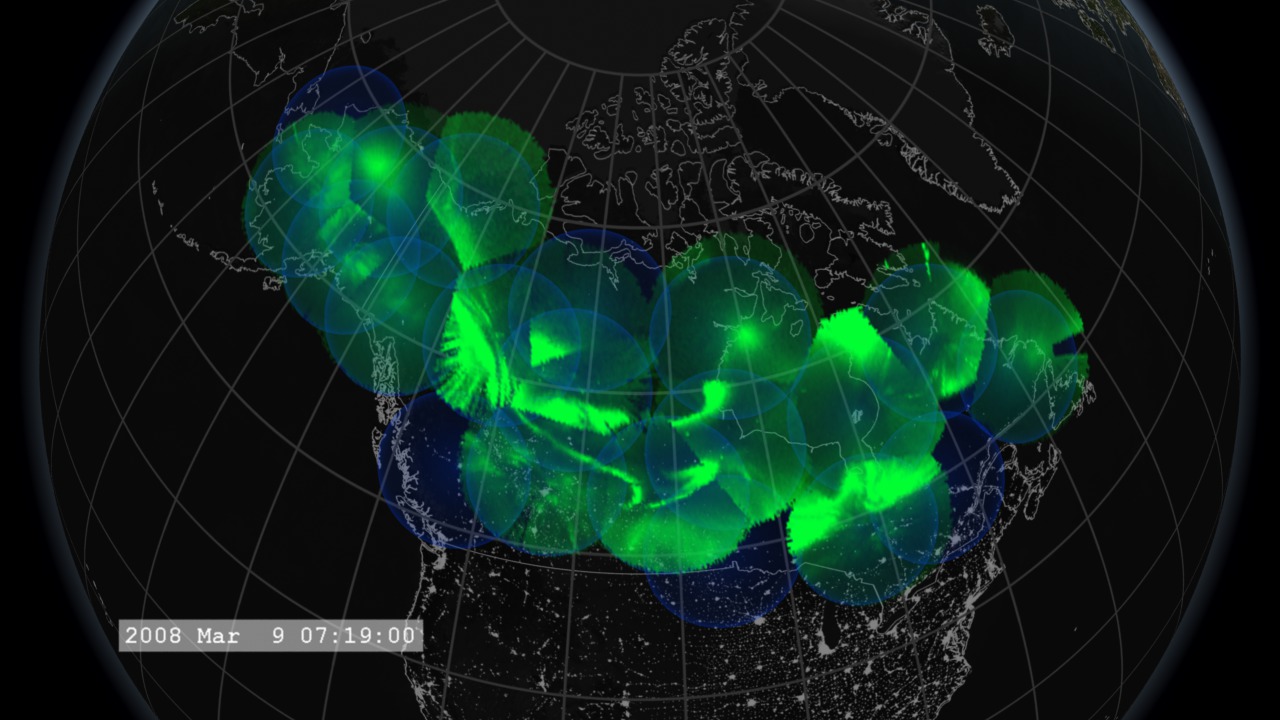
Go to this pageA collection of ground-based All-Sky Imagers (ASI) makes an important component of the THEMIS mission in understanding the interaction of the magnetosphere and aurora. It is sometimes referred to as the sixth THEMIS satellite. Descriptions of the instruments are available on the THEMIS-Canada Home Page. Imagery from each camera is co-registered to the surface of the Earth and assembled into a view of the auroral events. This movie presents data from the first large auroral substorm since the THEMIS launch. The substorm reached its maximum between 6:00 and 7:00 UT. Note that the ASI data in this movie are assembled from significantly higher resolution datesets than the earlier version, THEMIS/ASI Nights. The higher resolution enables you to see much finer details in the aurora structure. In addition, one notices trees circling the horizon visible to the cameras located in western Canada. ||
Space Weather
Solar flares, coronal mass ejections, as well as their effects and interactions (needs a better description)
How Do Space Weather Effects & Solar Storms Affect Earth?
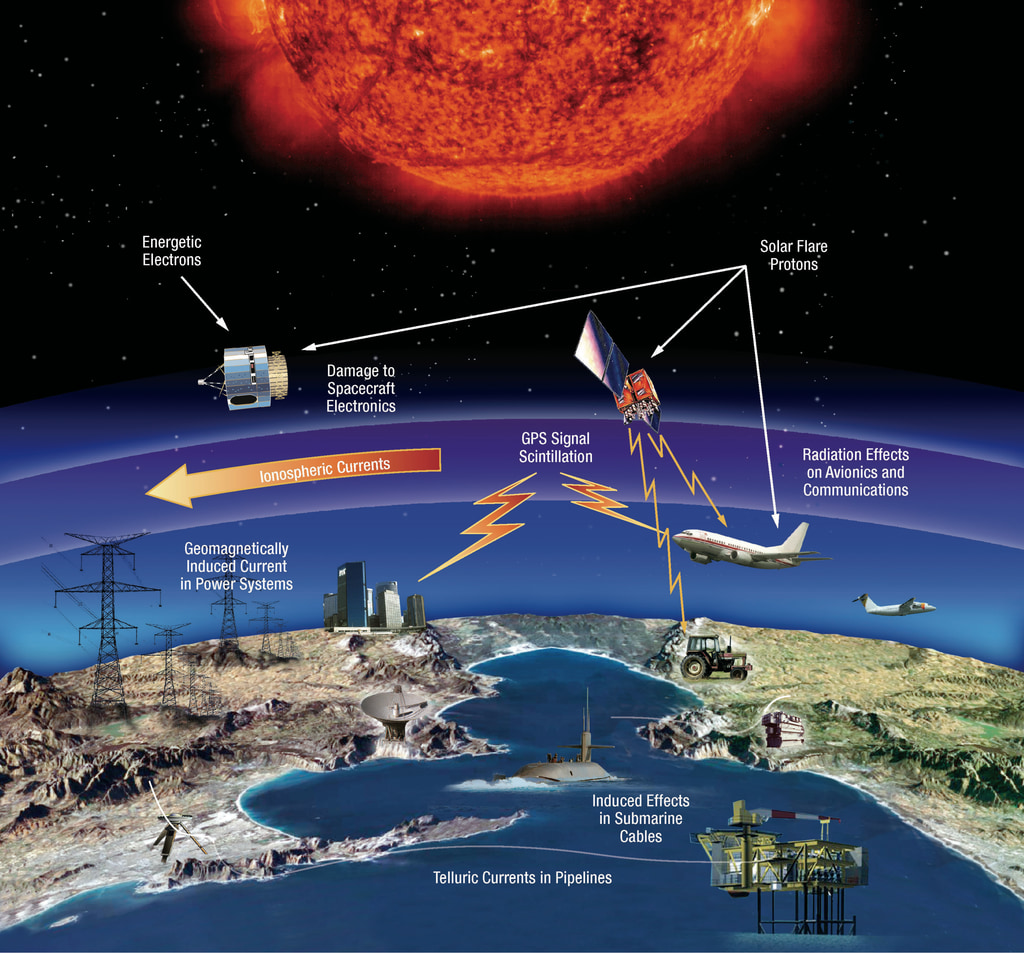
Go to this pageTechnological and infrastructure affected by space weather events. || space-weather-effects_print.jpg (1024x953) [307.6 KB] || space-weather-effects.png (3480x3240) [8.3 MB] || space-weather-effects_searchweb.png (320x180) [77.3 KB] || space-weather-effects_thm.png (80x40) [6.2 KB] || how-do-space-weather-effects-solar-storms-affect-earth.hwshow [320 bytes] ||
ISS Timelapse: Aurora Australis
Go to this pageThe photographs used to make this video were taken on September 17, 2011 from 17:22:27 to 17:37:21 GMT from the International Space Station (ISS). This image sequence begins over the Indian Ocean halfway between Madagascar and Antarctica. Aurora Australis is present for the first 2/3rds of the video, then Australis comes into view. Yellow lights near the coast show the presence of cities, while interior oragne lights indicate brush fires.http://eol.jsc.nasa.gov ||
Animation: Heliosphere
Go to this pageThe sun sends out a constant flow of charged particles called the solar wind, which ultimately travels past all the planets to some three times the distance to Pluto before being impeded by the interstellar medium. This forms a giant bubble around the sun and its planets, known as the heliosphere. NASA studies the heliosphere to better understand the fundamental physics of the space surrounding us - which, in turn, provides information regarding space throughout the rest of the universe, as well as regarding what makes planets habitable.The solar wind is a gas of charged particles known as plasma, a state of matter governed by its own set physical laws just as the more common solids, liquids, and gases are. As the solar wind sweeps out into space, it creates a space environment filled with radiation as well as magnetic fields that trail all the way back to the sun. This space environment is augmented by interstellar cosmic rays and occasional concentrated clouds of solar material that burst off the sun, known as coronal mass ejections.This complex environment surrounds the planets and ultimately has a crucial effect on the formation, evolution, and destiny of planetary systems. For one thing, our heliosphere acts as a giant shield, protecting the planets from galactic cosmic radiation. Earth is additionally shielded by its own magnetic field, the magnetosphere, which protects us not only from solar and cosmic particle radiation but also from erosion of the atmosphere by the solar wind. Planets without a shielding magnetic field, such as Mars and Venus, are exposed to such processes and have evolved differently.NASA's studies of the heliosphere include research into: how the solar wind behaves near Earth; what causes and sustains magnetic and electric fields around other planets; how does the heliosphere interact with the interstellar medium; what do the boundaries of the heliosphere look like; what is the origin and evolution of the solar wind and the interstellar cosmic rays; and what contributes to the habitability of exoplanets.The field is, therefore, intensely cross-disciplinary. Heliospheric research often works hand in hand with planetary scientists, astrophysicists, astrobiologists, and space weather researchers.NASA heliophysics missions contributing to heliospheric research are: the Advanced Composition Explorer; NOAA's Deep Space Climate Observatory, the Interstellar Boundary Explorer, the Solar Terrestrial Relations Observatory; Voyager, and Wind. ||
Earth's Magnetism In Action
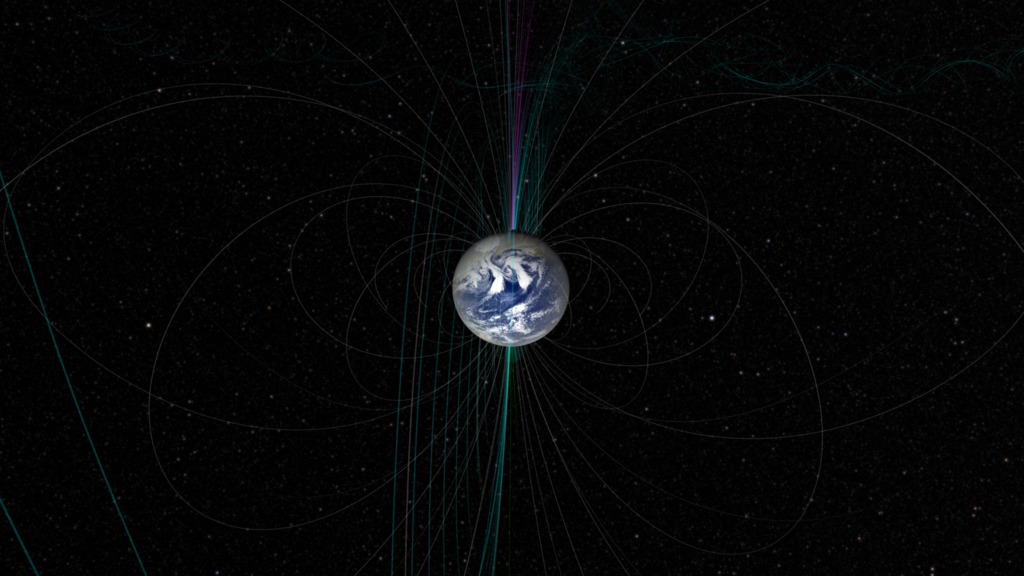
Go to this pageScientists make a breakthrough in observing the dynamic magnetic system surrounding our planet. || c-1024.jpg (1024x576) [385.4 KB] || c-1280.jpg (1280x720) [576.4 KB] || c-1024_print.jpg (1024x576) [403.6 KB] || c-1024_searchweb.png (320x180) [137.4 KB] || c-1024_web.png (320x180) [137.4 KB] || c-1024_thm.png (80x40) [24.5 KB] ||
Geomagnetic and Atmospheric Response to May 2024 Solar Storm
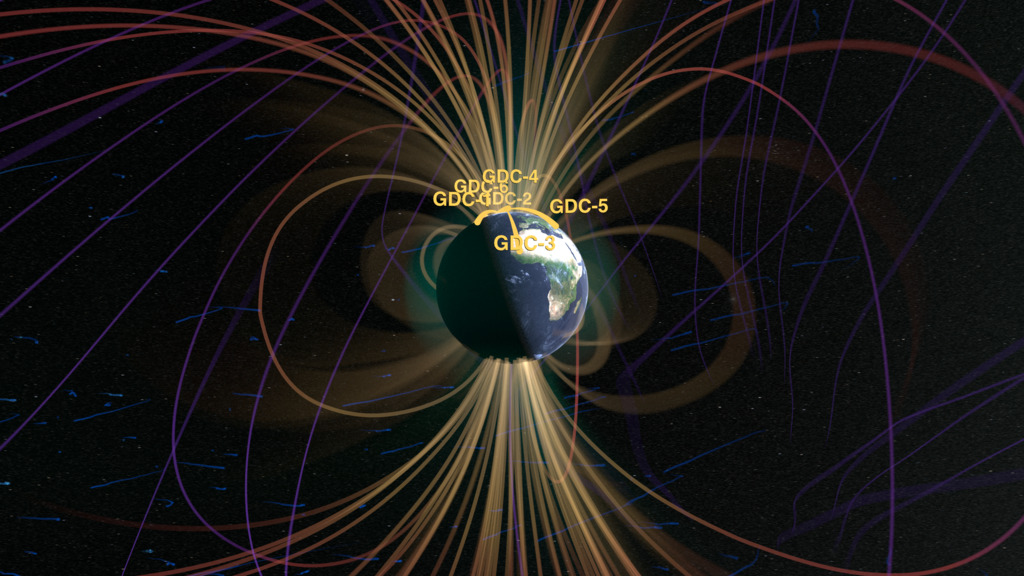
Go to this pageThis visualization shows the Earth's magnetosphere being hit by a geomagnetic storm. The MAGE model simulates real events that happened throughout May 10-11, 2024.White orbit trails: All satellites orbiting Earth during the stormOrange orbits: Proposed orbits for six GDC spacecraftOrange-to-purple lines: Magnetic field lines around EarthBlue trails: Solar wind velocity tracersGreen clouds: Electric field current intensityCredit:NASA Scientific Visualization Studio and NASA DRIVE Science Center for Geospace Storms || multiField_11-25-2024b_magnetosphere_pc_anim_satellites_4k.00450_print.jpg (1024x576) [191.2 KB] || multiField_11-25-2024b_magnetosphere_pc_anim_satellites_4k.00450_searchweb.png (320x180) [102.0 KB] || multiField_11-25-2024b_magnetosphere_pc_anim_satellites_4k.00450_web.png (320x180) [102.0 KB] || multiField_11-25-2024b_magnetosphere_pc_anim_satellites_4k.00450_thm.png (80x40) [6.4 KB] || multiField_12-30-2024b_magnetosphere_pc_anim_satellites_1080p30.mp4 (1920x1080) [253.6 MB] || multiField_12-30-2024b_magnetosphere_pc_anim_satellites_3x3Hyperwall (5760x3240) [2880 Item(s)] || multiField_12-30-2024b_magnetosphere_pc_anim_satellites_3x3Hyperwall_2160p30.mp4 (3840x2160) [773.4 MB] || multiField_12-30-2024b_magnetosphere_pc_anim_satellites_3x3Hyperwall_3240p30_h265.mp4 (5760x3240) [779.4 MB] ||
Carrington-Class Event
Visualizations relating to a very large and very fast coronal mass ejection in July 2012
Comparative Magnetospheres: A Carrington-Class CME
Go to this pageIn an effort to understand and predict the impact of space weather events on Earth, the Community-Coordinated Modeling Center (CCMC) at NASA Goddard Space Flight Center, routinely runs computer models of the many historical events. These model runs are then compared to actual data to determine ways to improve the model, and therefore forecasts of the impacts of future space weather events.But sometimes we don't have an actual event where we have lots of data for comparison. Extreme space weather events are one example where we must test models with a rather limited set of data.This is a model run used to examine the consequences if a large coronal mass ejection (CME) such as The Carrington-Class CME of 2012 had actual hit Earth. Such model runs allow us to estimate consequences of a large event hitting Earth so we can better protect power grids and satellites.Some of the conclusions from this model run are (documented in the paper linked below):The magnetopause is compressed to the point it is moved inside the orbits of our geosynchronous satellites.Large field-aligned currents are created on the night-side of Earth, generating large ionospheric potentials.At high latitudes, geo-electric fields of 26 volts per kilometer can be generated.For comparison, the geo-electric field of the March 1989 storm which generated an extensive power outage in Canada (Wikipedia) had a value of only about 6 volts per kilometer; and the 2003 Halloween solar storms (see Halloween Solar Storms 2003) generated a field of about 12 volts per kilometer. ||
Comparative Magnetospheres: A Noteworthy Coronal Mass Ejection
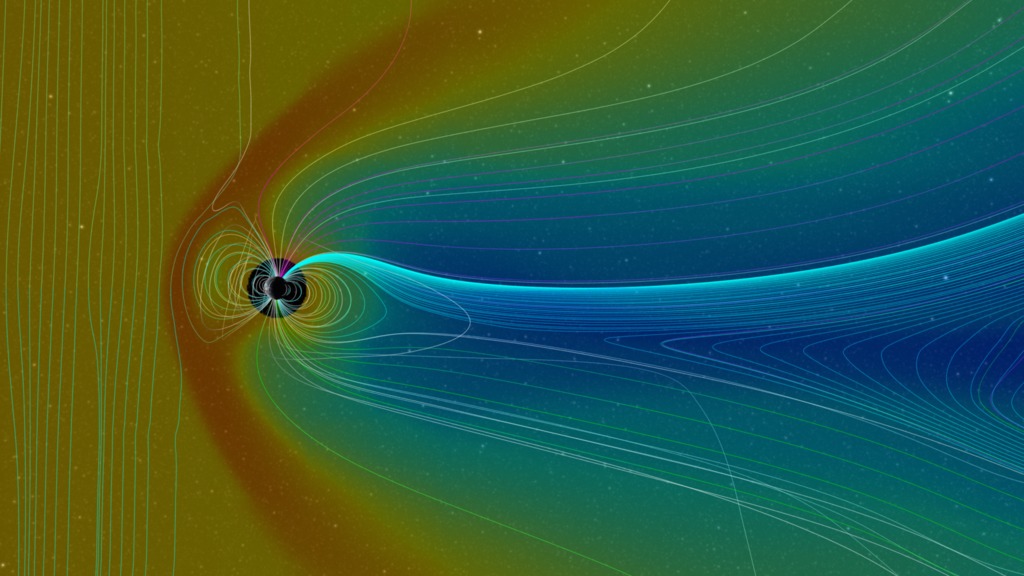
Go to this pageIn an effort to understand and predict the impact of space weather events on Earth, the Community-Coordinated Modeling Center (CCMC) at NASA Goddard Space Flight Center, routinely runs computer models of the many historical events. These model runs are then compared to actual data to determine ways to improve the model, and therefore forecasts of the impacts of future space weather events.In mid-December of 2006, the Sun erupted with a bright flare and coronal mass ejection (CME) that launched particles Earthward. While not the brightest or largest event observed, its impact on Earth was substantial, requiring some effort to protect satellites (ESA: Reacting to a solar flare).The visualization presented here is a CCMC run of a BATS-R-US model simulating the impact of this event on Earth. Here, lines are used to represent the 'flow direction' of magnetic field of the solar wind impacting Earth, as well as the effects on Earth's geomagnetic field. A 'cut-plane' through the data illustrates the changes in the particle density in the solar wind and magnetosphere. The color of the data represents a logarithmic scaling of density, with red as the highest (1000 particles per cubic centimeter) down to blue (0.01 particles per cubic centimeter). In this simulation, each frame of the movie corresponds to two minutes of real time.In the movie, we see vertical field lines of magnetic field carried by the solar wind, coming in from the left. As this field, and the plasma carrying it, strike Earth's magnetic field, they bend and reconnect, around the Earth. Some field lines actually reconnect to the polar regions of the Earth, providing a ready flow-path for particles to reach the ionosphere and generate aurora. This interaction between the solar wind and the plasma trapped in Earth's magnetosphere also creates a density enhancement between Earth and the solar wind helping to shield Earth from some of the effects. A lower density wake forms behind Earth (the blue region). There is a circular 'hole' around the Earth which is a gap in the model. ||
The Big CME that Missed Earth
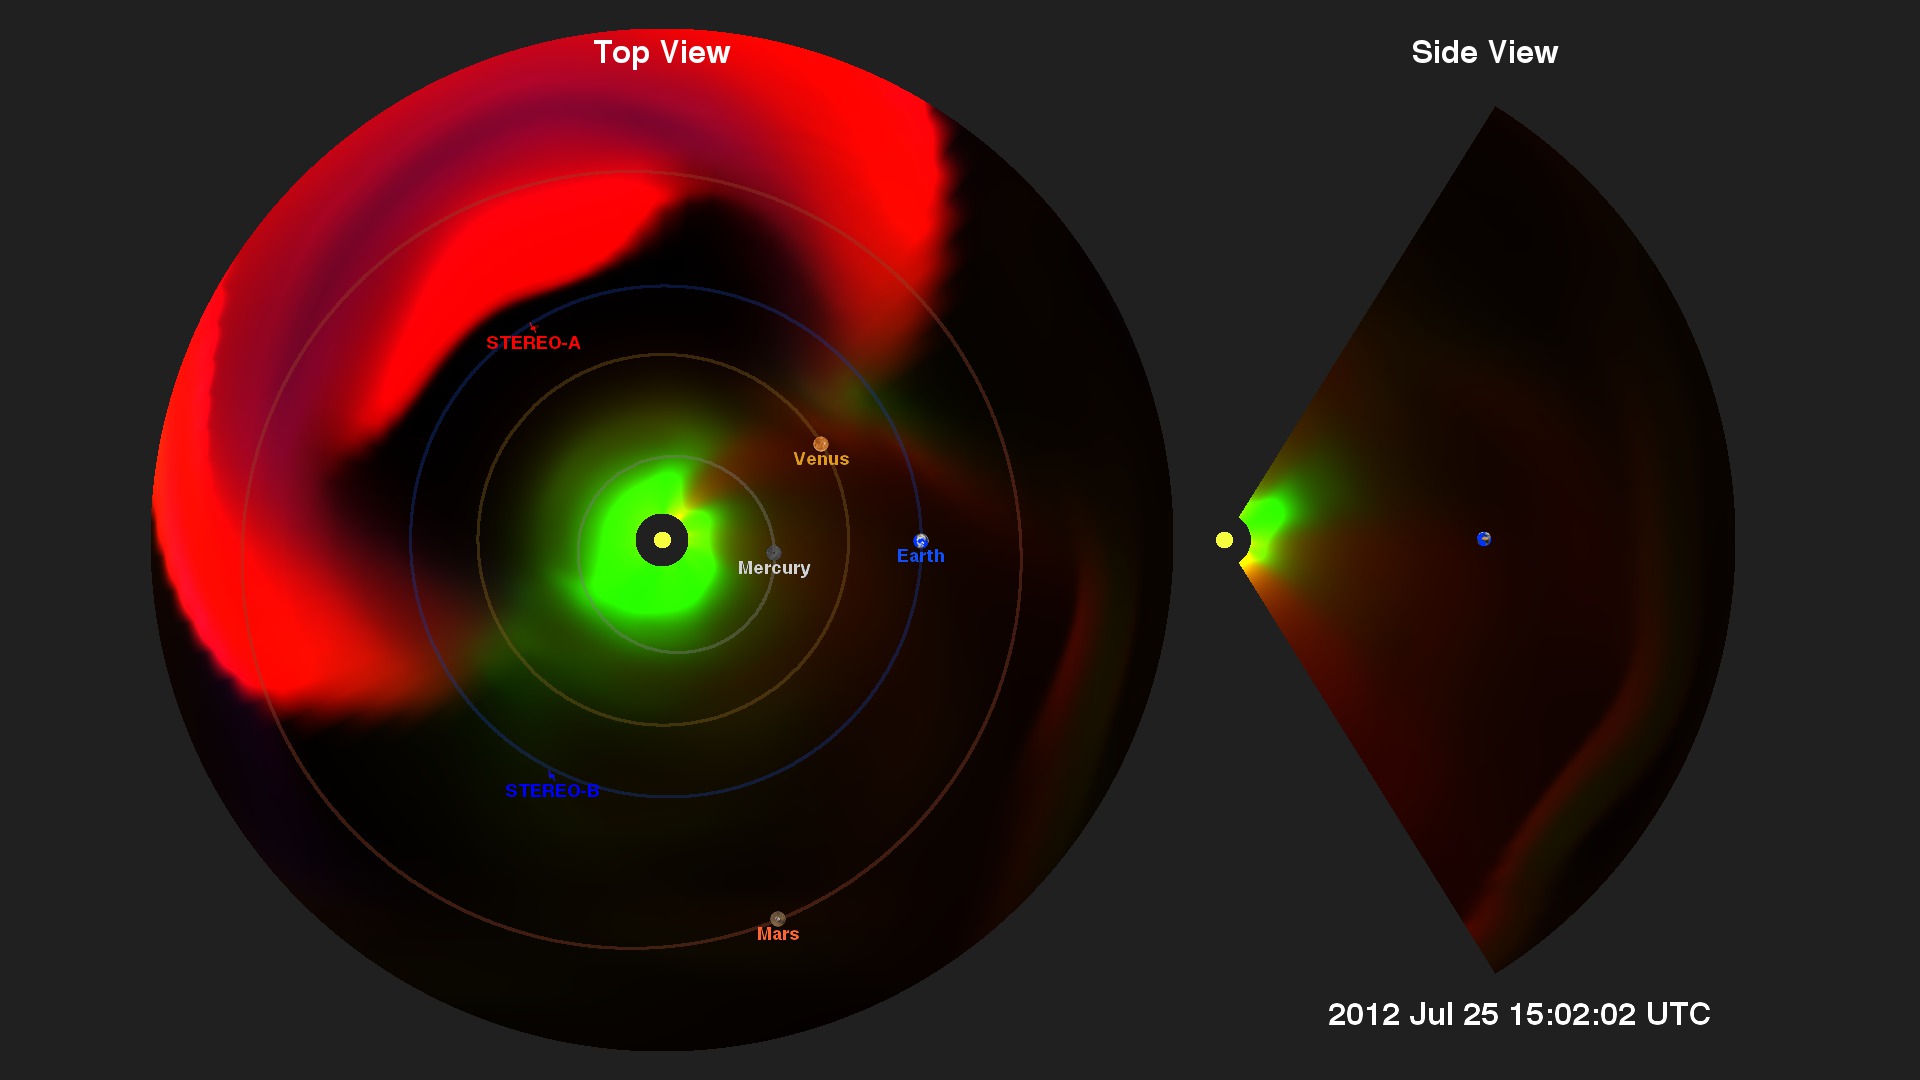
Go to this pageJuly of 2012 witnessed the eruption of a very large and fast solar coronal mass ejection (CME) (see NASA STEREO Observes One of the Fastest CMEs On Record and Carrington-class CME Narrowly Misses Earth ). While not directed at Earth, it was sufficiently large that it could have seriously disrupted the global electrical infrastructure. The event did impact STEREO-A of NASA's heliophysics fleet which provided a host of measurements (see Sentinels of the Heliosphere).One of the conditions which contributed to the high speed of this event is that two smaller CMEs were launched a little earlier, and these events cleared out much of the solar wind material, leaving little to slow the outflow of the July 23 event (UTC).In the visualizations below, generated from the Enlil space weather model, green represents particle density, usually protons and other ions. In green, we see the Parker spiral moving out from the sun generated by the sun's current sheet (Wikipedia). Red represents particles at high temperatures and shows the CME is hotter than the usual solar wind flow. Large changes in density are represented in blue. These three colors sometimes combine to tell us more about the characteristics of the event (noted in the 3-color Venn diagram below).However, if this CME had struck Earth's magnetosphere, which has a much stronger magnetic field, the changing magnetic field would induce much larger voltages in systems with long electrical conductors, such as power lines that run over long distances. These significantly higher voltages can damage power transformers. ||
Transits
Mercury Transit, 2019 (SDO 4K imagery)
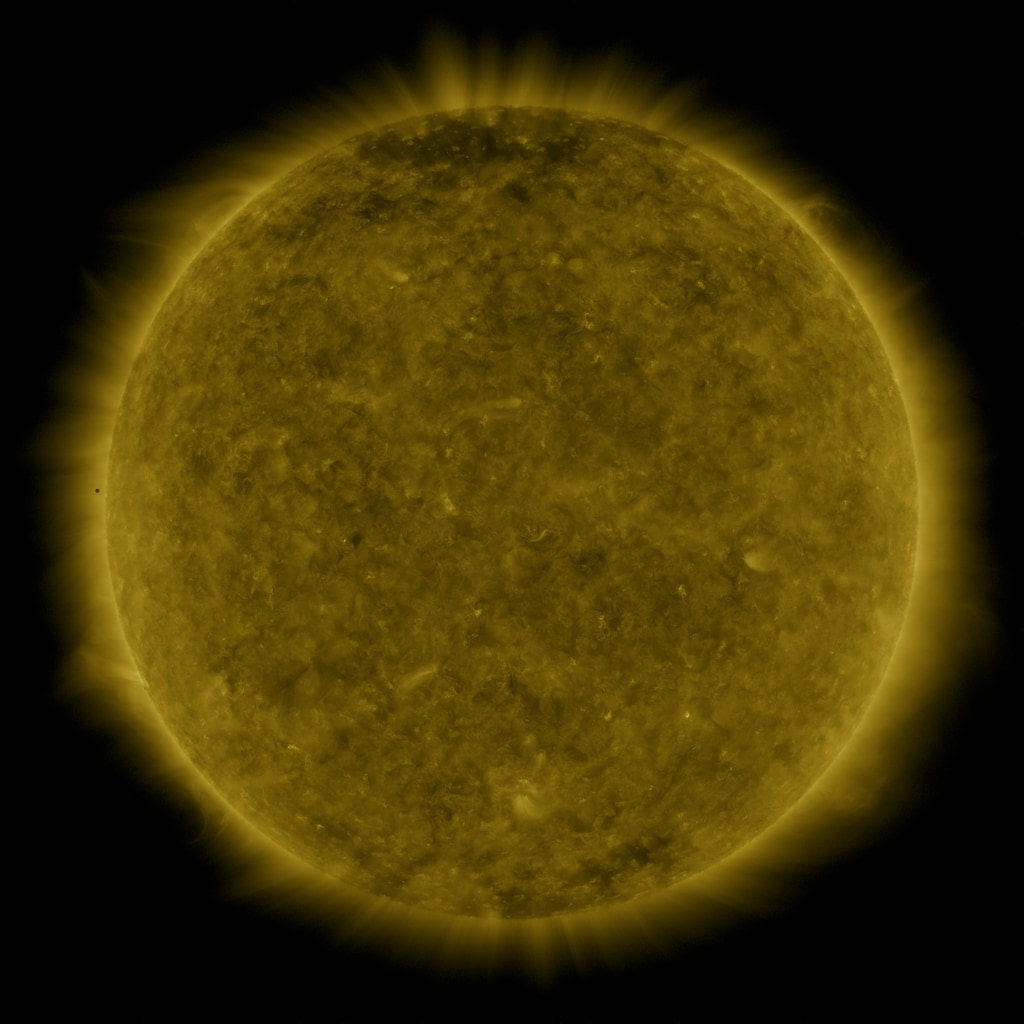
Go to this pageMercury transit visible through the 171 angstrom filter on SDO. || AIA171_00025_print.jpg (1024x1024) [108.7 KB] || AIA171_00025_searchweb.png (320x180) [65.6 KB] || AIA171_00025_thm.png (80x40) [5.2 KB] || AIA171_2048p30.mp4 (2048x2048) [19.2 MB] || AIA171_1024p30.mp4 (1024x1024) [3.7 MB] || AIA171-Frames (4096x4096) [0 Item(s)] || AIA171-Time (4096x4096) [0 Item(s)] || AIA171_4096p30_h265.mp4 (4096x4096) [13.6 MB] || AIA171_4096p30_h265.webm (4096x4096) [2.7 MB] ||



![Music Credit: “Corals Instrumental” by Marc Burh [GEMA], Marek Nichel [GEMA] via Universal Production MusicAdditional photographs and footage: Unsplash, Videvo](/vis/a010000/a014500/a014557/14557_EclipsePhotoTips_Thumbnail.png)











![This visualization opens with a top-down view, then transtions to an oblique view of the inner solar system with the various solar-observing missions conducting coordinated observations of the plasma environment. This version displays the imaging instrument camera frustums and solar magnetic field alignments - the 'glyph' version. A version with just the orbits, no 'glyphs' is available in the [Download Options] menu.](/vis/a000000/a004900/a004970/SolarSynergiesPlus.Encounter2022FebTop2Side.HAE.AU.glyphs_CRTT.HD1080.01300_print.jpg)
