NASA Measures the Ice Sheets
Overview
This is a collection of some of NASA’s most recent data visualizations relating to the mass balance of the Greenland and Antarctic ice sheets, as well as a collection ultra-high definition footage of researchers in Greenland from July of 2015. For a collection of still photos, go here.
Arctic
Greenland Ice Sheet Stratigraphy
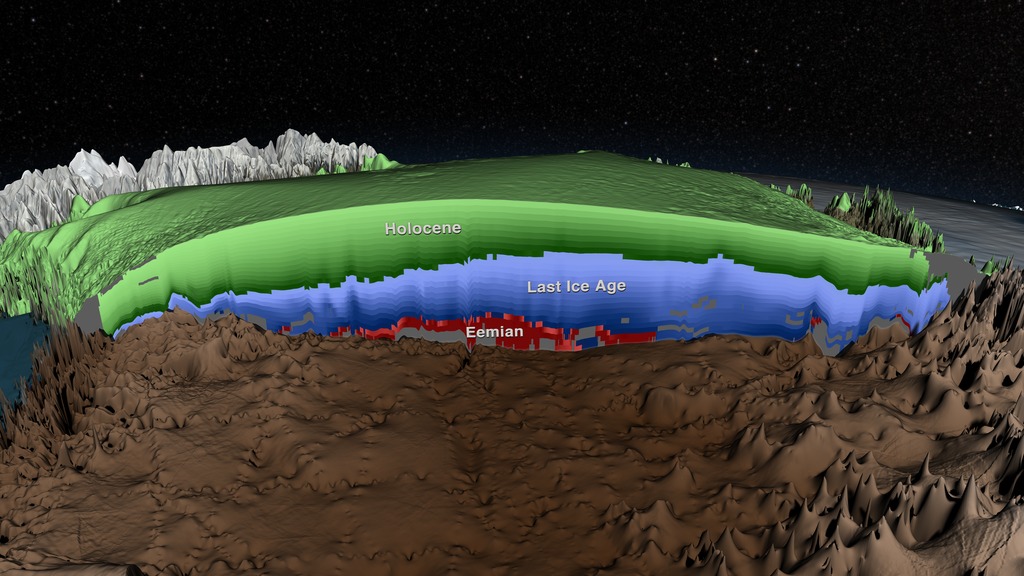
Go to this pageThe above movie shows the new 3D map of the age of the Greenland ice sheet, using a collage of live footage and animation to explain how scientists determined the age from data collected by ice-penetrating radar. The full script of the narration is available here. This video is also available on our YouTube channel. || GIS_age_structure.jpg (1024x576) [166.8 KB] || 4249_Greenland_Radiostratigraphy_MASTER.webmhd.webm (1080x606) [51.7 MB] || 4249_Greenland_Radiostratigraphy_MASTER_1280x720.wmv (1280x720) [115.8 MB] || 4249_Greenland_Radiostratigraphy_MASTER_appletv.m4v (960x540) [99.6 MB] || 4249_Greenland_Radiostratigraphy_MASTER_appletv_subtitles.m4v (960x540) [99.7 MB] || 4249_Greenland_Radiostratigraphy_MASTER_youtube_hq.mov (1920x1080) [450.8 MB] || 4249_Greenland_Radiostratigraphy_MASTER_ipod_lg.m4v (640x360) [40.0 MB] || 4249_Greenland_Radiostratigraphy.en_US.srt [4.7 KB] || 4249_Greenland_Radiostratigraphy.en_US.vtt [4.7 KB] || 4249_Greenland_Radiostratigraphy_MASTER_nasaportal.mov (640x360) [98.5 MB] || 4249_Greenland_Radiostratigraphy_MASTER_ipod_sm.mp4 (320x240) [21.5 MB] || 4249_Greenland_Radiostratigraphy_MASTER_prores.mov (1920x1080) [6.7 GB] ||
Measuring Elevation Changes on the Greenland Ice Sheet
Go to this pageSince the late 1970's, NASA has been monitoring changes in the Greenland Ice Sheet. Recent analysis of seven years of surface elevation readings from NASA's ICESat satellite and four years of laser and and ice-penetrating radar data from NASA's airborne mission Operation IceBridge shows us how the surface elevation of the ice sheet has changed.The colors shown on the surface of the ice sheet represent the accumulated change in elevation since 2003. The light yellow over the central region of the ice sheet indicates a slight thickening due to snow. This accumulation, along with the weight of the ice sheet, pushes ice toward the coast. Thinning near coastal regions, shown in green, blue and purple, has increased over time and now extends into the interior of the ice sheet where the bedrock topography permits. As a result, there has been an average loss of 300 cubic kilometers of ice per year between 2003 and 2012.This animation portrays the changes occurring in the surface elevation of the ice sheet since 2003 in three drainage regions: the southeast, the northeast and the Jakobshavn regions. In each region, the time advances to show the accumulated change in elevation from 2003 through 2012.—><!——><!—Above: Move bar to compare the change in surface elevation (left) to the bedrock topography (right) in the northeast region. Download HTML to embed this in your web page.The ice sheet is cut away to reveal how the bedrock topography beneath the ice sheet affects the movement of glacial ice in each region. The bedrock topography is colored by elevation with areas below sea level shown in brown and areas above sea level shown in green. Yellow indicates regions at sea level. —><!——><!—Above: Move bar to compare the change in the surface elevation (left) to the bedrock topography (right) in the Jakobshavn region. Download HTML to embed this in your web page.The bedrock topography affects the movement of the ice sheet. Blue/white velocity flows indicate the direction and speed of the ice over time. Slower moving ice is shown as shorter blue flow lines while faster moving ice is shown as longer white flow lines. ||
Greenland Ice Flow
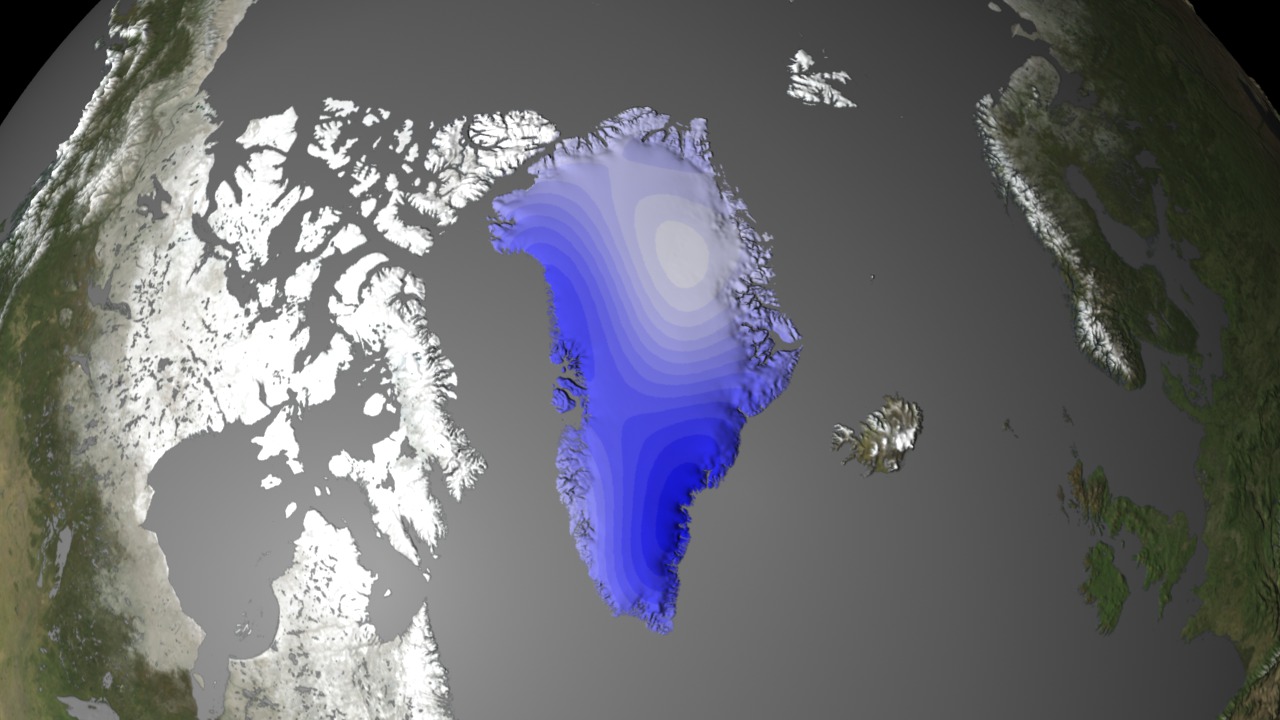
Go to this pageGreenland looks like a big pile of snow seen from space using a regular camera. But satellite radar interferometry helps us detect the motion of ice beneath the snow. Ice starts flowing from the flanks of topographic divides in the interior of the island, and increases in speed toward the coastline where it is channelized along a set of narrow, powerful outlet glaciers. In the east, these glaciers make their sinuous way through complex terrain at low speed. They form long floating extensions that deform slowly in the cold north. As we move toward sectors of higher snowfall in the northwest and center west, ice flow speeds increase by nearly a factor of 10, with many, smaller glaciers flowing straight down to the coastline at several kilometers per year.This complete description of ice motion was only made possible from the coordinated effort of four space agencies: the Japanese Space Agency, the Canadian Space Agency, the European Space Agency, and NASA's Jet Propulsion Laboratory. The data will help scientists improve their understanding of the dynamics of ice in Greenland and in projecting how the Greenland Ice Sheet will respond to climate change in the decades and centuries to come. ||
Greenland's Glaciers as seen by RadarSat
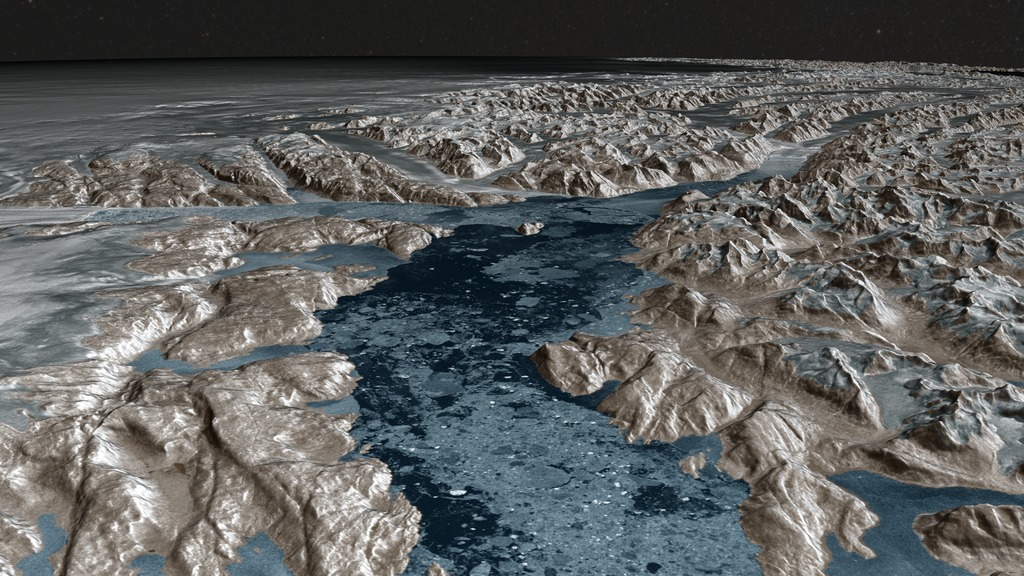
Go to this pageAn animation up the Greenland's Sermilik Fjord to the calving front of the Helheim Glacier, showing the glacier front's change between 2000 to 2013This video is also available on our YouTube channel. || Helheim_radarsat_4k.0800_print.jpg (1024x576) [242.6 KB] || Helheim_radarsat_4k.0800_searchweb.png (180x320) [121.8 KB] || Helheim_radarsat_4k.0800_web.png (320x180) [121.8 KB] || Helheim_radarsat_4k.0800_thm.png (80x40) [7.6 KB] || Helheim_radarsat_4k_1080p30.mp4 (1920x1080) [84.5 MB] || Helheim_radarsat_4k_720p30.mp4 (1280x720) [43.3 MB] || Helheim_radarsat_4k_2160p30.webm (3840x2160) [16.2 MB] || Helheim (3840x2160) [256.0 KB] || Helheim_radarsat_4k_2160p30.mp4 (3840x2160) [225.6 MB] ||
Sea Level Rise
Go to this pageEarth’s seas are rising, a direct result of a changing climate. Ocean temperatures are increasing, leading to ocean expansion. And as ice sheets and glaciers melt, they add more water. A fleet of increasingly sophisticated instruments deployed by NASA across the oceans, on polar ice and in orbit, reveals significant changes among globally interlocking factors that are driving sea levels higher.
Antarctic
Antarctic Bedrock
Go to this page<!—Above: Move bar to compare the Bedmap1 topography (left) to the Bedmap2 topography (right). Download HTML to embed this in your web page.Since 2009, NASA's mission Operation IceBridge (OIB) has flown aircraft over the Antarctic Ice Sheet carrying laser and ice-penetrating radar instruments to collect data about the surface height, bedrock topography and ice thickness. This visualization highlights the contribution that OIB has made to this important dataset.The topography in this visualization is exaggerated to emphasize the topographic relief. The amount of exaggeration varies based on the viewpoint, from twenty times in distant views down to nine times when near the Pine Island Bay. ||
Antarctic Mass Change from GRACE derived Gravity Observations: Jan 2004 - Jun 2014
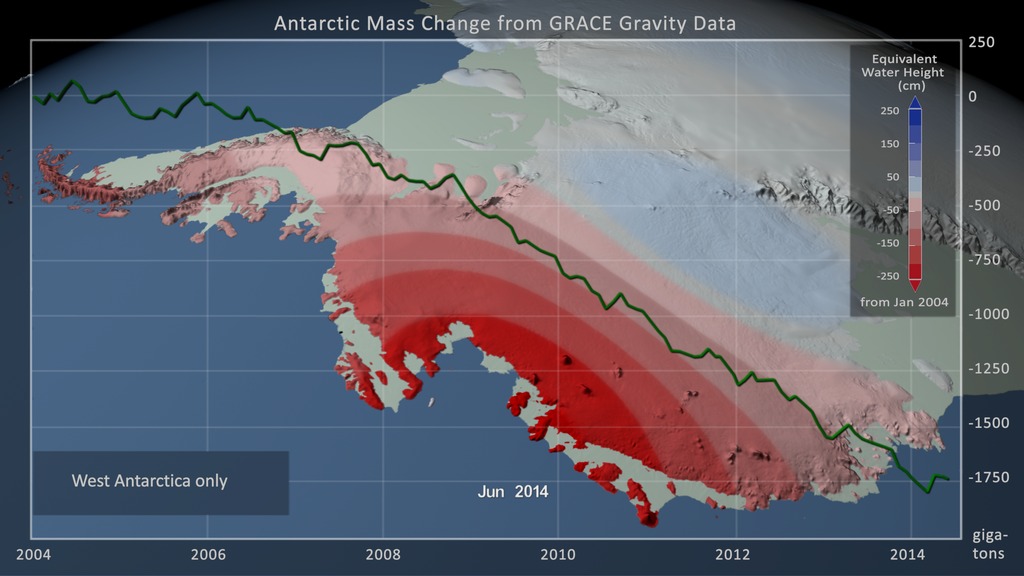
Go to this pageGRACE, NASA's Gravity Recovery and Climate Experiment, consists of twin co-orbiting satellites that fly in a near polar orbit separated by a distance of 220 km. GRACE precisely measures the distance between the two spacecraft in order to make detailed measurements of the Earth's gravitational field. Since its launch in 2002, GRACE has provided a continuous record of changes in the mass of the Earth's ice sheets.These animations show the change in the mass of the Antarctic Ice Sheet between January 2004 and June 2014 as measured by the pair of GRACE satellites. The 1-arc-deg NASA GSFC mascon solution data was resampled to a 5130 x 5130 data array using Kriging interpolation. A color scale was applied where blue values indicate an increase in the ice sheet mass while red shades indicate a decrease. In addition, a graph overlay shows the running total of the accumulated mass change in gigatons.Four separate animations are shown here: one of the full Antarctic Ice Sheet (above) and three of individual regional views (below) showing the regions of West Antarctica, the Antarctic Peninsula and East Antarctica. The time-series of each region is shown with a graph depicting the ice loss for the region alone. Note that the range on the color scale is different for each regional view in order to portray the most detail possible. Areas outside the region being shown are colored in a pale green to indicate that it is not included in the view. The floating ice shelves, shown in a lighter shade of green, are also not included.Technical Note: The glacial isostatic adjustment signal (Earth mass redistribution in response to historical ice loading) has been removed using the ICE-6G model (Peltier et al. 2015). ||
Ice Sheet Mass Balance from GRACE
Go to this pageIn the first comprehensive satellite study of its kind, a University of Colorado Boulder-led team used NASA data to calculate how much Earth's melting land ice is adding to global sea level rise.Using satellite measurements from the NASA/German Aerospace Center Gravity Recovery and Climate Experiment (GRACE), the researchers measured ice loss in all of Earth's land ice between 2003 and 2010, with particular emphasis on glaciers and ice caps outside of Greenland and Antarctica. The total global ice mass lost from Greenland, Antarctica and all Earth's glaciers and ice caps over the period studied was about 4.3 trillion tons (1,000 cubic miles), adding about 12 millimeters (0.5 inches) to global sea level. That's enough ice to cover the United States 1.5 feet (0.5 meters) deep. About a quarter of the average annual ice loss came from glaciers and ice caps outside of Greenland and Antarctica (about 148 billion tons, or 39 cubic miles), while ice loss from Greenland and Antarctica and their peripheral ice caps and glaciers averaged roughly 385 billion tons (100 cubic miles) a year. Results of the study are published online Feb. 8 in the journal Nature."Earth is losing a huge amount of ice to the ocean annually, and these new results will help us answer important questions in terms of both sea rise and how the planet's cold regions are responding to global change," said University of Colorado Boulder physics professor John Wahr, who helped lead the study. "The strength of GRACE is it sees all the mass in the system, even though its resolution isn't high enough to allow us to determine separate contributions from each individual glacier," said Wahr, also a fellow at the University of Colorado-headquartered Cooperative Institute for Research in Environmental Sciences. Traditional estimates of Earth's ice caps and glaciers have been made using ground measurements from relatively few glaciers to infer what all the world's unmonitored glaciers were doing. Only a few hundred of the roughly 200,000 glaciers worldwide have been monitored for longer than a decade. One unexpected study result from GRACE was that the estimated ice loss from high Asian mountain ranges like the Himalaya, the Pamir and the Tien Shan was only about 4 billion tons of ice annually. Some previous ground-based estimates of ice loss in these high Asian mountains have ranged up to 50 billion tons annually, Wahr said. "The GRACE results in this region really were a surprise," said Wahr. "One possible explanation is that previous estimates were based on measurements taken primarily from some of the lower, more accessible glaciers in Asia and were extrapolated to infer the behavior of higher glaciers. But unlike the lower glaciers, most of the high glaciers are located in very cold environments, and require greater amounts of atmospheric warming before local temperatures rise enough to cause significant melting. This makes it difficult to use low-elevation, ground-based measurements to estimate results from the entire system." "This study finds that the world's small glaciers and ice caps in places like Alaska, South America and the Himalayas contribute about 0.4 millimeters (.02 inches) per year to sea level rise," said Tom Wagner, cryosphere program scientist at NASA Headquarters in Washington. "While this is lower than previous estimates, it confirms that ice is being lost from around the globe, with just a few areas in precarious balance. The results sharpen our view of land ice melting, which poses the biggest, most threatening factor in future sea level rise." Launched in 2002, the twin GRACE satellites track changes in Earth's gravity field by noting minute changes in gravitational pull caused by regional variations in Earth's mass, which for periods of months to years is typically due to movements of water on Earth's surface. It does this by measuring changes in the distance between its two identical spacecraft to one-hundredth the width of a human hair. The spacecraft, developed by NASA's Jet Propulsion Laboratory, Pasadena, Calif., are in the same orbit approximately 220 kilometers (137 miles) apart. ||
NASA GSFC MASCON Solution over Antarctica from Jan 2004 - Jun 2014
Go to this pageVisualization of the mass change over the Antarctic Ice Sheet from January 2004 through June 2014. The color on the surface of the ice sheet shows the change in equivalent water height while the graph overlay shows the total accumulated change in gigatons. || GRACE_Antarctic_Wgraph_p30.2521_print.jpg (1024x576) [110.0 KB] || GRACE_Antarctic_Wgraph_p30.2521_searchweb.png (320x180) [71.0 KB] || GRACE_Antarctic_Wgraph_p30.2521_thm.png (80x40) [6.3 KB] || GRACE_Antarctic_Wgraph_p30_1080p.mp4 (1920x1080) [18.2 MB] || GRACE_Antarctic_Wgraph_p30_1080p.webm (1920x1080) [7.7 MB] || GRACE_Antarctic_Wgraph_p30_720p.mp4 (1280x720) [10.4 MB] || GRACE_Antarctic_Wgraph_p30_720p.webm (1280x720) [8.7 MB] || composite (1920x1080) [256.0 KB] || composite (1920x1080) [512.0 KB] || GRACE_Antarctic_Wgraph_p30_360p.mp4 (640x360) [3.8 MB] || MASCON_solution_antartica_4347.pptx [11.0 MB] || MASCON_solution_antartica_4347.key [13.6 MB] ||


