Interface to Space
Overview
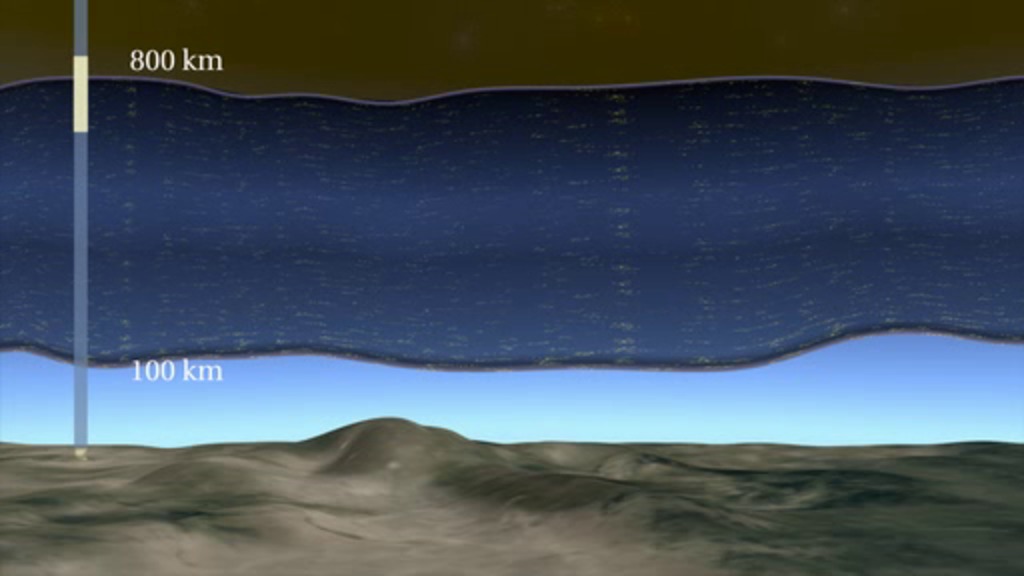
The ionosphere is layer of the upper atmosphere (60-1000 km up) where the neutral atoms and molecules of the lower atmosphere transition to the plasma of space.
Ionosphere Science
Model visualizations illustrating our current understanding of the ionosphere
Exploring Earth's Ionosphere: Limb view
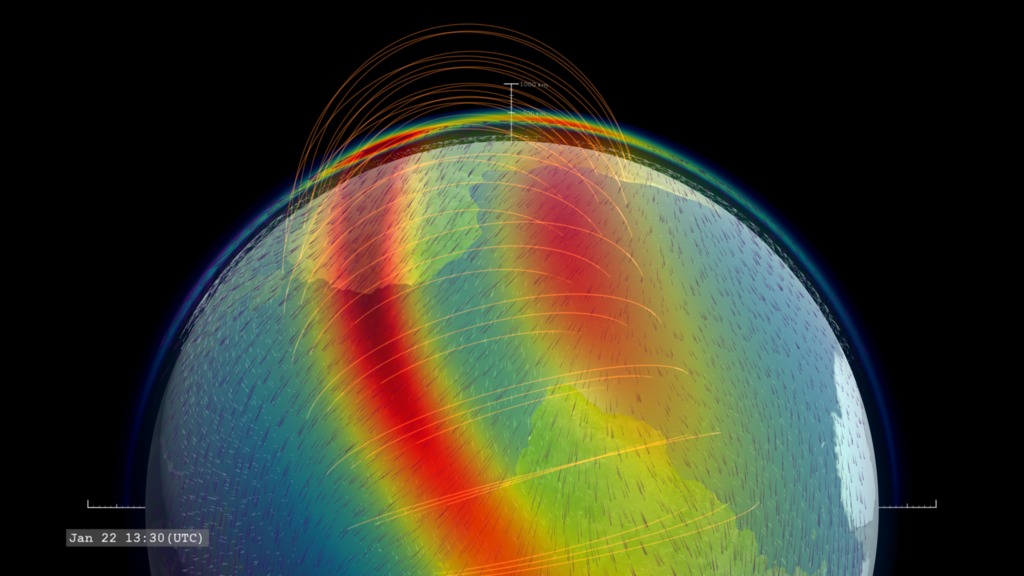
Go to this pageThis visualization presents data on the concentration of the singly-ionized oxygen atom (rainbow color table, red is highest concentration), the low-latitude geomagnetic field (gold field lines) and the ionospheric winds at two altitude levels, 100km (white) and 350 km (violet). || IRIDaily.limb_OionHwindIGRF.clockSlate_CRTT.HD1080i.000750_print.jpg (1024x576) [101.4 KB] || IRIDaily.limb_OionHwindIGRF.clockSlate_CRTT.HD1080i.000750_thm.png (80x40) [5.0 KB] || IRIDaily.limb_OionHwindIGRF.clockSlate_CRTT.HD1080i.000750_searchweb.png (320x180) [62.5 KB] || IRIDaily.limb_OionHwindIGRF.HD1080i_p30.mp4 (1920x1080) [88.3 MB] || OionHwindIGRF (1920x1080) [0 Item(s)] || OionHwindIGRF (3840x2160) [0 Item(s)] || IRIDaily.limb_OionHwindIGRF.2160p30.webm (3840x2160) [12.4 MB] || IRIDaily.limb_OionHwindIGRF.2160p30.mp4 (3840x2160) [274.0 MB] || IRIDaily.limb_OionHwindIGRF.HD1080i_p30.mp4.hwshow [205 bytes] ||
Exploring the Ionosphere: The Dayside Ionosphere
Go to this pageA view of the singly-ionizing oxygen atom on the dayside of Earth. This represents the variation of the enhancments due to variation in the geomagnetic field. This version interpolates the IRI model to a higher time cadence for a smoother animation. || IRIDaily.sunward_O+ion.clockSlate_CRTT.UHD3840.001001_print.jpg (1024x576) [58.1 KB] || IRIDaily.sunward_O+ion.IRIinterp.HD1080i_p30.mp4 (1920x1080) [50.1 MB] || IRI.interpolated (1920x1080) [0 Item(s)] || IRIDaily.sunward_O+ion.IRIinterp.HD1080i_p30.webm (1920x1080) [17.1 MB] || IRIDaily.sunward_O+ion.IRIinterp.UHD3840_2160p30.mp4 (3840x2160) [72.7 MB] || IRI.interpolated (3840x2160) [0 Item(s)] || IRIDaily.sunward_O+ion.IRIinterp_4504.key [51.9 MB] || IRIDaily.sunward_O+ion.IRIinterp_4504.pptx [51.6 MB] || exploring-the-ionosphere-the-dayside-ionosphere.hwshow [308 bytes] ||
Exploring Earth's Ionosphere: Limb view with approach
Go to this pageOxygen ion enhancements at 350km altitude, ionospheric winds at altitudes of 100 km (white) and 350 km (violet) and the low-latitude geomagnetic field. || IRIDaily.zoom2limb_OionHwindIGRF.clockSlate_CRTT.HD1080i.000400_print.jpg (1024x576) [92.1 KB] || IRIDaily.zoom2limb_OionHwindIGRF.clockSlate_CRTT.HD1080i.000400_searchweb.png (320x180) [58.1 KB] || IRIDaily.zoom2limb_OionHwindIGRF.clockSlate_CRTT.HD1080i.000400_thm.png (80x40) [4.9 KB] || IRIDaily.zoom2limb_OionHwindIGRF.HD1080i_p30.mp4 (1920x1080) [89.8 MB] || OionHwindIGRF (1920x1080) [0 Item(s)] || IRIDaily.zoom2limb_OionHwindIGRF.HD1080i_p30.webm (1920x1080) [8.6 MB] || OionHwindIGRF (3840x2160) [0 Item(s)] || IRIDaily.zoom2limb_OionHwindIGRF.2160p30.mp4 (3840x2160) [274.0 MB] || IRIDaily.zoom2limb_OionHwindIGRF.HD1080i_p30.mp4.hwshow [210 bytes] ||
Interface to Space: The Equatorial Fountain
Go to this pageVisualization illustrating the Fountain Effect of ions in the near-Earth electric and magnetic fields. || IRIConceptual.Limb2PullOut_OionFountainIGRF.noslate_CRTT.HD1080i.000660_print.jpg (1024x576) [114.5 KB] || IRIConceptual.Limb2PullOut_OionFountainIGRF.noslate_CRTT.HD1080i.000660_searchweb.png (320x180) [87.8 KB] || IRIConceptual.Limb2PullOut_OionFountainIGRF.noslate_CRTT.HD1080i.000660_thm.png (80x40) [7.2 KB] || 1920x1080_16x9_30p (1920x1080) [0 Item(s)] || IRIConceptual.Limb2PullOut_OionFountainIGRF.HD1080i_p30.mp4 (1920x1080) [32.1 MB] || IRIConceptual.Limb2PullOut_OionFountainIGRF.HD1080i_p30.webm (1920x1080) [4.2 MB] || 3840x2160_16x9_30p (3840x2160) [0 Item(s)] || IRIConceptual.Limb2PullOut_OionFountainIGRF_2160p30.mp4 (3840x2160) [96.1 MB] || IRIConceptual.Limb2PullOut_OionFountainIGRF.HD1080i_p30.mp4.hwshow [221 bytes] ||
Terrestrial Atmosphere ITM (Ionosphere, Thermosphere, Mesosphere) Processes
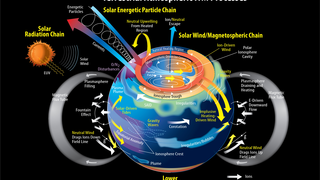
Go to this pageLarge image version || Terrestrial_Atmos_ITM_Processes.jpg (3355x2205) [1.2 MB] || Terrestrial_Atmos_ITM_Processes_searchweb.png (320x180) [65.0 KB] || Terrestrial_Atmos_ITM_Processes_thm.png (80x40) [7.1 KB] || This graphic presents an overview of the physical processes that have been identified in Earth's upper atmosphere. ||
GOLD (Global-scale Observations of the Limb and Disk)
Visualizations featuring GOLD (and sometimes ICON)
Comparing Atomic Oxygen Emission Observed by GOLD with Ionospheric Total Electron Content (TEC)
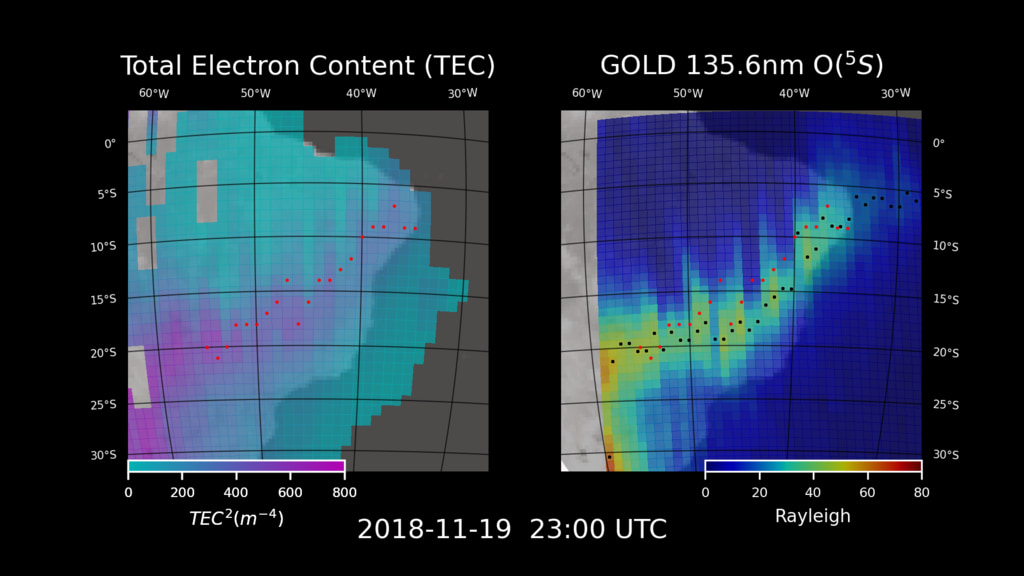
Go to this pageAt 23:00UTC on November 19, 2018, we see the maxima of TEC values (red dots) closely aligned with the maxima of OI 135.6nm emission (black dots) || GOLD_TEC_anomalies_inset.00034_print.jpg (1024x576) [121.4 KB] ||
GOLD Instrument observes the July 2019 Total Solar Eclipse
Go to this pageComparative visualizations of Earth in visible light and the ultraviolet emission of oxygen recombining from ions. The Appleton anomaly is faintly visible above and below the equator on the nightside of the Earth. This version presents the path of the solar eclipse but variations are available in the popup menu to the right. || GOLDEclipse201907.O5S+VIS_path_UHD3840.00192_print.jpg (1024x576) [68.5 KB] || GOLDEclipse201907.O5S+VIS_path_UHD3840.00192_searchweb.png (320x180) [59.6 KB] || GOLDEclipse201907.O5S+VIS_path_UHD3840.00192_thm.png (80x40) [5.4 KB] || GOLDEclipse201907.O5S+VIS_path_HD1080i_p5.webm (1920x1080) [4.7 MB] || Eclipse2019.O5S_VIS_path (1920x1080) [0 Item(s)] || GOLDEclipse201907.O5S+VIS_path_HD1080i_p5.mp4 (1920x1080) [19.8 MB] || Eclipse2019.O5S_VIS_nopath (1920x1080) [0 Item(s)] || GOLDEclipse201907.O5S+VIS_nopath_HD1080i_p5.mp4 (1920x1080) [20.0 MB] || Eclipse2019.O5S_VIS_nopath (3840x2160) [0 Item(s)] || GOLDEclipse201907.O5S+VIS_nopath_UHD3840_2160p5.mp4 (3840x2160) [64.3 MB] || Eclipse2019.O5S_VIS_path (3840x2160) [0 Item(s)] || GOLDEclipse201907.O5S+VIS_path_UHD3840_2160p5.mp4 (3840x2160) [63.4 MB] ||
Observing Earth's Ionosphere with GOLD
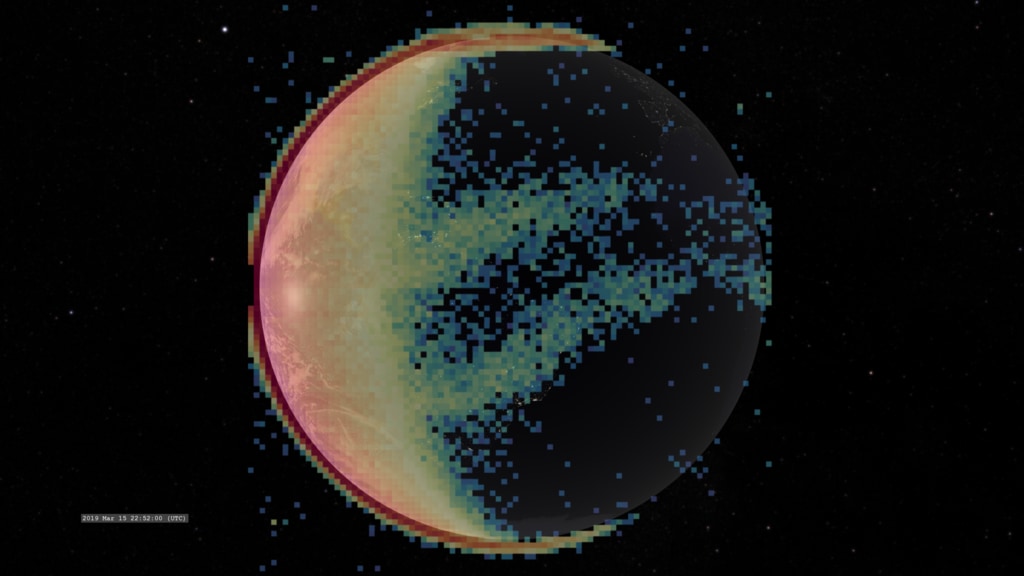
Go to this pageA visualization of GOLD data observing Earth's ionosphere in ultraviolet light around the wavelength of an atomic oxygen emission. || GOLDData201903.GOLDview_O5S.clockSlate_CRTT.UHD3840.000267_print.jpg (1024x576) [70.4 KB] || GOLD_March2019_animated.gif (1042x586) [5.5 MB] || GOLDData201903.GOLDview_O5S.clockSlate_CRTT.UHD3840.000267_searchweb.png (320x180) [72.3 KB] || GOLDData201903.GOLDview_O5S.clockSlate_CRTT.UHD3840.000267_thm.png (80x40) [5.4 KB] || GOLDData201903.GOLDview_O5S.HD1080i_p10.mp4 (1920x1080) [24.0 MB] || basic (1920x1080) [0 Item(s)] || GOLDData201903.GOLDview_O5S.HD1080i_p10.webm (1920x1080) [3.1 MB] || basic (3840x2160) [0 Item(s)] || GOLDData201903.GOLDview_O5S_2160p10.mp4 (3840x2160) [72.0 MB] ||
Exploring the Ionosphere: The View from GOLD
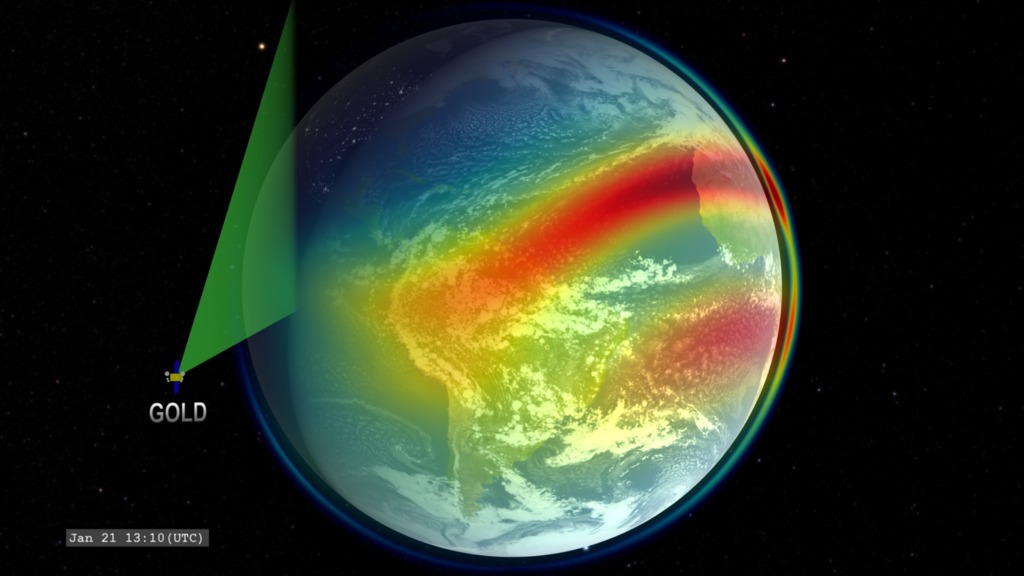
Go to this pageCloseup view of Earth from the perspective of the GOLD instrument. This version interpolates the IRI model to a higher time cadence for a smoother animation. || IRIDaily.GOLDview_O+ion_O+ionSlice.clockSlate_CRTT.UHD3840.001002_print.jpg (1024x576) [50.7 KB] || IRIDaily.GOLDview_O+ion_O+ionSlice.IRIinterp.HD1080i_p30.mp4 (1920x1080) [56.7 MB] || IRI.interpolate (1920x1080) [0 Item(s)] || IRIDaily.GOLDview_O+ion_O+ionSlice.IRIinterp.HD1080i_p30.webm (1920x1080) [17.1 MB] || IRI.interpolate (3840x2160) [0 Item(s)] || IRIDaily.GOLDview_O+ion_O+ionSlice.IRIinterp_4503.key [57.9 MB] || IRIDaily.GOLDview_O+ion_O+ionSlice.IRIinterp_4503.pptx [57.6 MB] || IRIDaily.GOLDview_O+ion_O+ionSlice.IRIinterp_2160p30.mp4 (3840x2160) [200.2 MB] ||
GOLD: Instrument Scanning Coverage
Go to this pageVisualization of GOLD orbiting Earth with image scanning. This version presents the singly-ionized oxygen density from the IRI model. || IRIGOLDscan.GOLDview3_Oion.clockSlate_CRTT.HD1080i.001400_print.jpg (1024x576) [90.3 KB] || IRIGOLDscan.GOLDview3_Oion.clockSlate_CRTT.HD1080i.001400_searchweb.png (320x180) [79.2 KB] || IRIGOLDscan.GOLDview3_Oion.clockSlate_CRTT.HD1080i.001400_thm.png (80x40) [6.1 KB] || 1920x1080_16x9_30p (1920x1080) [0 Item(s)] || IRIGOLDscan.GOLDview4_Oion.HD1080i_p30.mp4 (1920x1080) [38.5 MB] || IRIGOLDscan.GOLDview4_Oion.HD1080i_p30.webm (1920x1080) [10.0 MB] || IRIGOLDscan.GOLDview4_Oion.HD1080i_p30.mp4.hwshow [204 bytes] ||
ICON and GOLD: Instrument Scanning Coverage
Go to this pageVisualization of ICON and GOLD orbiting Earth with image scanning. This version presents several geospace models, including the singly-ionized oxygen density, the low-latitude geomagnetic field, and the high-altitude winds (100km and 350km altitudes). || IRIGOLDscan.GOLDview3_OionHwindIGRF.clockSlate_CRTT.UHD3840.001140_print.jpg (1024x576) [130.5 KB] || IRIGOLDscan.GOLDview3_OionHwindIGRF.clockSlate_CRTT.UHD3840.001140_searchweb.png (320x180) [85.0 KB] || IRIGOLDscan.GOLDview3_OionHwindIGRF.clockSlate_CRTT.UHD3840.001140_thm.png (80x40) [5.9 KB] || IRIGOLDscan.GOLDview3_OionHwindIGRF.HD1080i_p30.mp4 (1920x1080) [82.0 MB] || IRIGOLDscan.GOLDview3_OionHwindIGRF (1920x1080) [0 Item(s)] || IRIGOLDscan.GOLDview3_OionHwindIGRF.HD1080i_p30.webm (1920x1080) [7.6 MB] || IRIGOLDscan.GOLDview3_OionHwindIGRF (3840x2160) [0 Item(s)] || IRIGOLDscan.GOLDview3_OionHwindIGRF_2160p30.mp4 (3840x2160) [258.1 MB] ||
ICON and GOLD: Exploring the Interface to Space
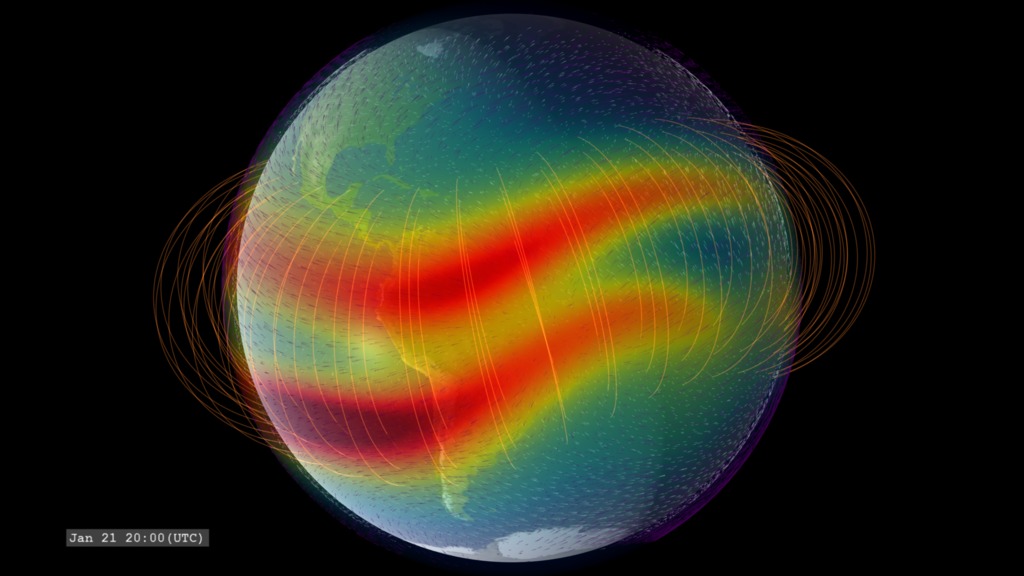
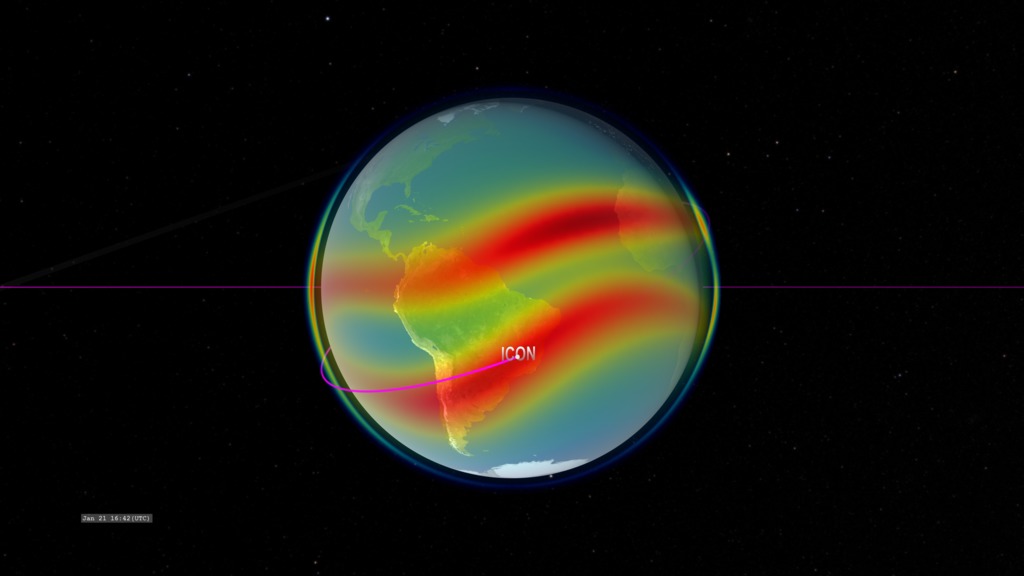
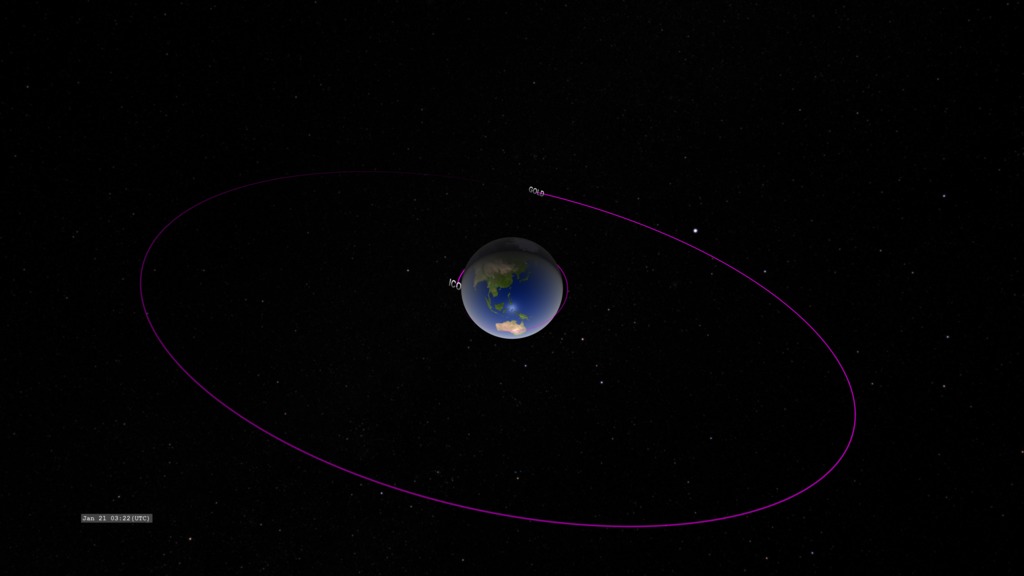
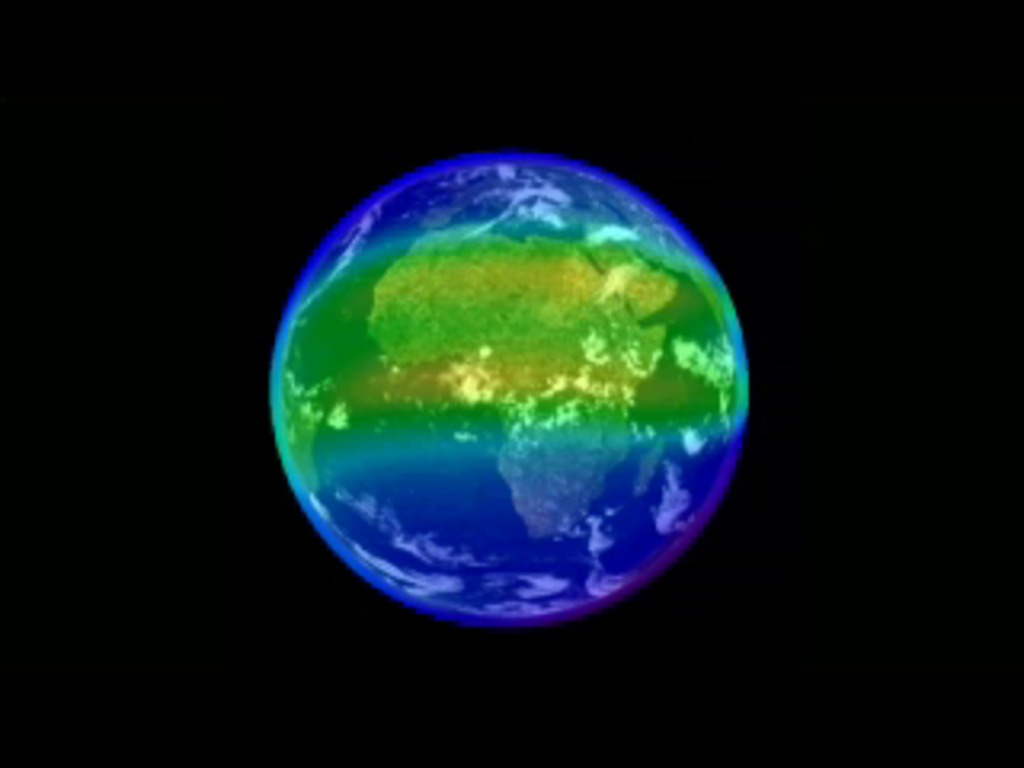
Go to this pageA basic view of the orbits for ICON (Ionospheric Connections Explorer) and GOLD (Global-scale Observations of the Limb and Disk). These missions will conduct measurements of ionospheric composition, ionization, and winds to better understand the connection between space weather and its terrestrial impacts.In this visualization, we present GOLD (in geostationary orbit around Earth) and ICON (in low Earth orbit). The colors over Earth represent model data from the IRI (International Reference Ionosphere) model of the density of the singly-ionized oxygen atom at an altitude of 350 kilometers. Red represents high density. The ion density is enhanced above and below the geomagnetic equator (not perfectly aligned with the geographic equator) on the dayside due to the ionizing effects of solar ultraviolet radiation combined with the effects of high-altitude winds and the geomagnetic field. ||
GOLD in Geostationary Orbit
Go to this pageThe GOLD instrument orbits Earth in a geostationary orbit over the western hemisphere. || IRIDaily.oblique_.noslate_CRTT.HD1080i.000450_print.jpg (1024x576) [43.8 KB] || IRIDaily.oblique_.noslate_CRTT.HD1080i.000450_searchweb.png (320x180) [44.0 KB] || IRIDaily.oblique_.noslate_CRTT.HD1080i.000450_thm.png (80x40) [2.3 KB] || 1920x1080_16x9_30p (1920x1080) [0 Item(s)] || IRIDaily.oblique_GOLD.HD1080i_p30.mp4 (1920x1080) [22.4 MB] || IRIDaily.oblique_GOLD.HD1080i_p30.webm (1920x1080) [8.5 MB] || 3840x2160_16x9_30p (3840x2160) [0 Item(s)] || IRIDaily.oblique_GOLD.UHD3840_2160p30.mp4 (3840x2160) [90.1 MB] || IRIDaily.oblique_GOLD.HD1080i_p30.mp4.hwshow [199 bytes] ||
ICON (Ionospheric CONnection Explorer)
Visualizations featuring ICON (and sometimes GOLD)
Strong Winds Power Electric Fields in the Upper Atmosphere
Go to this pageUsing observations from NASA’s ICON mission, scientists presented the first direct measurements of Earth’s long-theorized dynamo on the edge of space: a wind-driven electrical generator that spans the globe 60-plus miles above our heads. The dynamo churns in the ionosphere, the electrically charged boundary between Earth and space. It’s powered by tidal winds in the upper atmosphere that are faster than most hurricanes and rise from the lower atmosphere, creating an electrical environment that can affect satellites and technology on Earth. The new work, published today in Nature Geoscience, improves our understanding of the ionosphere, which helps scientists better predict space weather and protect our technology from its effects.More information: https://www.nasa.gov/feature/goddard/2021/strong-winds-power-electric-fields-in-upper-atmosphere-icon/ ||
ICON Snaps a Peek at the Ionospheric Dynamo
Go to this pageVisualization of ICON in Earth orbit, camera ahead of the spacecraft looking back on spacecraft and limb of Earth. Magenta curves are lines of Earth's geomagnetic field. Field-of-view (FOV) of MIGHTI imagers (green frustums) and the longitudinal wind vectors (green arrows) it measures are shown. MIGHTI imagers FOV eventually fades out. Vertical plasma speed (red arrows) is measured at the spacecraft. Magnetic field lines turn yellow as measurements of winds by MIGHT provide a connection to influence the plasma velocity measured at the spacecraft, redirecting the plasma flow from upward to downward. || ICONDataView.ICONSyncView+x_.clockSlate_CRTT.HD1080i.000750_print.jpg (1024x576) [135.0 KB] || ICONDataView.ICONSyncView+x_.clockSlate_CRTT.HD1080i.000750_searchweb.png (320x180) [79.4 KB] || ICONDataView.ICONSyncView+x_.clockSlate_CRTT.HD1080i.000750_thm.png (80x40) [5.7 KB] || ICONSyncView+x (1920x1080) [0 Item(s)] || ICONDataView.ICONSyncView+x.HD1080i_p30.mp4 (1920x1080) [36.4 MB] || ICONDataView.ICONSyncView+x.HD1080i_p30.webm (1920x1080) [5.1 MB] || ICONSyncView+x (3840x2160) [0 Item(s)] || ICONDataView.ICONSyncView+x.2160p30.mp4 (3840x2160) [114.3 MB] || ICONDataView.ICONSyncView+x.HD1080i_p30.mp4.hwshow ||
ICON Scans the Ionosphere
Go to this pageICON orbits Earth at 575 kilometers altitude, measuring the composition and motions of the ionosphere. || IRIDaily.limbwICON_OionHwindIGRF.clockSlate_CRTT.HD1080i.000870_print.jpg (1024x576) [105.7 KB] || IRIDaily.limbwICON_OionHwindIGRF.clockSlate_CRTT.HD1080i.000870_searchweb.png (320x180) [63.8 KB] || IRIDaily.limbwICON_OionHwindIGRF.clockSlate_CRTT.HD1080i.000870_thm.png (80x40) [5.0 KB] || 1920x1080_16x9_30p (1920x1080) [0 Item(s)] || IRIDaily.limbwICON_OionHwindIGRF.HD1080i_p30.mp4 (1920x1080) [76.4 MB] || IRIDaily.limbwICON_OionHwindIGRF.HD1080i_p30.webm (1920x1080) [10.9 MB] || 3840x2160_16x9_30p (3840x2160) [0 Item(s)] || IRIDaily.limbwICON_OionHwindIGRF.UHD3840_2160p30.mp4 (3840x2160) [217.4 MB] || IRIDaily.limbwICON_OionHwindIGRF.HD1080i_p30.mp4.hwshow [210 bytes] ||
ICON and GOLD: Instrument Scanning Coverage
Go to this pageVisualization of ICON and GOLD orbiting Earth with image scanning. This version presents several geospace models, including the singly-ionized oxygen density, the low-latitude geomagnetic field, and the high-altitude winds (100km and 350km altitudes). || IRIGOLDscan.GOLDview3_OionHwindIGRF.clockSlate_CRTT.UHD3840.001140_print.jpg (1024x576) [130.5 KB] || IRIGOLDscan.GOLDview3_OionHwindIGRF.clockSlate_CRTT.UHD3840.001140_searchweb.png (320x180) [85.0 KB] || IRIGOLDscan.GOLDview3_OionHwindIGRF.clockSlate_CRTT.UHD3840.001140_thm.png (80x40) [5.9 KB] || IRIGOLDscan.GOLDview3_OionHwindIGRF.HD1080i_p30.mp4 (1920x1080) [82.0 MB] || IRIGOLDscan.GOLDview3_OionHwindIGRF (1920x1080) [0 Item(s)] || IRIGOLDscan.GOLDview3_OionHwindIGRF.HD1080i_p30.webm (1920x1080) [7.6 MB] || IRIGOLDscan.GOLDview3_OionHwindIGRF (3840x2160) [0 Item(s)] || IRIGOLDscan.GOLDview3_OionHwindIGRF_2160p30.mp4 (3840x2160) [258.1 MB] ||
ICON and GOLD: Exploring the Interface to Space
Go to this pageA basic view of the orbits for ICON (Ionospheric Connections Explorer) and GOLD (Global-scale Observations of the Limb and Disk). These missions will conduct measurements of ionospheric composition, ionization, and winds to better understand the connection between space weather and its terrestrial impacts.In this visualization, we present GOLD (in geostationary orbit around Earth) and ICON (in low Earth orbit). The colors over Earth represent model data from the IRI (International Reference Ionosphere) model of the density of the singly-ionized oxygen atom at an altitude of 350 kilometers. Red represents high density. The ion density is enhanced above and below the geomagnetic equator (not perfectly aligned with the geographic equator) on the dayside due to the ionizing effects of solar ultraviolet radiation combined with the effects of high-altitude winds and the geomagnetic field. ||
ICON Beauty Pass
Go to this pageBeauty pass showing ICON observing the ionosphere. Credit: NASA/GSFC/CIL || AirGlow_final_ProRes.00001_print.jpg (1024x576) [87.7 KB] || AirGlow_final_ProRes.00001_web.png (320x180) [74.1 KB] || AirGlow_final_ProRes.00001_searchweb.png (180x320) [74.1 KB] || AirGlow_final_ProRes.00001_thm.png (80x40) [6.0 KB] || AirGlow_final_H264.mov (1920x1080) [19.5 MB] || 1920x1080_16x9_60p (1920x1080) [0 Item(s)] || AirGlow_final_ProRes.webm (1920x1080) [1.0 MB] || AirGlow_final_ProRes.mov (1920x1080) [304.3 MB] ||
ICON Graphics
Go to this pageThe Ionospheric Connection Explorer, or ICON, is a low-Earth orbiting satellite that will give us new information about how Earth’s atmosphere interacts with near-Earth space — a give-and-take that plays a major role in the safety of our satellites and reliability of communications signals. Specifically, ICON investigates the connections between the neutral atmosphere — which extends from here near the surface to far above us, at the edge of space — and the electrically charged part of the atmosphere, called the ionosphere. The particles of the ionosphere carry electrical charge that can disrupt communications signals, cause satellites in low-Earth orbit to become electrically charged, and, in extreme cases, cause power outages on the ground. ||
Older Ionospheric Studies
Visualizations related to older missions studying the ionosphere.
Ionosphere and CINDI
Go to this pageThe Coupled Ion Dynamics Investigation (CINDI) is a joint NASA/Air Force funded Ionospheric plasma sensor. This animation shows how the ionosphere changes between Daytime and nighttime. ||
4D Ionosphere
Go to this pageNASA-funded researchers have unveiled a new '4D' live model of Earth's ionosphere at the Space Weather Workshop, Boulder, CO. Without leaving home, anyone can fly through the dynamic layer of ionized gases that encircles Earth at edge of space itself. All that's required is a connection to the Internet. Airline flight controllers can use this tool to plan long-distance flights over the poles, saving money and time for flyers. ||
