Ionosphere
Visuals
Ionosphere and CINDI
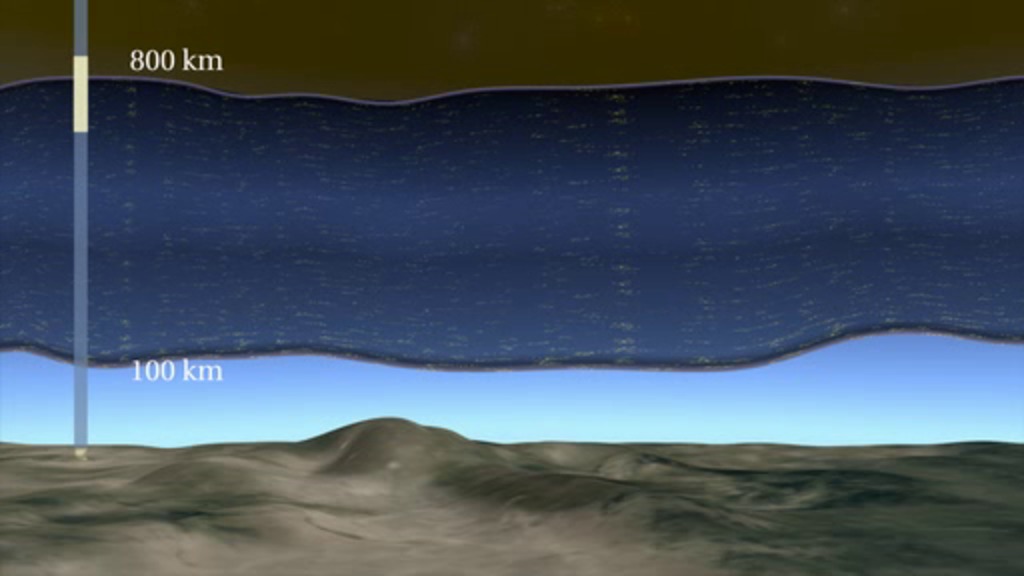
Go to this pageThe Coupled Ion Dynamics Investigation (CINDI) is a joint NASA/Air Force funded Ionospheric plasma sensor. This animation shows how the ionosphere changes between Daytime and nighttime. ||
4D Ionosphere
Go to this pageNASA-funded researchers have unveiled a new '4D' live model of Earth's ionosphere at the Space Weather Workshop, Boulder, CO. Without leaving home, anyone can fly through the dynamic layer of ionized gases that encircles Earth at edge of space itself. All that's required is a connection to the Internet. Airline flight controllers can use this tool to plan long-distance flights over the poles, saving money and time for flyers. ||
Comparing Atomic Oxygen Emission Observed by GOLD with Ionospheric Total Electron Content (TEC)
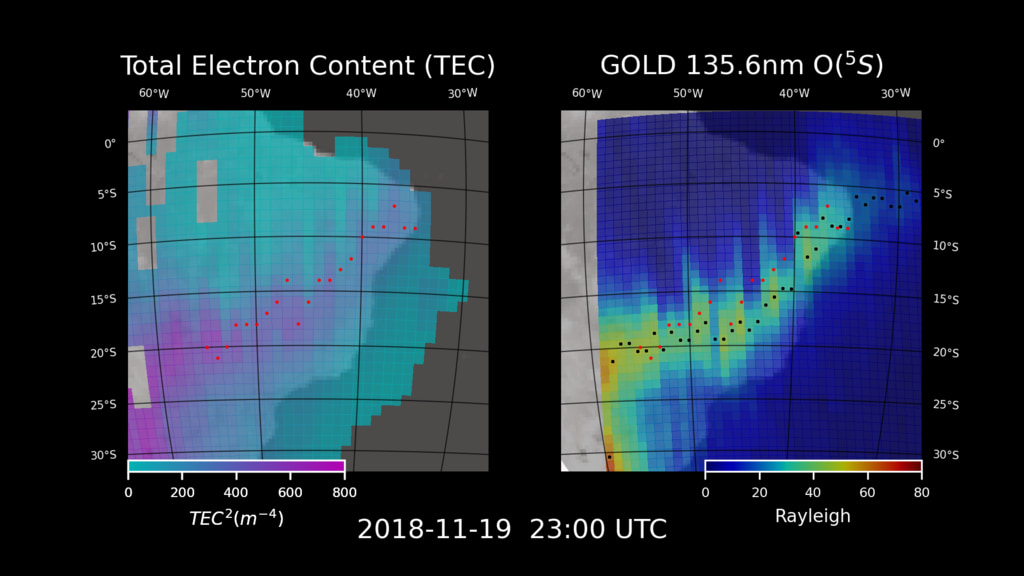
Go to this pageAt 23:00UTC on November 19, 2018, we see the maxima of TEC values (red dots) closely aligned with the maxima of OI 135.6nm emission (black dots) || GOLD_TEC_anomalies_inset.00034_print.jpg (1024x576) [121.4 KB] ||
Observing Earth's Ionosphere with GOLD
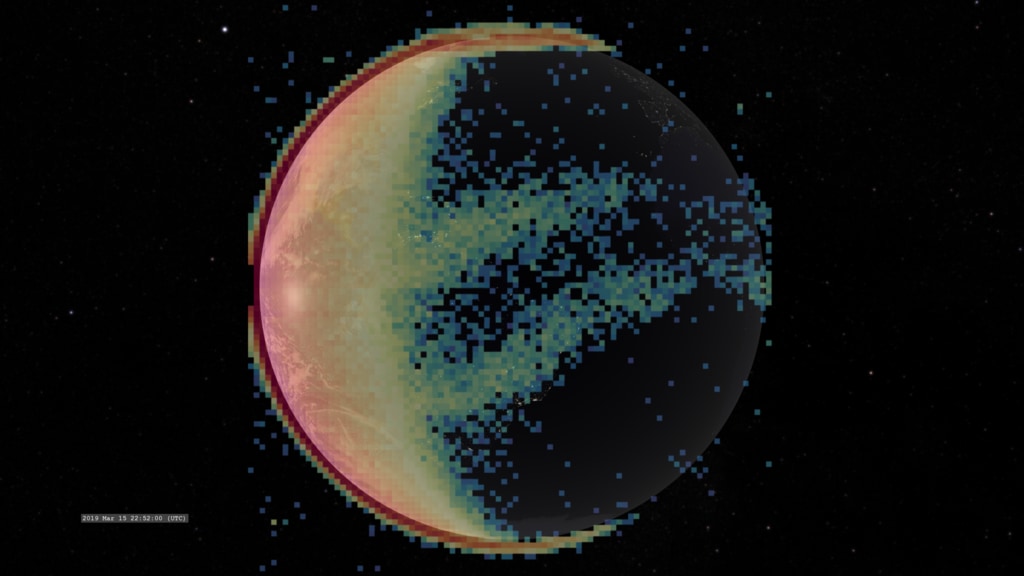
Go to this pageA visualization of GOLD data observing Earth's ionosphere in ultraviolet light around the wavelength of an atomic oxygen emission. || GOLDData201903.GOLDview_O5S.clockSlate_CRTT.UHD3840.000267_print.jpg (1024x576) [70.4 KB] || GOLD_March2019_animated.gif (1042x586) [5.5 MB] || GOLDData201903.GOLDview_O5S.clockSlate_CRTT.UHD3840.000267_searchweb.png (320x180) [72.3 KB] || GOLDData201903.GOLDview_O5S.clockSlate_CRTT.UHD3840.000267_thm.png (80x40) [5.4 KB] || GOLDData201903.GOLDview_O5S.HD1080i_p10.mp4 (1920x1080) [24.0 MB] || basic (1920x1080) [0 Item(s)] || GOLDData201903.GOLDview_O5S.HD1080i_p10.webm (1920x1080) [3.1 MB] || basic (3840x2160) [0 Item(s)] || GOLDData201903.GOLDview_O5S_2160p10.mp4 (3840x2160) [72.0 MB] ||
NASA Scientists see Gravity Waves in Concentric Rings
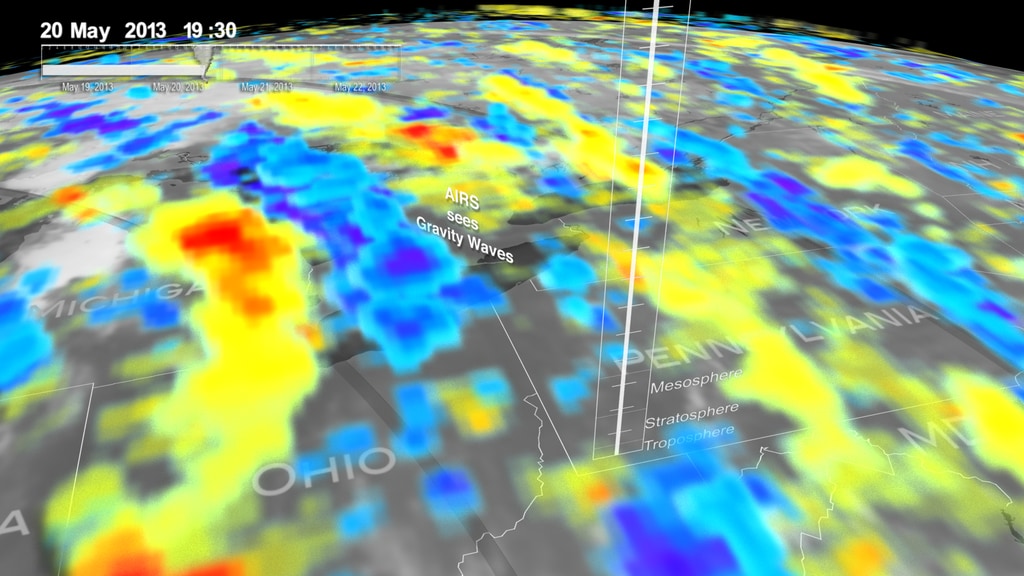
Go to this pageNASA scientists have tracked gravity waves traveling thousands of miles across our atmosphere in concentric rings. Large storms can create these waves, which grow and spread upward hundreds of miles above Earth's surface. The AIRS instrument on NASA's Aqua satellite detected gravity waves in the troposphere and stratosphere 12 hours before a deadly EF5 tornado in Moore, Oklahoma, in 2013. On the instrument's next pass 11 hours later, it detected even stronger waves.We pull up 250 miles to the ionosphere, where the waves can be observed by GPS satellites. Here gravity waves are shown in greens and yellows, like ripples in a pond. The waves and tornado were both produced by a long-lived storm system.Understanding the spread of gravity waves improves global weather forecasting and space weather forecasting.Complete transcript available.This video is also available on our YouTube channel. || GravityWavesBeforeAfterMooreTornado_0740_print.jpg (1024x576) [131.1 KB] || GravityWavesBeforeAfterMooreTornado_0740_searchweb.png (320x180) [102.9 KB] || GravityWavesBeforeAfterMooreTornado_0740_thm.png (80x40) [8.3 KB] || GravityWavesBeforeAfterMooreTornado_0740.tif (1920x1080) [3.2 MB] || GravityWavesMooreOK-SameWordsDifferentOrder.webm (1920x1080) [7.4 MB] || GWfacebook-AIRS-TEC-GOES-4k-audio.mp4 (1920x1080) [76.1 MB] || GravityWavesMooreOK-SameWordsDifferentOrder.mp4 (1920x1080) [117.1 MB] || composite (3849x2160) [0 Item(s)] || GW4k-AIRS-TEC-GOES-4k-audio-youtube.en_US.srt [1.2 KB] || GW4k-AIRS-TEC-GOES-4k-audio-youtube.en_US.vtt [1.2 KB] || GW4k-AIRS-TEC-GOES-4k-audio-youtube.mp4 (3840x2160) [240.0 MB] || GWfacebook-AIRS-TEC-GOES-4k-audio.mp4.hwshow [199 bytes] ||
ICON Scans the Ionosphere
Go to this pageICON orbits Earth at 575 kilometers altitude, measuring the composition and motions of the ionosphere. || IRIDaily.limbwICON_OionHwindIGRF.clockSlate_CRTT.HD1080i.000870_print.jpg (1024x576) [105.7 KB] || IRIDaily.limbwICON_OionHwindIGRF.clockSlate_CRTT.HD1080i.000870_searchweb.png (320x180) [63.8 KB] || IRIDaily.limbwICON_OionHwindIGRF.clockSlate_CRTT.HD1080i.000870_thm.png (80x40) [5.0 KB] || 1920x1080_16x9_30p (1920x1080) [0 Item(s)] || IRIDaily.limbwICON_OionHwindIGRF.HD1080i_p30.mp4 (1920x1080) [76.4 MB] || IRIDaily.limbwICON_OionHwindIGRF.HD1080i_p30.webm (1920x1080) [10.9 MB] || 3840x2160_16x9_30p (3840x2160) [0 Item(s)] || IRIDaily.limbwICON_OionHwindIGRF.UHD3840_2160p30.mp4 (3840x2160) [217.4 MB] || IRIDaily.limbwICON_OionHwindIGRF.HD1080i_p30.mp4.hwshow [210 bytes] ||
Ionosphere Graphics
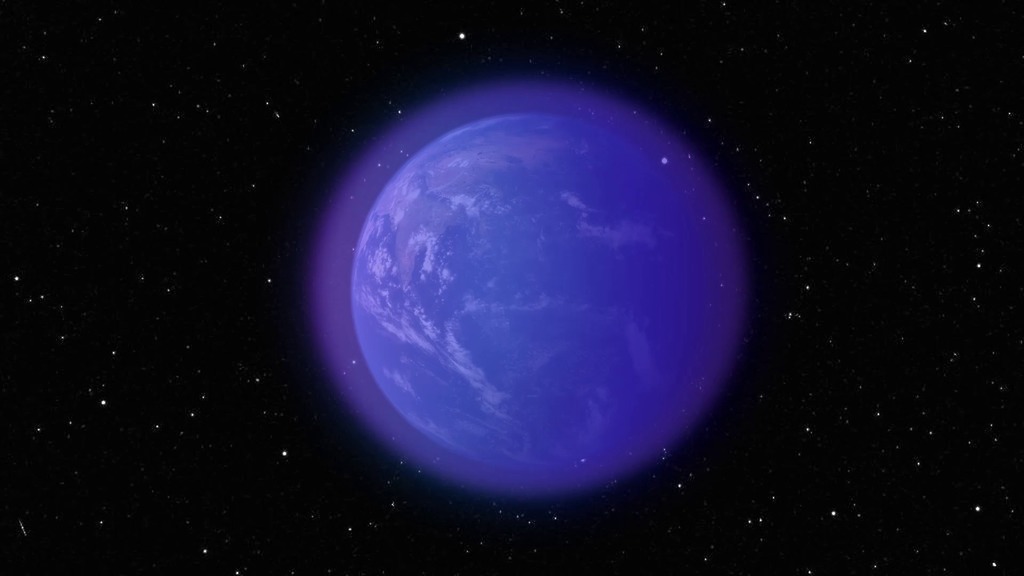
Go to this pageStretching from roughly 50 to 400 miles above Earth’s surface, the ionosphere is an electrified layer of the upper atmosphere, generated by extreme ultraviolet radiation from the Sun. It’s neither fully Earth nor space, and instead, reacts to both terrestrial weather below and solar energy streaming in from above, forming a complex space weather system of its own. The particles of the ionosphere carry electrical charge that can disrupt communications signals, cause satellites in low-Earth orbit to become electrically charged, and, in extreme cases, cause power outages on the ground. Positioned on the edge of space and intermingled with the neutral atmosphere, the ionosphere’s response to conditions on Earth and in space is difficult to pin down. ||
Welcome to the Ionosphere
Go to this pageMusic credit: Foxy Trot by Luis Enriquez Bacalov Complete transcript available.Watch this video on the NASA Goddard YouTube channel. || ionosphere_thumb.jpg (1920x1080) [69.9 KB] || ionosphere_thumb_searchweb.png (320x180) [57.3 KB] || ionosphere_thumb_thm.png (80x40) [6.3 KB] || APPLE_TV-12532_Welcome_to_the_ionosphere_bsideV4_appletv.webm (1280x720) [24.0 MB] || APPLE_TV-12532_Welcome_to_the_ionosphere_bsideV4_appletv.m4v (1280x720) [116.4 MB] || APPLE_TV-12532_Welcome_to_the_ionosphere_bsideV4_appletv_subtitles.m4v (1280x720) [116.5 MB] || YOUTUBE_1080-12532_Welcome_to_the_ionosphere_bsideV4_youtube_1080.mp4 (1920x1080) [346.2 MB] || NASA_TV-12532_Welcome_to_the_ionosphere_bsideV4.mpeg (1280x720) [691.7 MB] || 12532_Welcome_to_the_ionosphere_bsideV2_lowres.en_US.srt [3.8 KB] || 12532_Welcome_to_the_ionosphere_bsideV2_lowres.en_US.vtt [3.8 KB] || LARGE_MP4-12532_Welcome_to_the_ionosphere_bsideV4_large.mp4 (3840x2160) [220.8 MB] || 12532_Welcome_to_the_ionosphere_bsideV4_lowres.mp4 (480x272) [29.2 MB] || NASA_PODCAST-12532_Welcome_to_the_ionosphere_bsideV4_ipod_sm.mp4 (320x240) [37.3 MB] || 12532_Welcome_to_the_ionosphere_bsideV4.mov (3840x2160) [10.1 GB] ||
AGU Ionosphere Press Conference
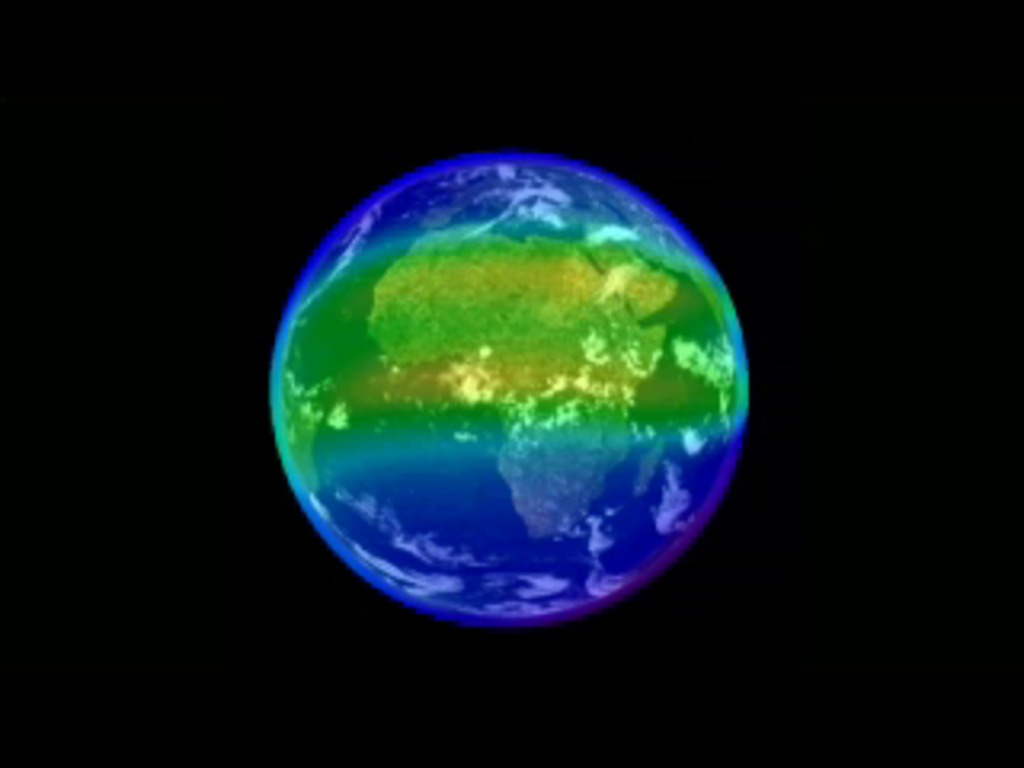
Go to this pageThe ionosphere is a layer of charged particles in Earth’s atmosphere that extends from about 50 to 360 miles above the surface of Earth. Processes in the ionosphere also create bright swaths of color in the sky, known as airglow. Credit: NASA GSFC || AGUIonosphereV4_1.jpg (1280x960) [109.7 KB] ||
