IRIS-NASA's Imaging Spectrometer on the Sun
Overview
IRIS performs high-resolution temporal and spatial spectra of solar events.
Science Results
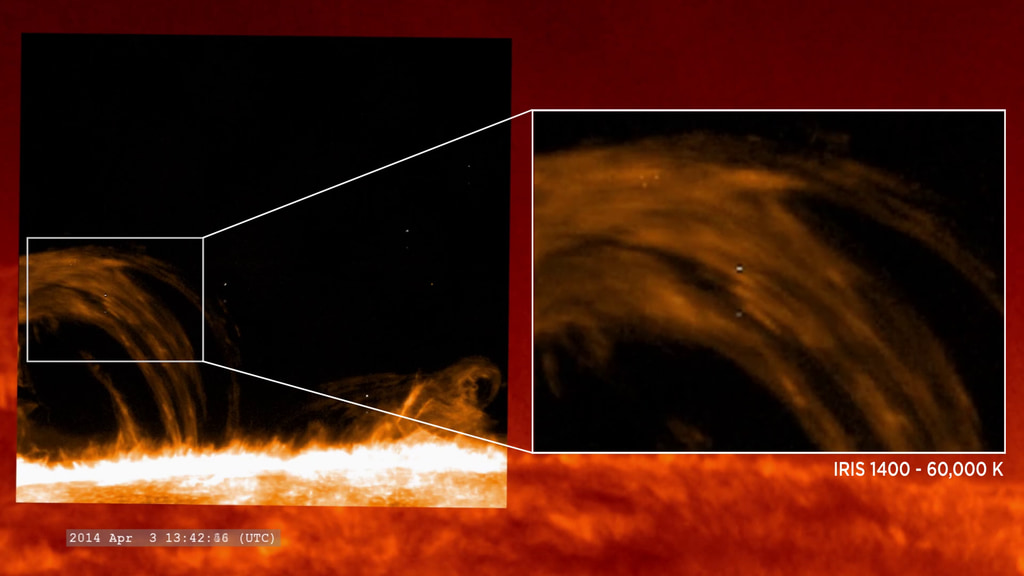
NASA’s IRIS spots Nanojets: Shining light on heating the solar corona
Go to this pageIn pursuit of understanding why the Sun's atmosphere is so much hotter than the surface, and to help differentiate between a host of theories about what causes this heating, researchers turn to NASA's Interface Region Imaging Spectrograph (IRIS) mission. IRIS was finely tuned with a high-resolution imager to zoom in on specific hard-to-see events on the Sun.A paper published in Nature on Sept. 21, 2020, reports on the first ever clear images of nanojets — bright, thin lights that travel perpendicular to magnetic structures in the solar atmosphere called the corona — in a process that reveals the existence of one of the potential coronal heating candidates: nanoflares. ||
Scientists Uncover Origins of Dynamic Jets on Sun's Surface
Go to this pageAt any given moment, as many as 10 million wild jets of solar material burst from the sun’s surface. They erupt as fast as 60 miles per second, and can reach lengths of 6,000 miles before collapsing. These are spicules, and despite their grass-like abundance, scientists didn’t understand how they form. Now, for the first time, a computer simulation — so detailed it took a full year to run — shows how spicules form, helping scientists understand how spicules can break free of the sun’s surface and surge upward so quickly. This work relied upon high-cadence observations from NASA’s Interface Region Imaging Spectrograph, or IRIS, and the Swedish 1-meter Solar Telescope in La Palma. Together, the spacecraft and telescope peer into the lower layers of the sun’s atmosphere, known as the interface region, where spicules form. The results of this NASA-funded study were published in Science on June 22, 2017 — a special time of the year for the IRIS mission, which celebrates its fourth anniversary in space on June 26.Research: On the generation of solar spicules and Alfvénic waves.Journal: Science, June 22, 2017.Link to paper: http://science.sciencemag.org/content/356/6344/1269.full ||
Solar Highlights of 2016/2017
Go to this pageA collection of solar highlights featuring:- NASA's Solar Dynamics Observatory (SDO)- NASA's Interface Region Imaging Spectrograph (IRIS) mission- ESA/NASA's Solar and Heliospheric Observatory (SOHO)- NASA's Solar TErrestrial RElations Observatory (STEREO) mission ||
A First for NASA's IRIS: Observing a Gigantic Eruption of Solar Material
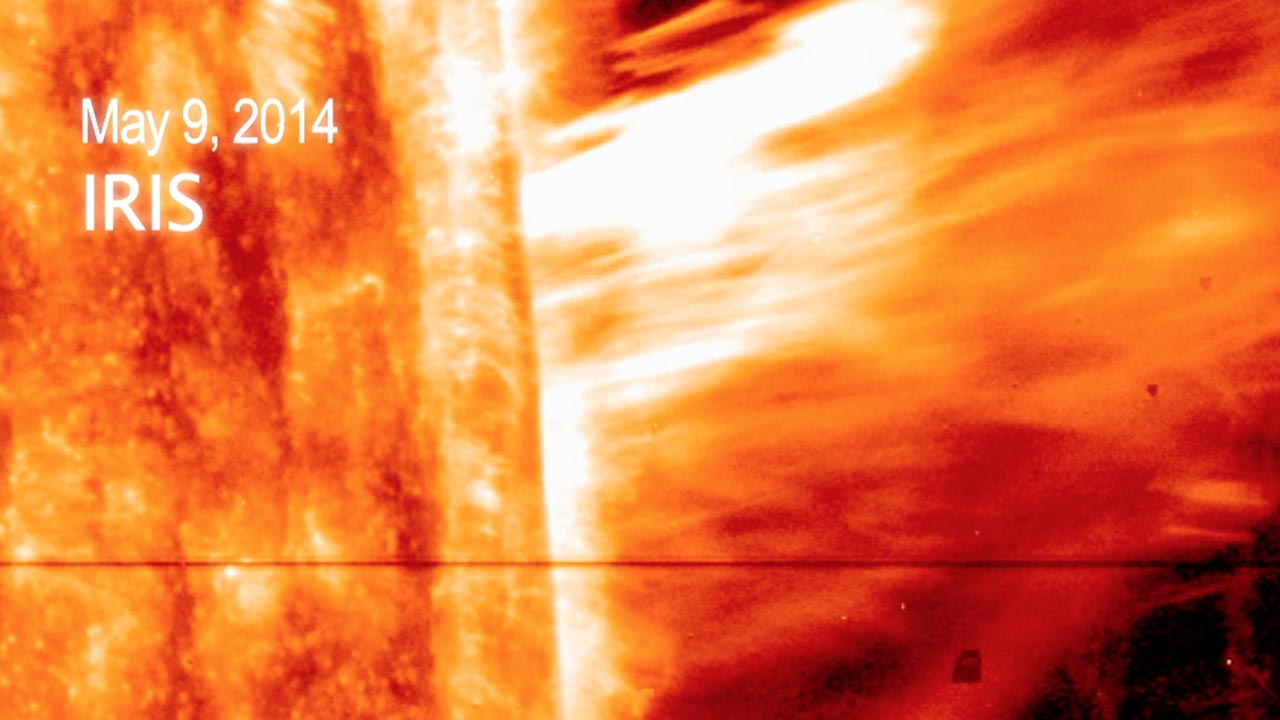
Go to this pageA coronal mass ejection, or CME, surged off the side of the sun on May 9, 2014, and NASA's newest solar observatory caught it in extraordinary detail. This was the first CME observed by the Interface Region Imaging Spectrograph, or IRIS, which launched in June 2013 to peer into the lowest levels of the sun's atmosphere with better resolution than ever before. Watch the movie to see how a curtain of solar material erupts outward at speeds of 1.5 million miles per hour.IRIS must commit to pointing at certain areas of the sun at least a day in advance, so catching a CME in the act involves some educated guesses and a little bit of luck. "We focus in on active regions to try to see a flare or a CME," said Bart De Pontieu, the IRIS science lead at Lockheed Martin Solar & Astrophysics Laboratory in Palo Alto, California. "And then we wait and hope that we'll catch something. This is the first clear CME for IRIS so the team is very excited." The IRIS imagery focuses in on material of 30,000 Kelvin at the base, or foot points, of the CME. The line moving across the middle of the movie is the entrance slit for IRIS's spectrograph, an instrument that can split light into its many wavelengths – a technique that ultimately allows scientists to measure temperature, velocity and density of the solar material behind the slit. The field of view for this imagery is about five Earth's wide and about seven and a half Earth's tall. The IRIS Observatory was designed by and the mission is managed by Lockheed Martin Solar & Astrophysics Laboratory. NASA's Ames Research Center in Mountain View, California, provides mission operations and ground data systems. NASA's Goddard Space Flight Center in Greenbelt, Maryland, manages the Explorers Program for NASA's Science Mission Directorate in Washington, D.C. ||
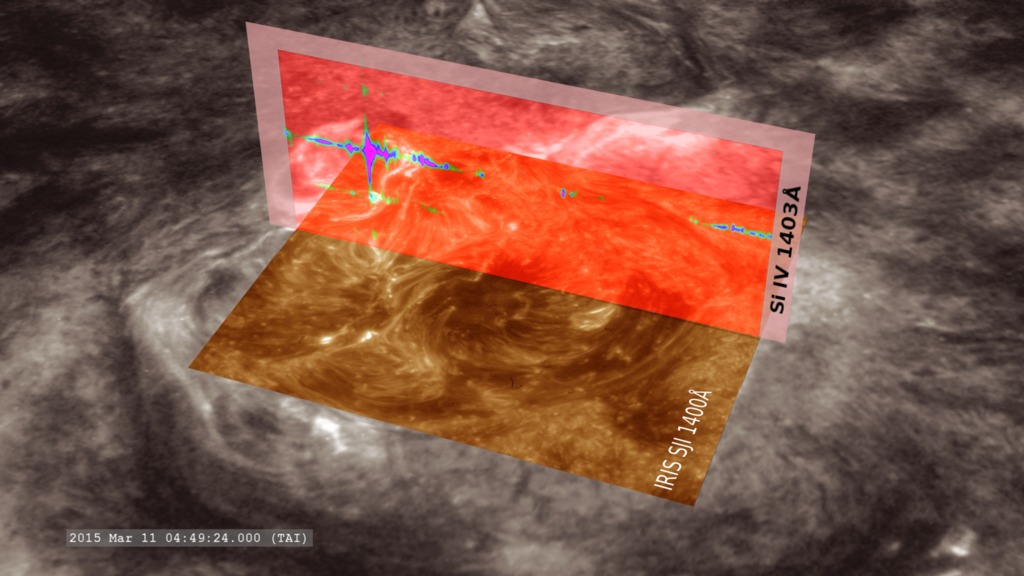
A Slice of Light: How IRIS Observes the Sun
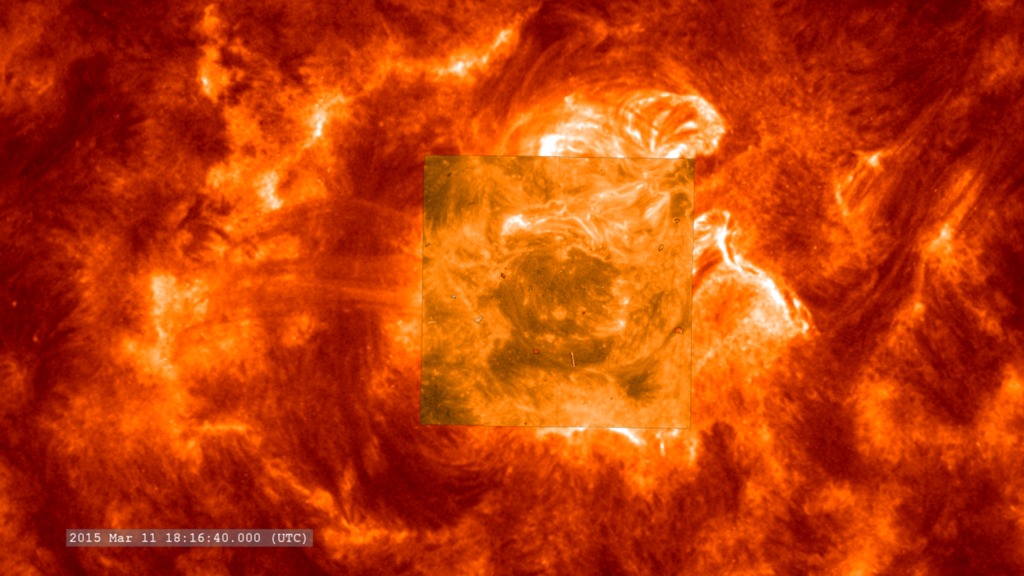
Go to this pageShort version of the IRIS visualization with windowed SJI imagery. || SDO304IRISspectraWin4.2015MarA_stand.HD1080i.00400_print.jpg (1024x576) [122.9 KB] || SDO304IRISspectraWin4.2015MarA_stand.HD1080i.00400_searchweb.png (320x180) [95.6 KB] || SDO304IRISspectraWin4.2015MarA_stand.HD1080i.00400_thm.png (80x40) [7.6 KB] || SDO304IRISspectraWin4_1080p.mp4 (1920x1080) [22.3 MB] || Windowed.short (1920x1080) [128.0 KB] || SDO304IRISspectraWin4_1080p.webm (1920x1080) [4.3 MB] ||
NASA's IRIS Helps Explain Mysterious Heat of the Solar Atmosphere
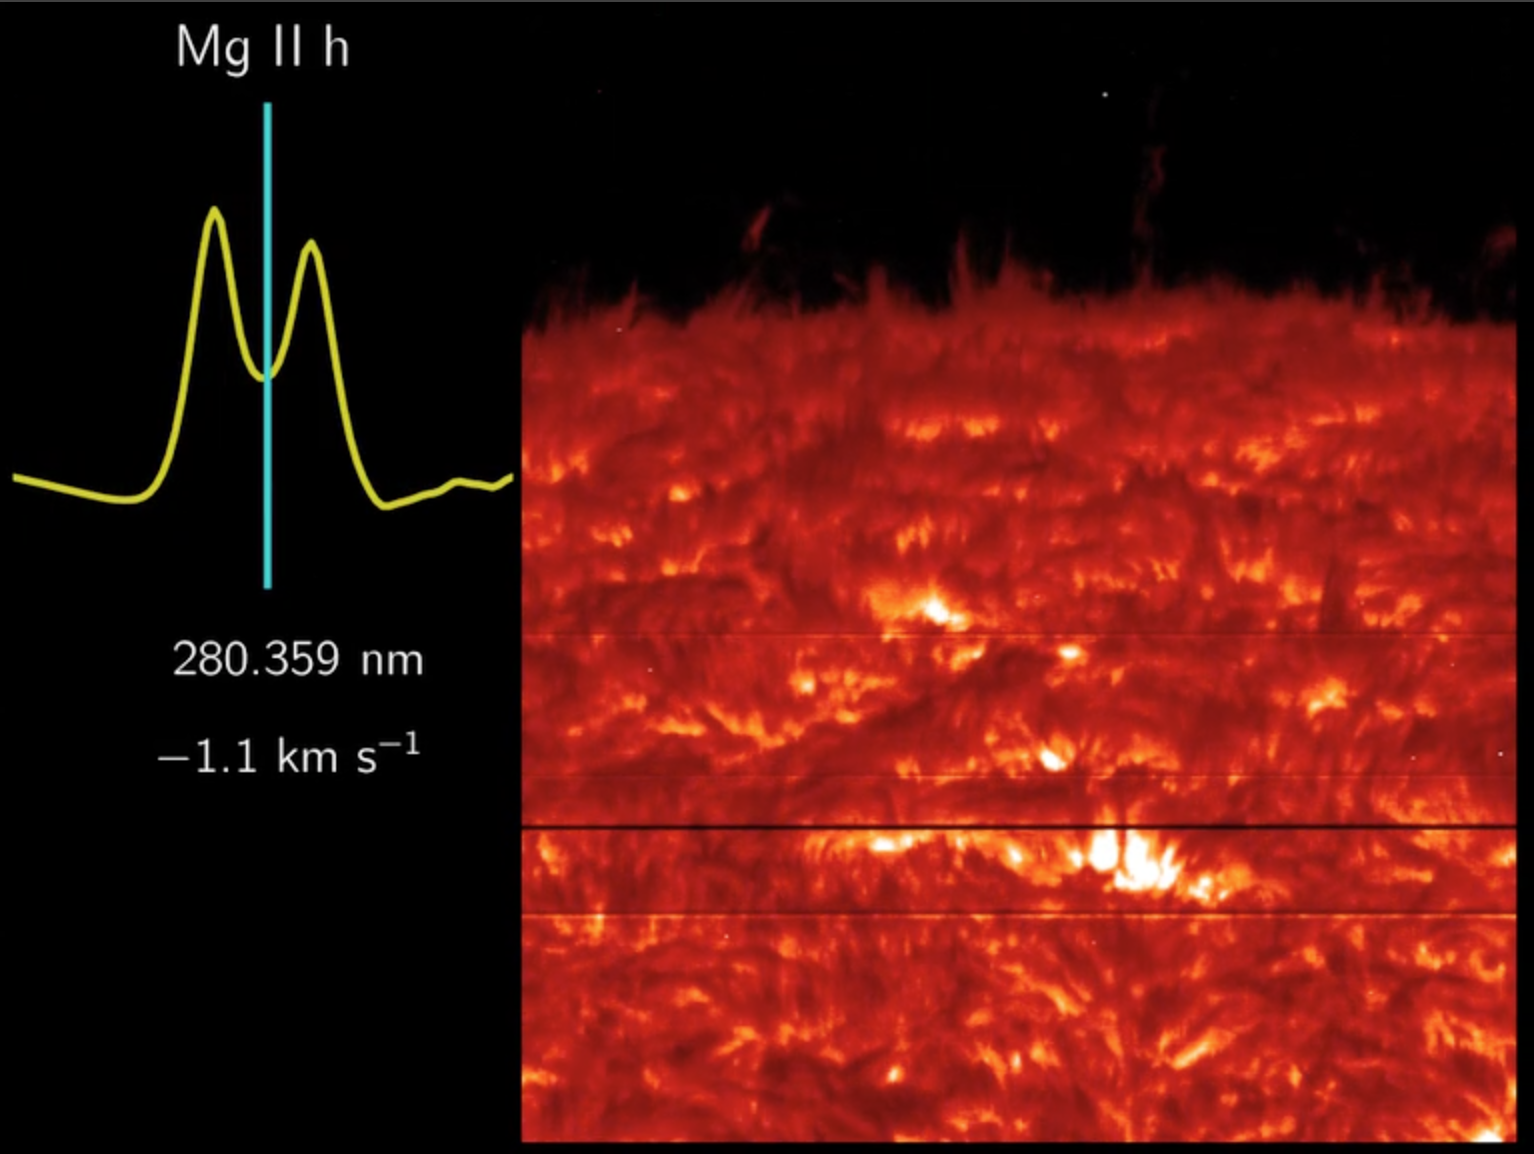
Go to this pageThis movie shows succeeding images from NASA’s IRIS of the same area of the sun in different wavelengths. Each image carries information about how fast the solar material is moving, which has shown scientists that a series of loops are twisting in the sun’s lower atmosphere.Credit: NASA/IRIS/Pereira || S3_still.png (1534x1154) [1.1 MB] || S3_still_web.jpg (319x240) [22.4 KB] || S3_still_searchweb.png (320x180) [67.4 KB] || S3_still_thm.png (80x40) [8.5 KB] || S3.mov (768x576) [2.8 MB] || S3.webmhd.webm (960x540) [1.8 MB] ||
March Solar X-flare from IRIS and SDO
Go to this pageZoom in on the view of the flare, using SDO and IRIS. || SDO304_IRIS1330_March2015A_stand.HD1080i.00500_print.jpg (1024x576) [151.2 KB] || SDO304_IRIS1330_March2015A_stand.HD1080i.00500_searchweb.png (320x180) [88.9 KB] || SDO304_IRIS1330_March2015A_stand.HD1080i.00500_web.png (320x180) [88.9 KB] || SDO304_IRIS1330_March2015A_stand.HD1080i.00500_thm.png (80x40) [6.9 KB] || SDO304_IRIS1330_March2015A_HD1080.webm (1920x1080) [4.0 MB] || 1920x1080_16x9_30p (1920x1080) [0 Item(s)] || SDO304_IRIS1330_March2015A_stand_HD1080.mp4 (1920x1080) [121.2 MB] || SDO304_IRIS1330_March2015A_HD1080.mov (1920x1080) [353.5 MB] || SDO304_IRIS1330_March2015A_stand_HD1080.mp4.hwshow [205 bytes] ||
First Light
IRIS First Light
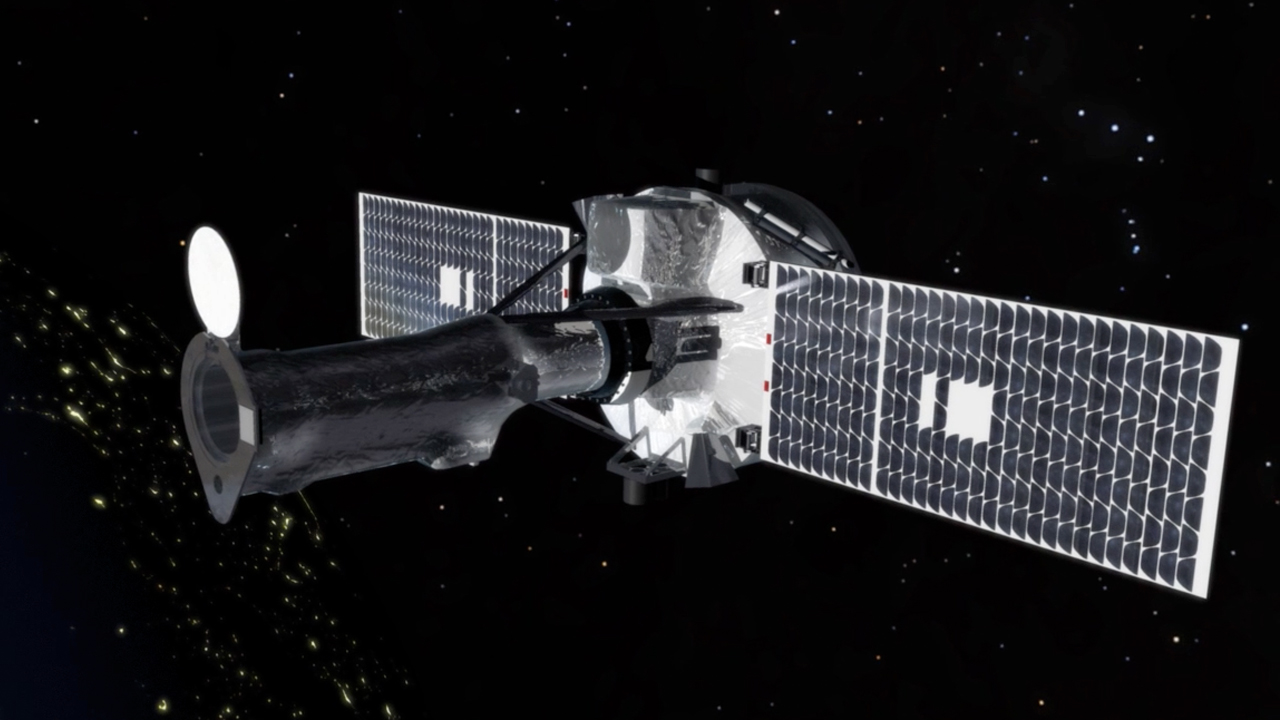
Go to this pageThe images and video on this page are from the IRIS first light media teleconference on July 25, 2013.For supporting media resources, please click here.On July 17, 2013 at 11:14 pm PDT (2:14 pm EDT) the IRIS Lockheed Martin instrument team successfully opened the door on NASA’s Interface Region Imaging Spectrograph, which launched June 27, 2013, aboard a Pegasus XL rocket from Vandenberg Air Force Base, Calif.As the telescope door opened, IRIS’s single instrument began to observe the sun for the first time. Designed to research the interface region in more detail than has ever been done before, IRIS’s instrument is a combination of an ultraviolet telescope and a spectrograph. The telescope provides high-resolution images, capturing data on about 1 percent of the sun at a time. The images can resolve very fine features, as small as 150 miles across. While the telescope can look at only one wavelength of light at a time, the spectrograph collects information about many wavelengths of light at once. The instrument then splits the sun’s light into its various wavelengths and measures how much of any given wavelength is present. Analysis of the spectral lines can also provide velocity, temperature and density information, key information when trying to track how energy and heat moves through the region. ||
IRIS First Light: The View from SDO/AIA @ 160 nm
Go to this pageContemporaneous views of the Sun from SDO. Used in support of the IRIS First Light release. || Full disk view of the Sun in the 160 nanometer wavelength. || IRISFirstLight_AIA1600_stand.HD1080i.00300.jpg (1920x1080) [193.3 KB] || IRISFirstLight_AIA1600_stand.HD1080i.00300_web.png (320x180) [32.5 KB] || IRISFirstLight_AIA1600_HD1080.mov (1920x1080) [31.9 MB] || FixedView (1920x1080) [32.0 KB] || IRISFirstLight_AIA1600_HD1080.webmhd.webm (960x540) [3.1 MB] ||
Pre-Launch
IRIS Launch
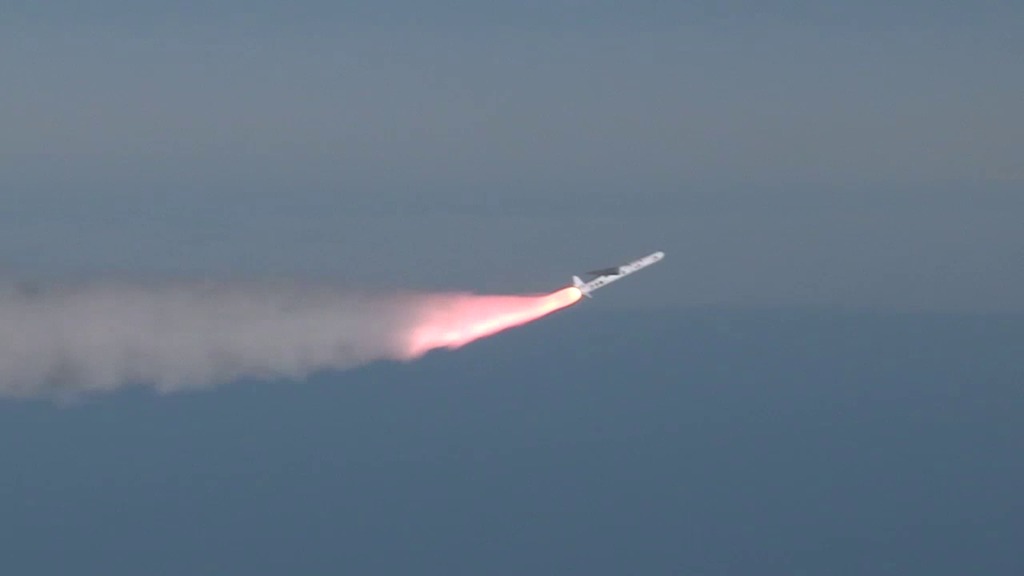
Go to this pageNASA's Interface Region Imaging Spectrograph (IRIS) solar observatory separated from its Pegasus rocket and is in the proper orbit. This followed a successful launch by the Orbital Sciences Pegasus XL rocket from Vandenberg Air Force Base, Calif. It was the final Pegasus launch currently manifested by NASA. NASA's Launch Services Program at the agency's Kennedy Space Center in Florida managed the countdown and launch.IRIS is a NASA Small Explorer Mission to observe how solar material moves, gathers energy and heats up as it travels through a little-understood region in the sun's lower atmosphere. This interface region between the sun's photosphere and corona powers its dynamic million-degree atmosphere and drives the solar wind.NASA's Interface Region Imaging Spectrograph (IRIS) spacecraft launched Wednesday at 7:27 p.m. PDT (10:27 p.m. EDT) from Vandenberg Air Force Base, Calif. The mission to study the solar atmosphere was placed in orbit by an Orbital Sciences Corporation Pegasus XL rocket. ||
IRIS: Studying the Energy Flow that Powers the Solar Atmosphere
Go to this pageIn late June 2013, the Interface Region Imaging Spectrograph, or IRIS, will launch from Vandenberg Air Force Base, Calif. IRIS will tease out the rules governing the lowest layers of the solar atmosphere — historically some of the hardest to untangle. Known as the solar interface region, this is one of the most complex areas in the sun's atmosphere: all the energy that drives solar activity travels through it. The interface region lies between the sun’s 6,000-degree, white-hot, visible surface, the photosphere, and the much hotter multi-million-degree upper corona. Interactions between the violently moving plasma and the sun’s magnetic field in this area may well be the source of the energy that heats the corona to its million-degree temperatures, some hundreds and occasionally thousands of times hotter than the sun's surface. The chromosphere is also considered a candidate as the origin for giant explosions on the sun such as solar flares and coronal mass ejections. IRIS will use high-resolution images, data and advanced computer models to unravel how solar gases move, gather energy and heat up through the lower solar atmosphere. Outfitted with state-of-the-art tools, IRIS will be able to tease apart what's happening in the solar interface region better than ever before. ||
IRIS L-14 Media Briefing
Go to this pageLying just above the sun's surface is an enigmatic region of the solar atmosphere called the interface region. A relatively thin region, just 3,000 to 6,000 miles thick, it pulses with movement: zones of different temperature and density are scattered throughout, while energy and heat course through the solar material. Understanding how the energy travels through this region – energy that helps heat the upper layer of the atmosphere, the corona, to temperatures of 1,000,000 kelvins, some thousand times hotter than the sun’s surface itself – is the goal of NASA's Interface Region Imaging Spectrograph, or IRIS, scheduled to launch on June 26, 2013 from California's Vandenberg Air Force Base. Scientists wish to understand the interface region in exquisite detail, since energy flowing through this region has an effect on so many aspects of near-Earth space. For one thing, despite the intense amount of energy deposited into the interface region, only a fraction leaksthrough, but this fraction drives the solar wind, the constant stream of particles that flows out to fill the entire solar system. The interface region is also the source of most of the sun's ultraviolet emission, which impacts both the near-Earth space environment and Earth's climate. IRIS's capabilities are uniquely tailored to unravel the interface region by providing both high-resolution images and a kind of data known as spectra, which can see many wavelengths at once. For its high-resolution images, IRIS will capture data on about one percent of the sun at a time. While these are relatively small snapshots, IRIS will be able to see very fine features, as small as 150 miles across. ||
IRIS Launch, Deploy and Beauty Passes
Go to this pageUnderstanding the interface between the photosphere and corona remains a fundamental challenge in solar and heliospheric science. The Interface Region Imaging Spectrograph (IRIS) mission opens a window of discovery into this crucial region by tracing the flow of energy and plasma through the chromosphere and transition region into the corona using spectrometry and imaging. IRIS is designed to provide significant new information to increase our understanding of energy transport into the corona and solar wind and provide an archetype for all stellar atmospheres. The unique instrument capabilities, coupled with state of the art 3-D modeling, will fill a large gap in our knowledge of this dynamic region of the solar atmosphere. The mission will extend the scientific output of existing heliophysics spacecraft that follow the effects of energy release processes from the sun to Earth.IRIS will provide key insights into all these processes, and thereby advance our understanding of the solar drivers of space weather from the corona to the far heliosphere, by combining high-resolution imaging and spectroscopy for the entire chromosphere and adjacent regions. IRIS will resolve in space, time, and wavelength the dynamic geometry from the chromosphere to the low-temperature corona to shed much-needed light on the physics of this magnetic interface region. ||
