Main Dashboard
Overview
This gallery consists of content used in the Main Dashboard at the hyperwall display at the Earth Information Center (EIC), NASA HQ. 


Visualizations
List of data-driven visualizations displayed on the Main Dashboard.
Arctic Sea Ice Spiral
This data visualization shows the Arctic sea ice extent from October 1978 to September 2022. The amount of Arctic sea ice varies seasonally, typically reaching a maximum in March and a minimum in September. Recently, the Arctic sea ice minimum has been decreasing at a rate of 13% per decade. Please see Global Climate Change Vital Signs: Arctic Sea Ice Minimum Extent for more information. Go to this sectionNASA Climate Spiral 1880-2022
Go to this pageThe NASA climate spiral 1880-2022. This version is in Celsius; see below for an alternate version in Fahrenheit. Both a 30 fps, 60 second duration video and 60 fps, 30 second duration video are available. || GISTEMP_Spiral_60sec_C.01400_print.jpg (1024x1024) [283.8 KB] || GISTEMP_Spiral_60sec_C.01400_searchweb.png (180x320) [92.9 KB] || GISTEMP_Spiral_60sec_C.01400_thm.png (80x40) [6.6 KB] || GISTEMP_Spiral_30sec_C.mp4 (2160x2160) [20.3 MB] || GISTEMP_Spiral_60sec_C.mp4 (2160x2160) [38.3 MB] || GISTEMP_Spiral_60sec_C.webm (2160x2160) [8.2 MB] || C (2160x2160) [128.0 KB] ||
Sea Surface Temperature (SST) - Near Real Time
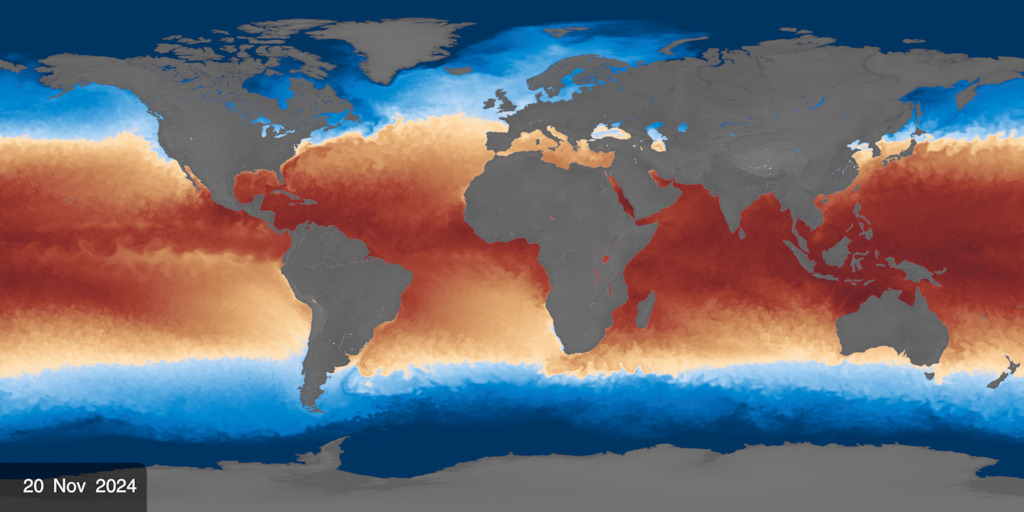
Go to this pageAn equirectangular view of sea surface temperature (SST) data for the past two and half years, updated daily to include the latest available data. || sst_mur_print.jpg (1024x512) [142.4 KB] || sst_mur_searchweb.png (320x180) [78.8 KB] || sst_mur_thm.png (80x40) [6.5 KB] || sst_mur (4096x2048) [64.0 KB] || sst_30_sec_4096x2048_2x1_30p.mp4 (4096x2048) [77.4 MB] ||
Water Cycle Extremes: Droughts and Pluvials
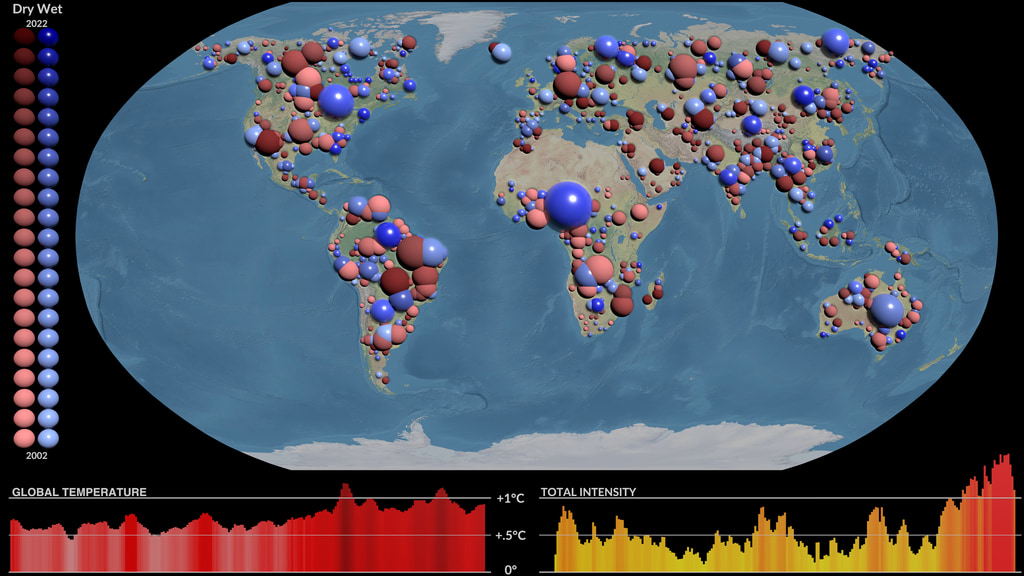
Go to this pageThis visualization shows extremes of the water cycle — droughts and pluvials — over a twenty-year period (2002-2021) based on observations from the GRACE and GRACE-FO satellites. Dry events are shown as red spheres and wet events as blue spheres, with earlier years being shown as lighter shades and later years as darker shades. The volume of the sphere is proportional to the intensity of the event, a quantity measured in cubic kilometer months.
Near Real-Time Global Biosphere
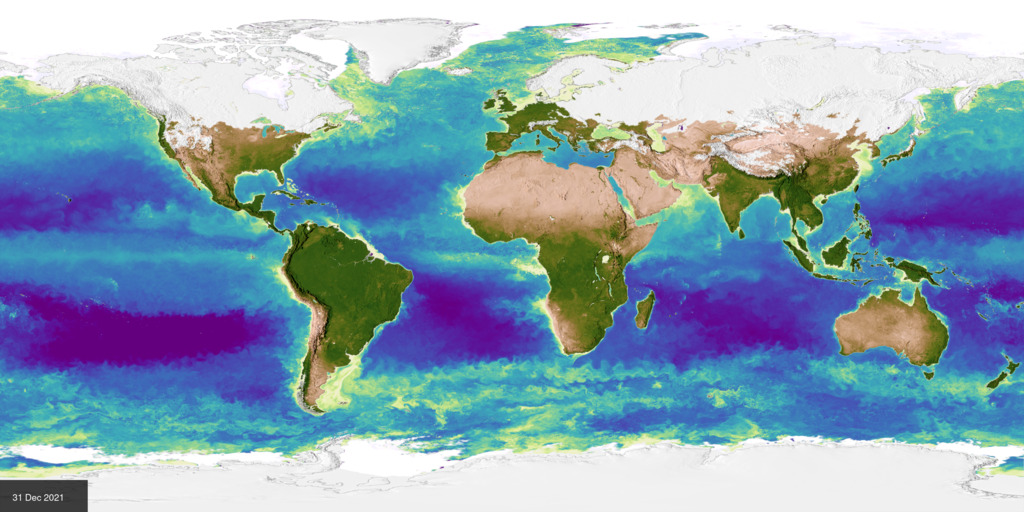
Go to this pageThe latest 2.5 years of Biosphere data with date annotations. || nrtbio_print.jpg (1024x512) [205.4 KB] || nrtbio_searchweb.png (320x160) [88.7 KB] || nrtbio_thm.png (80x40) [7.2 KB] || Plate_Carree_with_Dates (4096x2048) [64.0 KB] || nrtbio_annot_plate_2048p30.mp4 (4096x2048) [114.5 MB] ||
Earth Observing Fleet - Now
These visualizations show the current orbits of NASA's fleet of Earth observing spacecraft. Satellite orbits are generated using today's two-line element sets (TLEs). The still image at the top of the page is updated every 10 minutes. The video is updated once per day. Spacecraft included:
• Aqua
• Aura
• CALIPSO: Cloud-Aerosol Lidar and Infrared Pathfinder Satellite Observation
• CYGNSS-1: Cyclone Global Navigation Satellite System 1
• CYGNSS-2: Cyclone Global Navigation Satellite System 2
• CYGNSS-3: Cyclone Global Navigation Satellite System 3
• CYGNSS-4: Cyclone Global Navigation Satellite System 4
• CYNGSS-5: Cyclone Global Navigation Satellite System 5
• CYGNSS-7: Cyclone Global Navigation Satellite System 7
• CYGNSS-8: Cyclone Global Navigation Satellite System 8
• Cloudsat
• GPM: Global Precipitation Measurement
• GRACE-FO-1: Gravity Recovery and Climate Experiment Follow On-1
• GRACE-FO-2: Gravity Recovery and Climate Experiment Follow On-2
• ICESat-2
• ISS: International Space Station
• Landsat 8
• Landsat 9
• OCO-2: Orbiting Carbon Observatory-2
• SMAP: Soil Moisture Passive Active
• Suomi NPP: Suomi National Polar-orbiting Partnership
• Sentinel-6 Michael Freilich
• SWOT
• Terra The clouds used in this version are from a high resolution GEOS model run at 10 minute time steps interpolated down to the per-frame level. The timeframe for this model does not match the date in this fleet visualization, so the clouds shown do not represent actual conditions for today. Go to this sectionActive Fires As Observed by VIIRS, 2022-Present
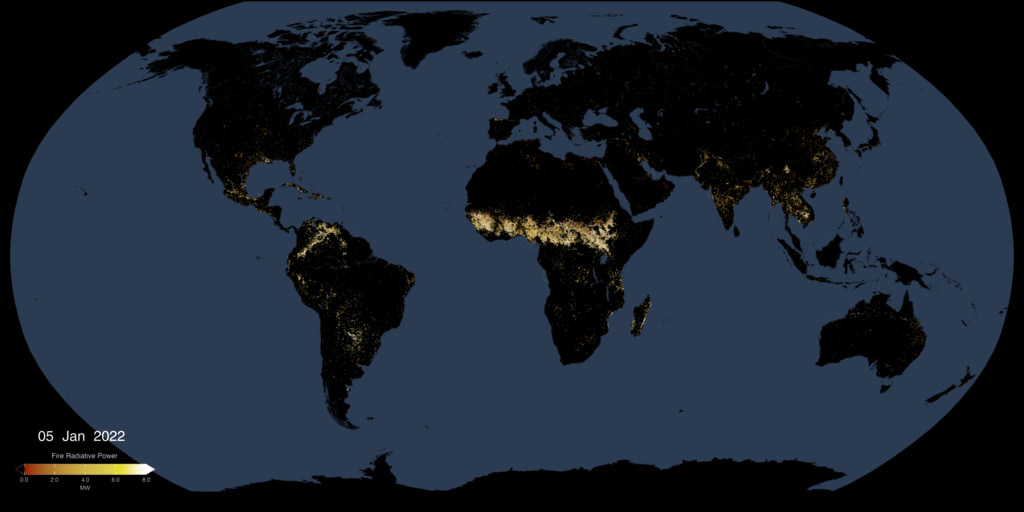
Go to this pageThis animated visualization uses a moving five-day window of VIIRS measurments of fire radiative power (FRP), to present a view of fire intensities around the globe. || fires_frp_VIIRS.001_print.jpg (1024x512) [72.7 KB] || fires_frp_VIIRS.001_web.png (320x160) [138.2 KB] || fires_frp_VIIRS.001_searchweb.png (320x180) [162.3 KB] || fires_frp_VIIRS.001_thm.png (80x40) [13.2 KB] || fires_frp_VIIRS_2048p30.mp4 (4096x2048) [46.4 MB] || EIC (4096x2048) [64.0 KB] || VIIRS_fires_latest.exr [7.0 MB] ||
Washington D.C. Map Highlighting NASA Headquarters
Go to this pageThis map displays Washington D.C. with some major buildings highlighted. It slowly zooms in to the location of the NASA headquarters building. || dc_zoom_cover.png (1920x1080) [1.3 MB] || dc_zoom_cover_searchweb.png (320x180) [65.4 KB] || dc_zoom_cover_thm.png (80x40) [6.2 KB] || dc_zoom5.mp4 (3840x2160) [575.5 MB] || dc_zoom5.webm (3840x2160) [42.0 MB] ||
NOAA GOES-East and NOAA GOES-West True Color Imagery Over Past 5 Days
Go to this pageA true color view of the Earth from GOES-16 (GOES-East) over the past 5 days. || PR_WorldView_geostationary_east_2160x2160_en.00001_print.jpg (1024x1024) [306.7 KB] || PR_WorldView_geostationary_east_2160x2160_en.00001_searchweb.png (320x180) [105.7 KB] || PR_WorldView_geostationary_east_2160x2160_en.00001_thm.png (80x40) [7.5 KB] || east (2160x2160) [128.0 KB] || PR_WorldView_geostationary_east_2160x2160_en.mp4 (2160x2160) [1.1 GB] ||
Worldview Tours
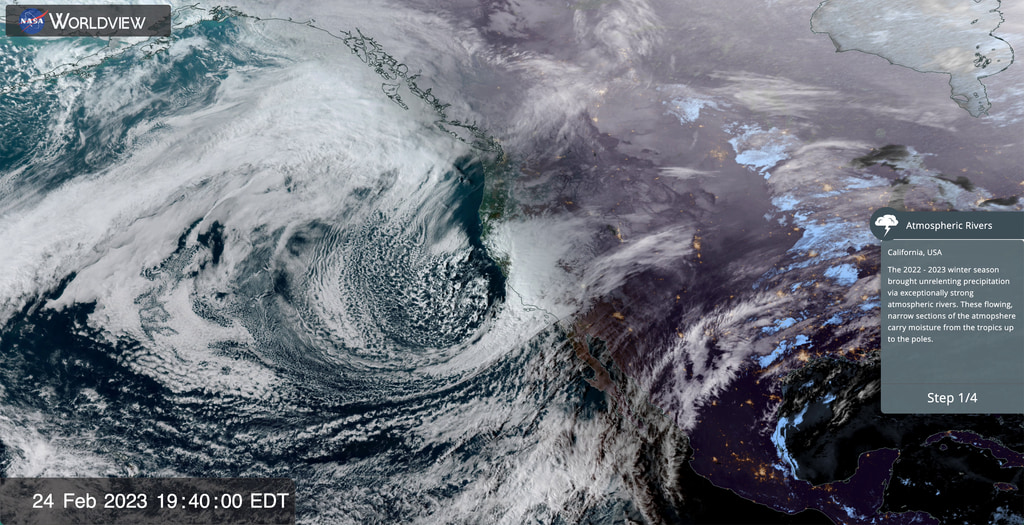
Worldview Tour: Atmospheric Rivers
Go to this pageAtmospheric rivers are long, narrow regions in the atmosphere - like rivers in the sky - that transport moist air from the tropics to higher altitudes, even up to the poles. The moist air combined with high wind speeds, produces heavy rain and snow. || Worldview_AtmosphericRivers.png (3548x1822) [8.0 MB] || Worldview_AtmosphericRivers_print.jpg (1024x525) [227.3 KB] || Worldview_AtmosphericRivers_searchweb.png (320x180) [123.7 KB] || Worldview_AtmosphericRivers_thm.png (80x40) [7.7 KB] || Worldview_AtmosphericRivers.mov (3548x1822) [121.9 MB] ||
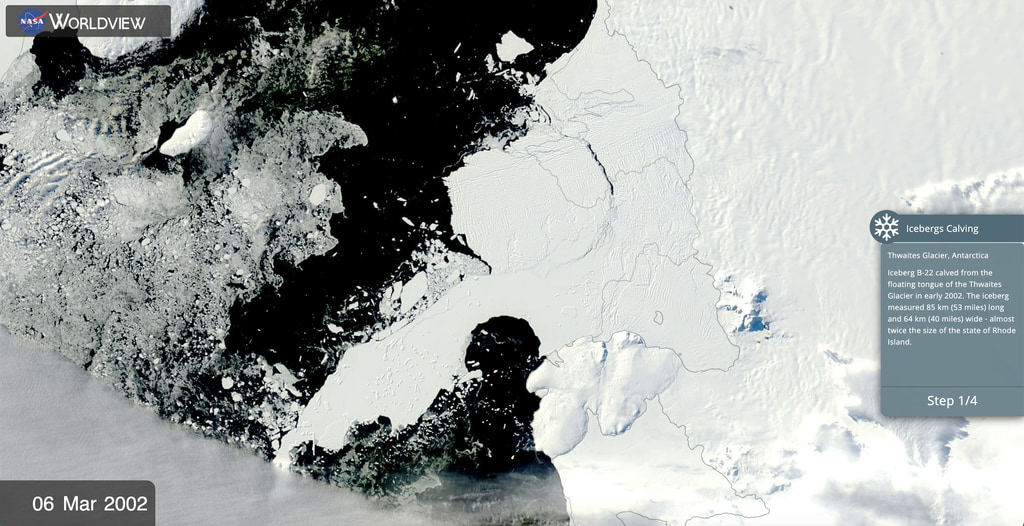
Worldview Tour: Journey of Iceberg B-22
Go to this pageIceberg B-22 calved from Thwaites Glacier, located in Antarctica in early 2002. From the vantage point of space we track its journey and evolution during the last 21 years. || Worldview_IcebergJourney.png (3548x1824) [5.8 MB] || Worldview_IcebergJourney_print.jpg (1024x526) [176.1 KB] || Worldview_IcebergJourney_searchweb.png (320x180) [107.3 KB] || Worldview_IcebergJourney_thm.png (80x40) [7.1 KB] || Worldview_IcebergJourney.mov (3548x1824) [146.2 MB] ||


