Museum Videos
Visuals
Behold, A Whirlwind Came: The Science of Tracking Hurricanes
Go to this pageThis documentary-style video shows how NASA computer modeling research is contributing to an improved understanding and forecasts of hurricanes. It weaves interviews of three Goddard Space Flight Center scientists with scientific visualizations and live-action footage of hurricanes and the scientists studying them. The video focuses on application of the NASA finite-volume General Circulation Model (fvGCM) to the 2004 Atlantic Ocean hurricane season. Over the last 20 years, the National Oceanic and Atmospheric Administration's National Hurricane Center and National Weather Service have produced enormous improvements in hurricane forecasting. However, by running at ~25-kilometer resolution (twice that of current operational forecasts), the NASA fvGCM has shown in some cases an accuracy of landfall prediction on the order of 100 kilometers up to 5 days in advance. Initial evaluation suggests that the potential exists for dramatic improvements in warning time and intensity forecasts for tropical cyclones around the globe. NASA has begun collaborating with the National Weather Service and other agencies worldwide to improve forecasts so that, among other advantages, local authorities can narrow areas for evacuation. The video was produced for the TerraLink exhibit at the Maryland Science Center in Baltimore.Winner of the 2005 Video Competition Crystal Award of Excellence. ||
Earth Today 1998 Introduction
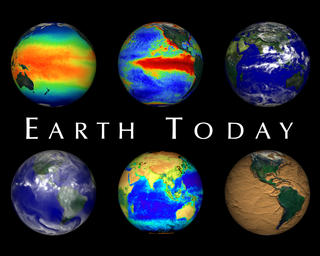
Go to this pageThe ability to see Earth from space has forever changed our view of the planet. We are now able to look at the Earth as a whole, and observe how its atmosphere, oceans, land masses, and life interact as global systems. Earth's atmosphere, hydrosphere, geosphere, and biosphere are dynamic, changing on timescales of days, minutes, or even seconds. Monitoring the Earth in near real time allows us to get an up to date picture of conditions on our planet. More SVS visualizations for the Earth Today exhibit can be found in animation ids 328 and 1402. ||
Earth Today 1998 Countdown
Go to this pageThe ability to see Earth from space has forever changed our view of the planet. We are now able to look at the Earth as a whole, and observe how its atmosphere, oceans, land masses, and life interact as global systems. Earth's atmosphere, hydrosphere, geosphere, and biosphere are dynamic, changing on timescales of days, minutes, or even seconds. Monitoring the Earth in near real time allows us to get an up to date picture of conditions on our planet. More SVS visualizations for the Earth Today exhibit are in animation ids 1401 and 1402. ||
The HoloGlobe Project (Version 3)
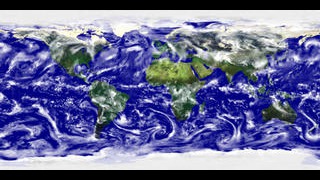
Go to this pageThese animations were produced for the Smithsonian Institution's HoloGlobe Exhibit which opened to the public on August 10, 1996 at the Museum of Natural History in Washington, DC. The various data sets show progressive global change mapped onto a rotating globe and projected into space to create a holographic image of the Earth. The exhibit shows that Earth's atmosphere, hydrosphere, geosphere, and biosphere are dynamic, changing on timescales of days, minutes, or even seconds. The exhibit has since been relocated to the west coast. This is a revised version from Animation #116 [The HoloGlobe Project (version 2)]. ||
The HoloGlobe Project (Version 2)
Go to this pageThis animation was produced for the Smithsonian Institution's HoloGlobe Exhibit which opened to the public on August 10, 1996. The various orthographic data sets showing progressive global change were mapped onto a rotating globe and projected into space to create a holographic image of the Earth. Showing Earthandapos;s atmosphere, hydrosphere, geosphere, and biosphere are dynamic, changing on timescales of days, minutes, or even seconds. This animation is a revised version of Animation #96 [The HoloGlobe Project (Version 1)]. ||
The HoloGlobe Project (Version 1)
Go to this pageThis animation was originally produced for the Smithsonian Institution's HoloGlobe Exhibit which opened to the public on August 10, 1996 at the Museum of Natural History in Washington, DC. These various data sets showing progressive global change were mapped onto a rotating globe and projected into space to create a holographic image of the Earth. Showing Earth's atmosphere, hydrosphere, geosphere, and biosphere are dynamic, changing on timescales of days, minutes, or even seconds. ||


