Narrated Hurricane Products
Visuals
Towers in the Tempest
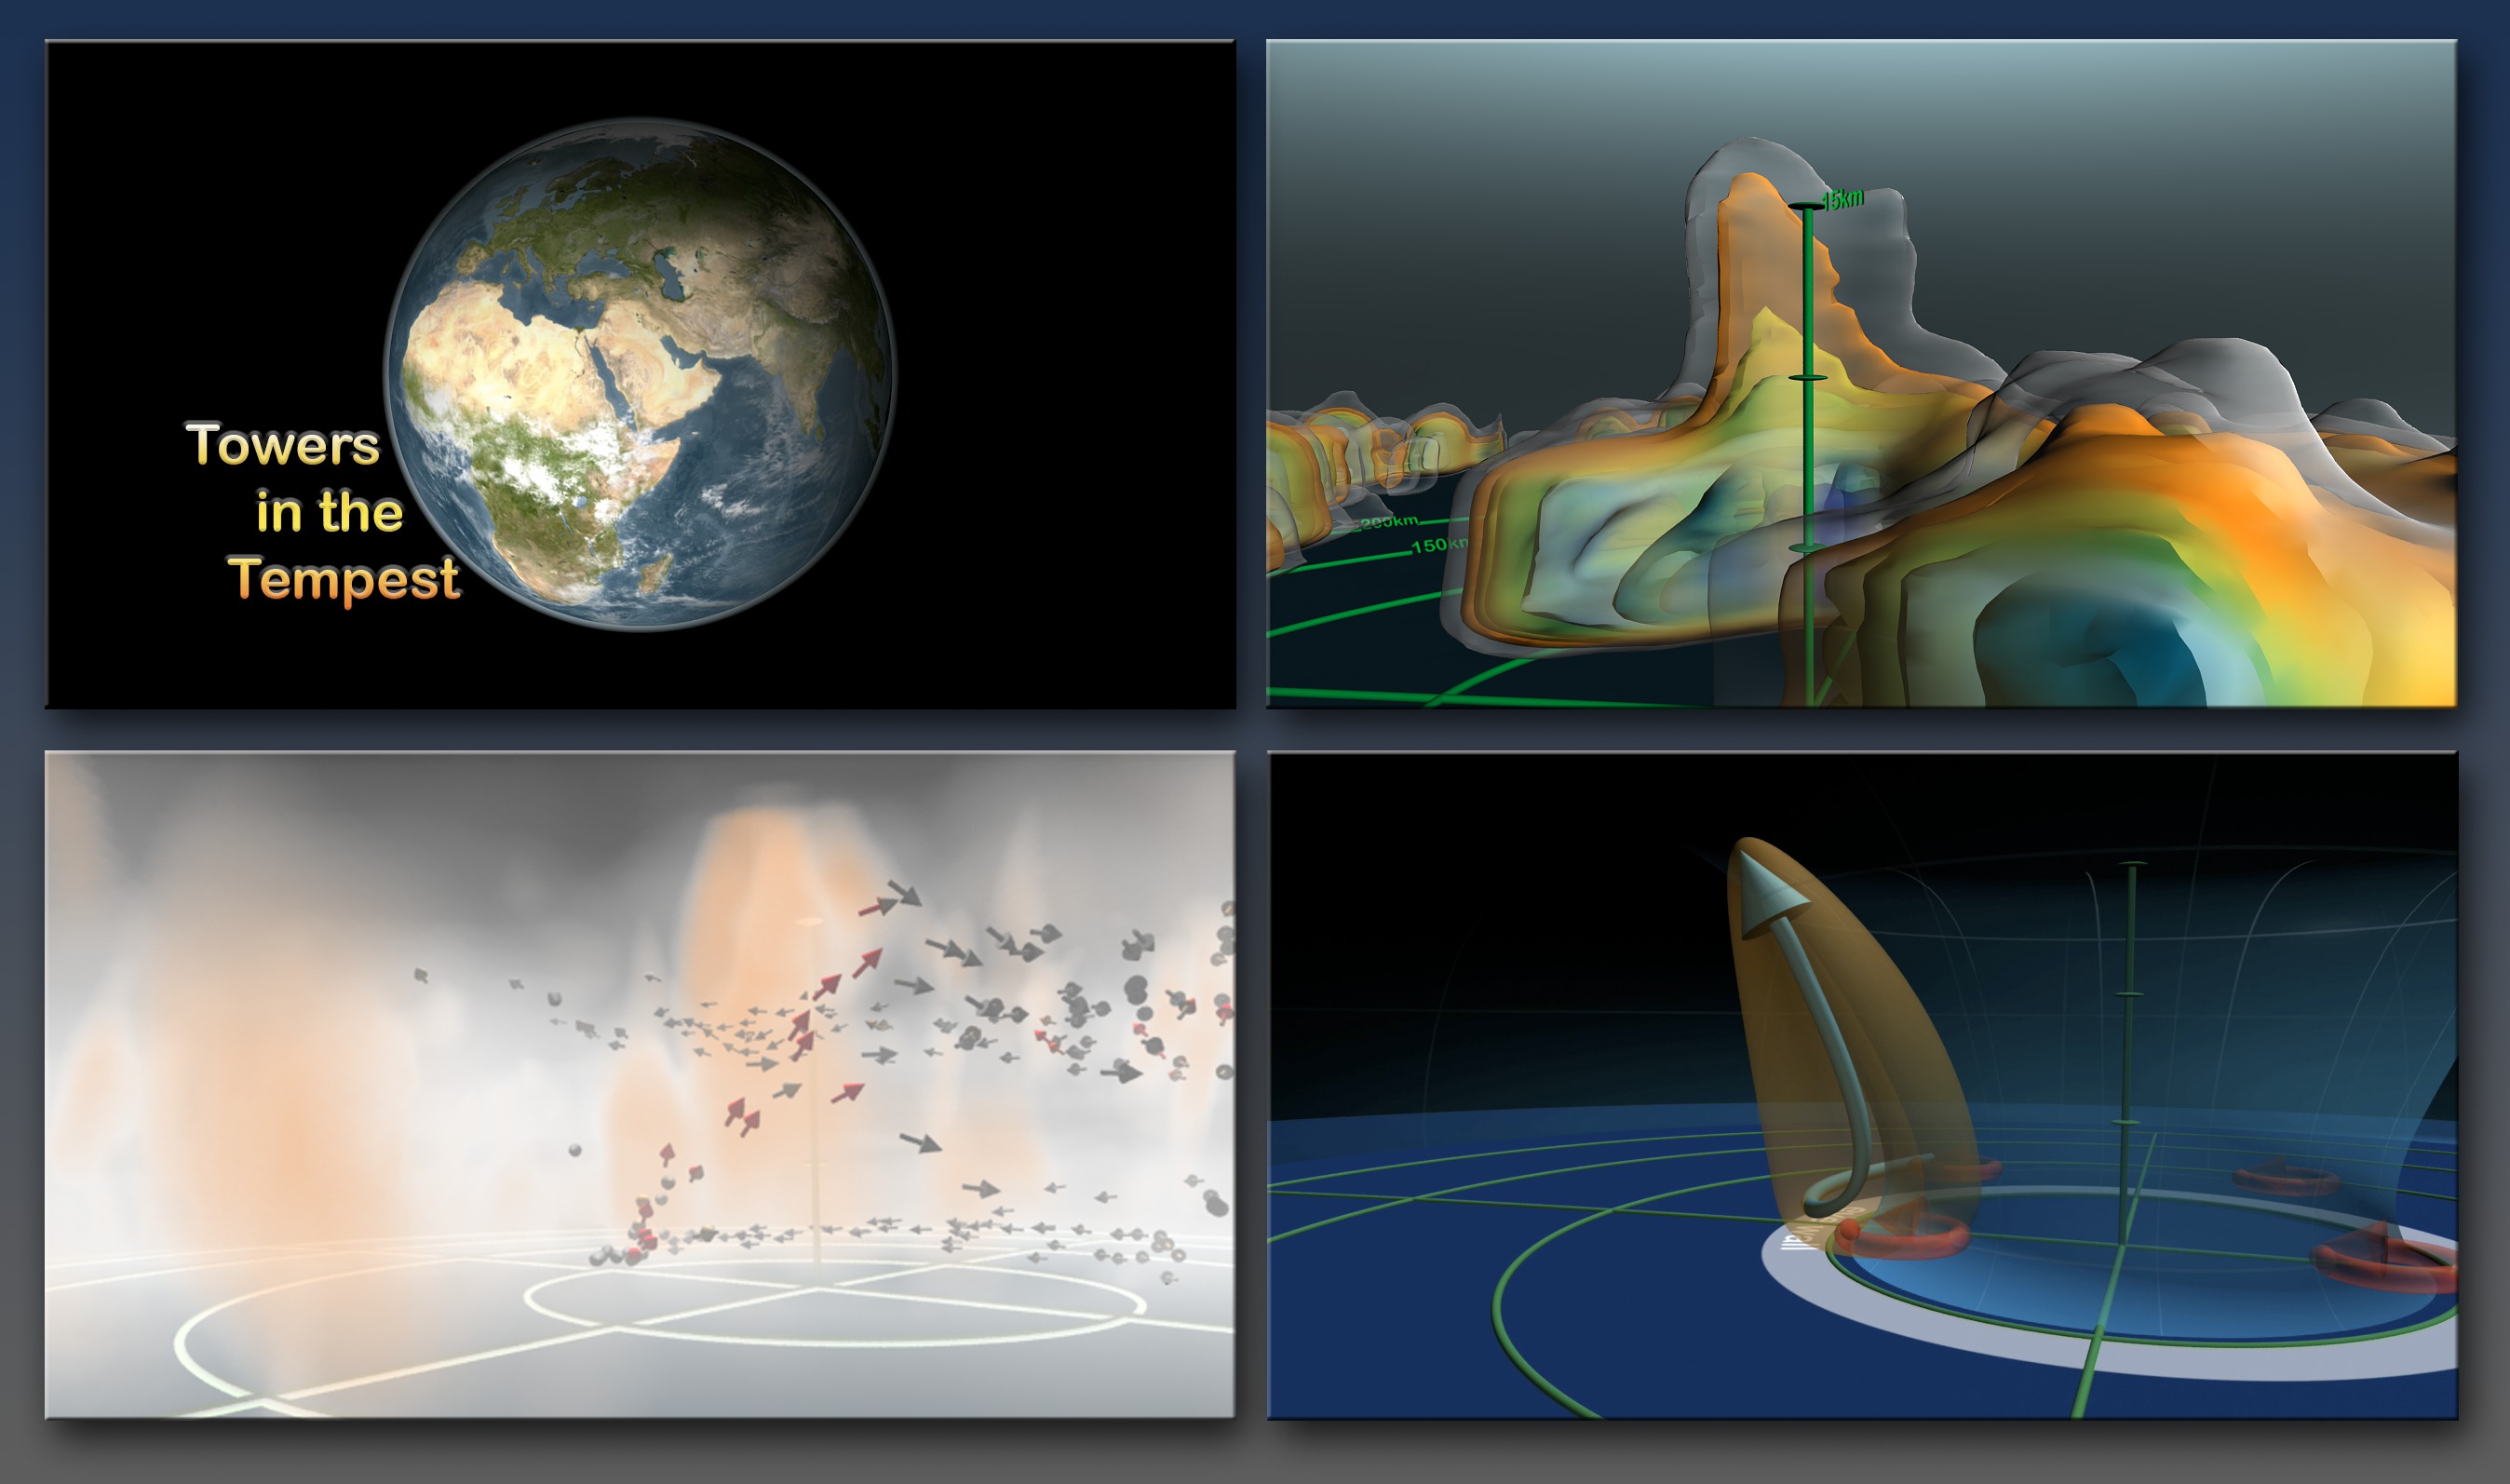
Go to this pageThis visualization won Honorable Mention in the National Science Foundation's Science and Engineering Visualization Challenge in September 2007. It was also shown during the SIGGRAPH 2008 Computer Animation Festival in Los Angeles, CA. 'Towers in the Tempest' is a 4.5 minute narrated animation that explains recent scientific insights into how hurricanes intensify. This intensification can be caused by a phenomenon called a 'hot tower'. For the first time, research meteorologists have run complex simulations using a very fine temporal resolution of 3 minutes. Combining this simulation data with satellite observations enables detailed study of 'hot towers'. The science of 'hot towers' is described using: observed hurricane data from a satellite, descriptive illustrations, and volumetric visualizations of simulation data. The first section of the animation shows actual data from Hurricane Bonnie observed by NASA's Tropical Rainfall Measuring Mission (TRMM) spacecraft. Three dimensional precipitation radar data reveal a strong 'hot tower' in Hurricane Bonnie's internal structure. The second section uses illustrations to show the dynamics of a hurricane and the formation of 'hot towers'. 'Hot towers' are formed as air spirals inward towards the eye and is forced rapidly upwards, accelerating the movement of energy into high altitude clouds. The third section shows these processes using volumetric cloud, wind, and vorticity data from a supercomputer simulation of Hurricane Bonnie. Vertical wind speed data highlights a 'hot tower'. Arrows representing the wind field move rapidly up into the 'hot tower, boosting the energy and intensifying the hurricane. Combining satellite observations with super-computer simulations provides a powerful tool for studying Earth's complex systems. The complete script is available here . The storyboard is available here . There is also a movie of storyboard drawings with narration below. ||
27 Storms: Arlene to Zeta
Go to this pageMany records were broken during the 2005 Atlantic hurricane season including the most hurricanes ever, the most category 5 hurricanes, and the most intense hurricane ever recorded in the Atlantic as measured by atmospheric pressure. This visualization shows all 27 named storms that formed in the 2005 Atlantic hurricane season and examines some of the conditions that made hurricane formation so favorable.The animation begins by showing the regions of warm water that are favorable for storm development advancing northward through the peak of hurricane season and then receding as the waters cool. The thermal energy in these warm waters powers the hurricanes. Strong shearing winds in the troposphere can disrupt developing young storms, but measurements indicate that there was very little shearing wind activity in 2005 to impede storm formation.Sea surface temperatures, clouds, storm tracks, and hurricane category labels are shown as the hurricane season progresses.This visualization shows some of the actual data that NASA and NOAA satellites measured in 2005 — data used to predict the paths and intensities of hurricanes. Satellite data play a vital role in helping us understand the land, ocean, and atmosphere systems that have such dramatic effects on our lives.NOTE: This animation shows the named storms from the 2005 hurricane season. During a re-analysis of 2005, NOAA's Tropical Prediction Center/National Hurricane Center determined that a short-lived subtropcial storm developed near the Azores Islands in late September, increasing the 2005 tropical storm count from 27 to 28. This storm was not named and is not shown in this animation.'27 Storms: Arlene to Zeta' played in the SIGGRAPH 2007 Computer Animation Festival in August 2007. It was also a finalist in the 2006 NSF Science and Engineering Visualization Challenge. ||
Hurricanes
Go to this pageHurricanes are the most powerful accumulations of energy on Earth. Nothing else even comes close. They are fearsome tropical storms that spring to life roughly the same time every year, churning up oceans and shredding the nerves of residents who live along coastal zones.But hurricanes are really just manifestations of natural processes interacting. As such, they provide unusual opportunities for scientific research, and if recent history is any guide, the beginning of the twenty-first century augurs a new era in hurricane understanding.Using NASA's extraordinary fleet of Earth observing instruments, scientists have recently made discoveries about the behavior and nature of these gigantic storms. It turns out that they often begin in unexpected, distant places around the globe; they can alter the course of other storms trailing behind; they can stretch their arms hundreds of miles in all directions. Observations from space have enabled NASA and other research institutions to develop sophisticated computer models, too. These models allow scientists to simulate and test hypothesizes about hurricanes, which in turn facilitate development of new, more accurate predictive tools. ||
Behold, A Whirlwind Came: The Science of Tracking Hurricanes
Go to this pageThis documentary-style video shows how NASA computer modeling research is contributing to an improved understanding and forecasts of hurricanes. It weaves interviews of three Goddard Space Flight Center scientists with scientific visualizations and live-action footage of hurricanes and the scientists studying them. The video focuses on application of the NASA finite-volume General Circulation Model (fvGCM) to the 2004 Atlantic Ocean hurricane season. Over the last 20 years, the National Oceanic and Atmospheric Administration's National Hurricane Center and National Weather Service have produced enormous improvements in hurricane forecasting. However, by running at ~25-kilometer resolution (twice that of current operational forecasts), the NASA fvGCM has shown in some cases an accuracy of landfall prediction on the order of 100 kilometers up to 5 days in advance. Initial evaluation suggests that the potential exists for dramatic improvements in warning time and intensity forecasts for tropical cyclones around the globe. NASA has begun collaborating with the National Weather Service and other agencies worldwide to improve forecasts so that, among other advantages, local authorities can narrow areas for evacuation. The video was produced for the TerraLink exhibit at the Maryland Science Center in Baltimore.Winner of the 2005 Video Competition Crystal Award of Excellence. ||


