Operation IceBridge - Antarctic Campaigns: Produced Videos
2010
IceBridge Antarctic Peninsula Flight Highlights - Nov. 13, 2010
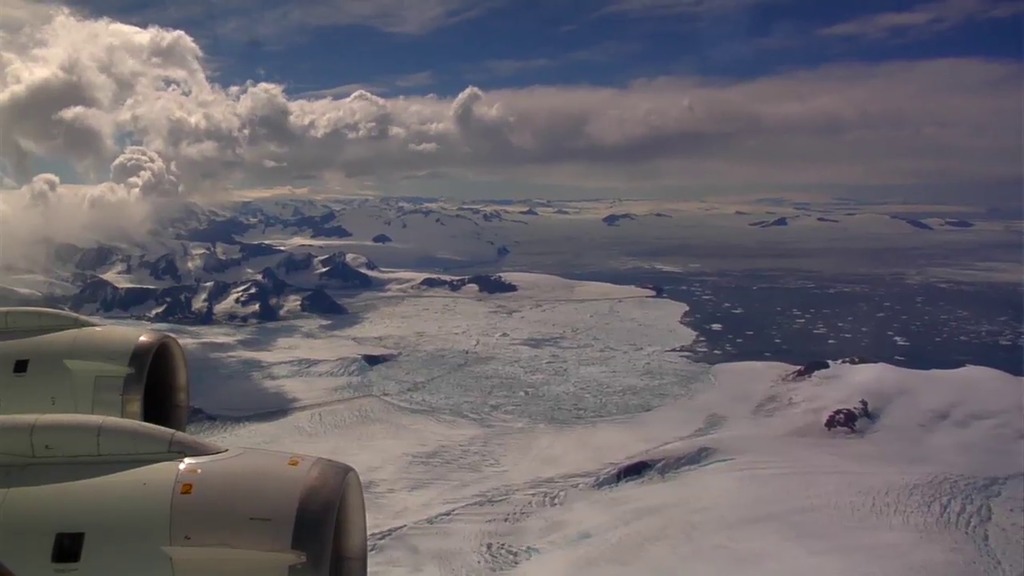
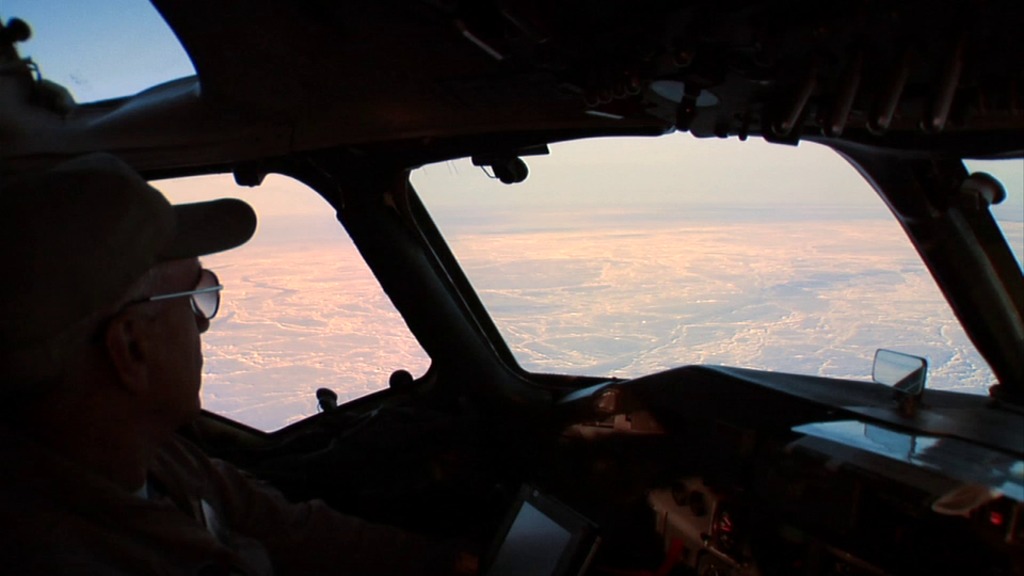
Go to this pageThe IceBridge science team and DC-8 crew flew a mission over the Antarctic Peninsula on Saturday, November 13th. This video provides a snapshot of the flight from the field and describes the challenges faced with weather and terrain. All instruments collected data for several glaciers before the weather conditions forced an early return to Punta Arenas. ||
IceBridge Kicks Off Antarctic 2010 Campaign
Go to this pageOn October 18th, NASA's Operation IceBridge scientists and the DC-8 crew departed for Punta Arenas, Chile where they will begin the Antarctic 2010 phase of the mission. For the next five weeks, instrumnents aboard the DC-8 will collect data to determine surface elevation and ice characteristics near and over Antarctica. ||
2011
Operation IceBridge Discovers Massive Crack In Ice Shelf
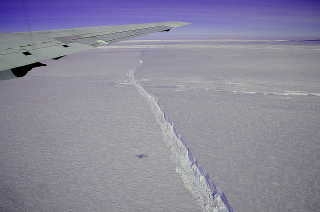
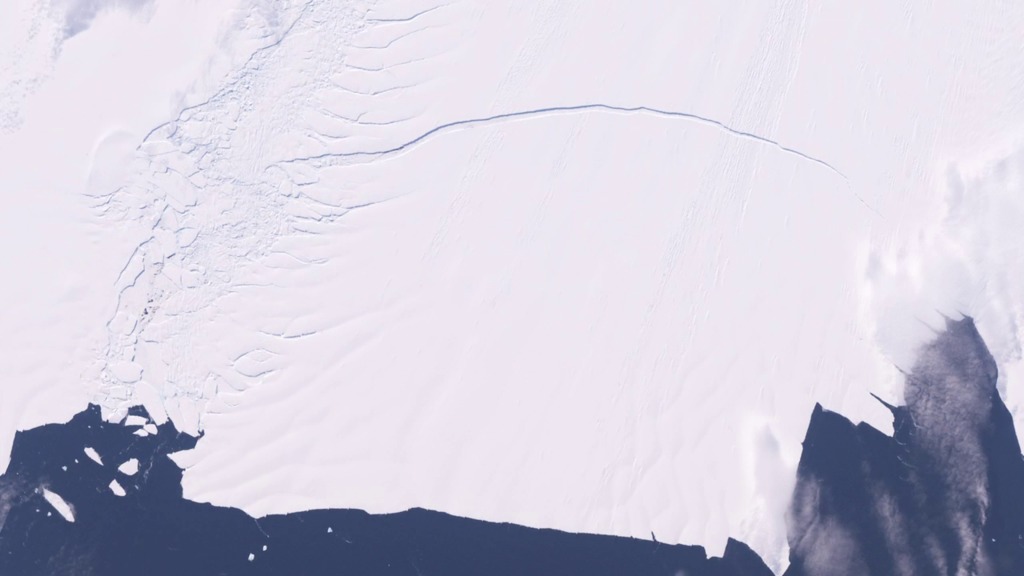
Go to this pageNASA's DC-8 flew over the Pine Island Glacier Ice Shelf on Oct. 14, 2011, as part of Operation IceBridge. A large, long-running crack was plainly visible across the ice shelf. The DC-8 took off on Oct. 26, 2011, to collect more data on the ice shelf and the crack. The area beyond the crack that could calve in the coming months covers about 310 square miles (800 sq. km). ||
Operation IceBridge Antarctica 2011 Mission Preview
Go to this pageIn preparation for Operation IceBridge's Antarctica 2011 campaign, flight crews at NASA Dryden worked to outfit the DC-8 aircraft — NASA's long-haul "workhorse" — with an array of different instruments designed to measure sea ice, ice sheets, and even the bedrock below Antarctic glaciers. ||
West Antarctica's Weak Spot
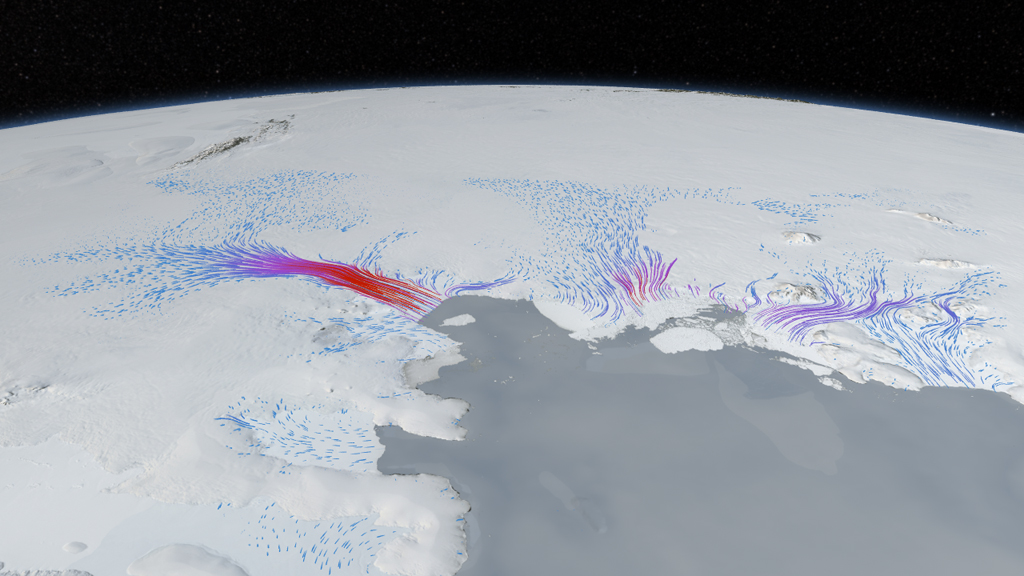
Go to this pagePine Island Glacier was first called the "weak underbelly" of the West Antarctic Ice Sheet almost 30 years ago. The nickname stuck in glaciology circles because scientists still fear it is true. Pine Island, or PIG, as it's often called, drains about 10 percent of the entire West Antarctic Ice Sheet. In 2006, the glacier began losing ice mass at an even faster rate than it had before. For scientists concerned with how much PIG could contribute to sea level rise if it lives up to its moniker, there are two key questions. First, why is it changing? Scientists are investigating, among other causes, how the circulation of warming waters under the ice shelf could lead to thinning. Second, how much is it changing? Following the end of the laser altimetry mission ICESat in 2009, NASA launched an airborne campaign called Operation IceBridge to measure critical polar regions. A laser altimeter onboard NASA's DC-8 research airplane has observed PIG continuing the rapid ice loss—measured as a change in elevation—that began to accelerate in 2006. Watch in the visualization below, an analysis partly based on satellite and aircraft data, how NASA has charted PIG's increasing changes. ||
2012
Operation IceBridge 2012 Antarctic Campaign video series
Go to this pageThis year Operation IceBridge completed 16 science flights over Antarctica and nearby sea ice, flying once again out of Punta Arenas, Chile. This video series contains a diverse set of products reflecting the science and adventure of the mission. ||
Sea Ice Atlas
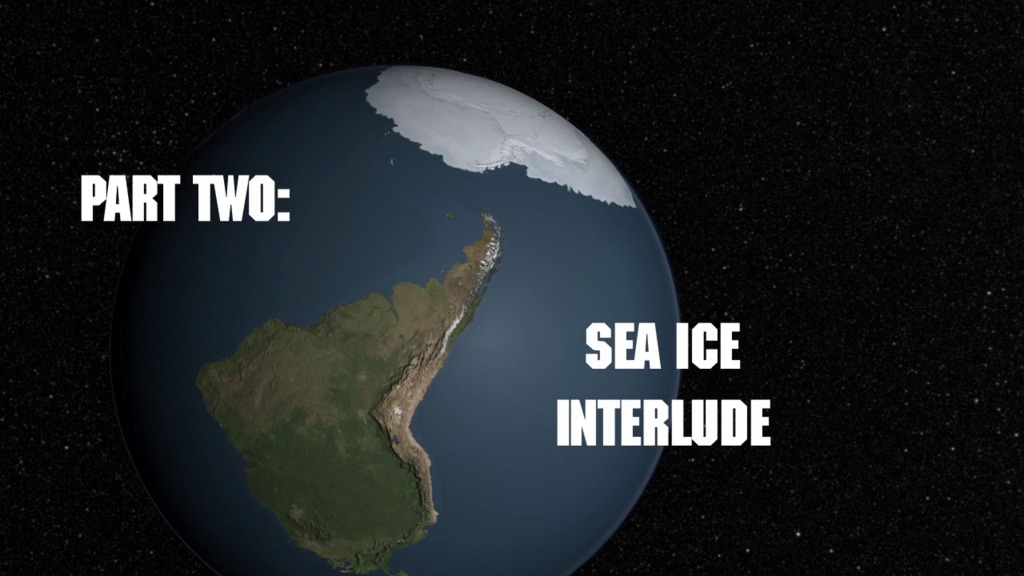
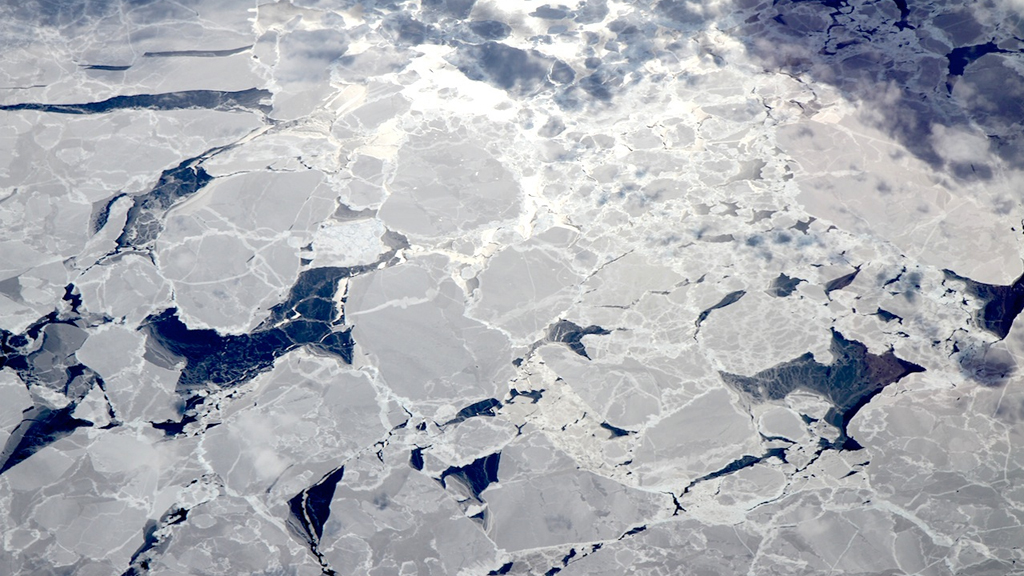
Go to this pageFlying long, aerial transects over the center of a sea ice pack rendered nearly featureless by snow can get a bit monotonous. But when NASA's Operation IceBridge aircraft travels along the varied margins of the ice, even seasoned researchers take a break from monitoring their instruments to steal a quick view of the icescape below. With its radar and laser data, Operation IceBridge is working to extend the long-term record of how ice at the poles is changing from year to year. During spring in Antarctica, the environment constantly shapes the sea ice that surrounds the continent. Ice thaws back into the water when temperatures warm, freezes into new layers when cold, and splinters, crashes and rafts on top of itself when pushed by winds and ocean currents. Watch the video to explore the different types of sea ice seen by Operation IceBridge during its 2012 Antarctic campaign. ||
Flying through the Rift: An update on the crack in the P.I.G.
Go to this pageNASA's DC-8 flew over the Pine Island Glacier Ice Shelf on Oct. 14, 2011, as part of Operation IceBridge. A large, long-running crack was plainly visible across the ice shelf. The DC-8 took off on Oct. 26, 2011, to collect more data on the ice shelf and the crack. The area beyond the crack that could calve in the coming months covers about 310 square miles (800 sq. km). ||
Ice Canyon
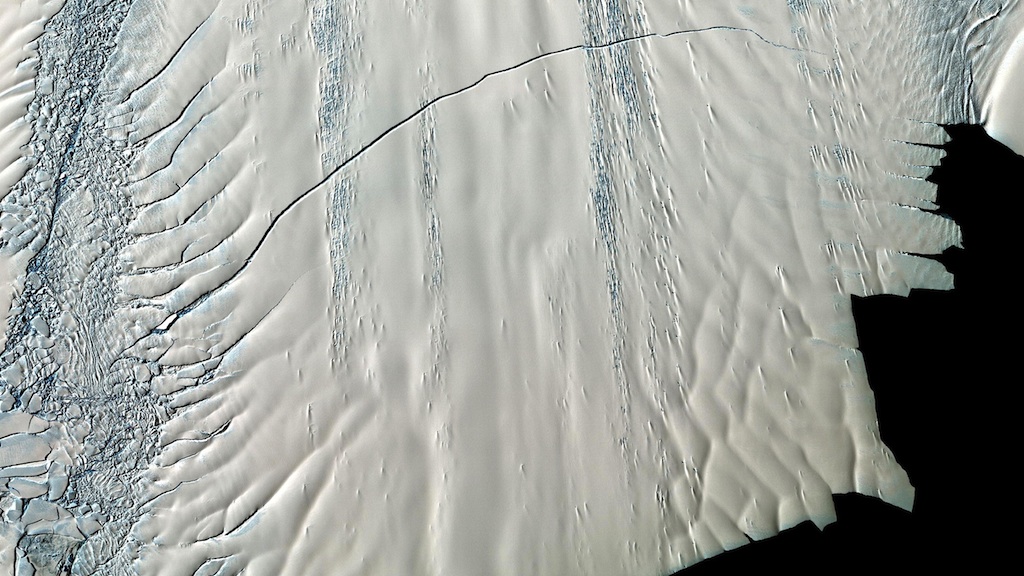
Go to this pageDuring a research flight over West Antarctica in the fall of 2011, scientists and flight crew with NASA's Operation IceBridge looked out their windows and saw what appeared to be a giant crack across the ice. Satellite imagery confirmed the view: Pine Island Glacier's ice shelf was breaking apart. The team later flew directly over the emerging rift, collecting a series of downward-looking, high-definition photographs snapped every two seconds. Pieced together, these images created a 3D model of the crack, saturated with detail. A spacious crevasse twists and turns while collapsed ice boulders rest at the foot of sheer frozen walls. Watch the visualization below to take a soaring journey over and into this model view of the 150-foot-deep ice canyon. ||
2013
Operation IceBridge 2013 Antarctica Introduction
Go to this pageWith the successful landing of the NASA P-3 aircraft on McMurdo Station's seasonal sea ice runway, Operation IceBridge is opening the door to a whole new suite of remote science targets in Antarctica. ||
Antarctica Exposed
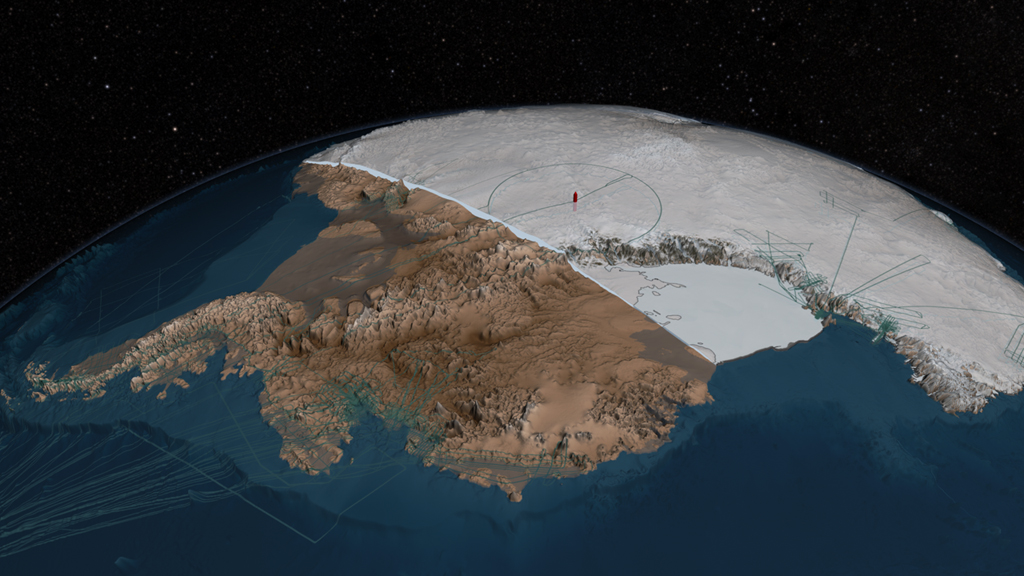
Go to this pageOur understanding of what lies beneath the world's biggest ice sheet has taken another leap forward. Thanks to work led by the British Antarctic Survey, scientists have a new 3D map of Antarctica’s ice and bedrock. The map, called Bedmap2, incorporates millions of new measurements, including data collected by NASA's ICESat satellite and airborne Operation IceBridge mission. The result is a virtual reconstruction of the continent’s bedrock topography and ice layers captured in never-before-seen detail. Antarctica plays a large role in the global climate system. The melting and emptying of its ice into the sea influences ocean currents and the rate of sea level rise. By having a precise map of Antarctica’s mountains, ridges, slopes and valleys—all of which affect how fast the continent's ice travels across the ice sheet—scientists can better predict future rates of ice flow. Watch the video to learn more. ||
Mapping Polar Ice
Go to this pageIn certain parts of Antarctica, the ice is disappearing—fast. To better understand how and why this is happening, NASA's Operation IceBridge mission uses a suite of advanced instruments aboard its DC-8 aircraft to survey the continent's layered ice deposits and underlying bedrock. One place scientists are looking at closely is the Getz Ice Shelf. The underside of this 300-mile-long floating tongue of ice hanging off West Antarctica is being eaten away by warm ocean currents. And a thin crack on its surface threatens to calve a large piece of it into the sea. In 2012, researchers mapped regions near the ice shelf's grounding line, the point where the ice leaves the support of land and begins to float on water, to determine how much ice is being lost to the ocean, and at what rate. Watch the video to learn more. ||
2014
Operation IceBridge 2013 Antarctic Campaign B-Roll
Go to this pageRaw video footage from Operation IceBridge's 2013 science campaign out of McMurdo Station Antartica ||
OIB: Fourwheeling Antarctica
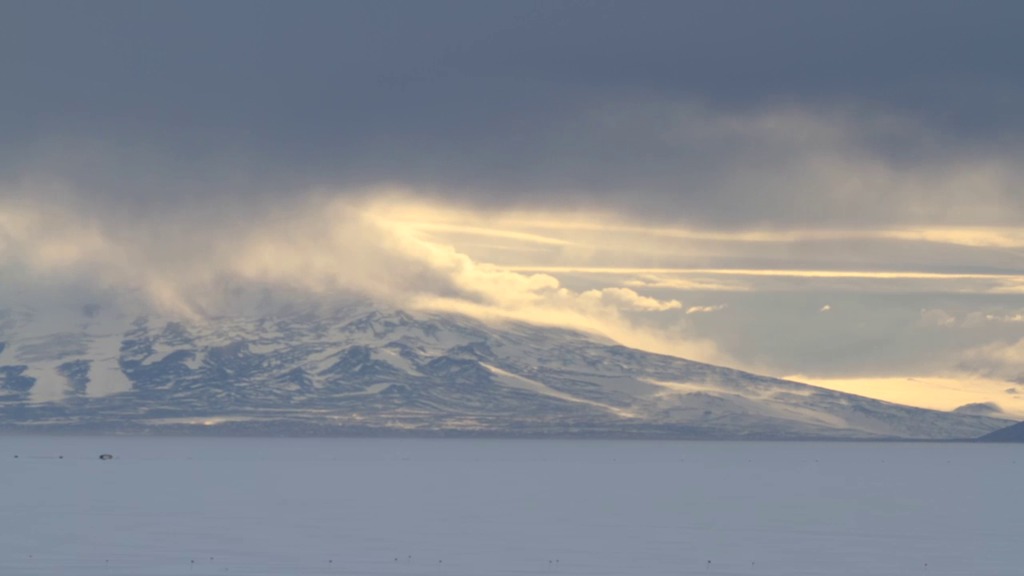
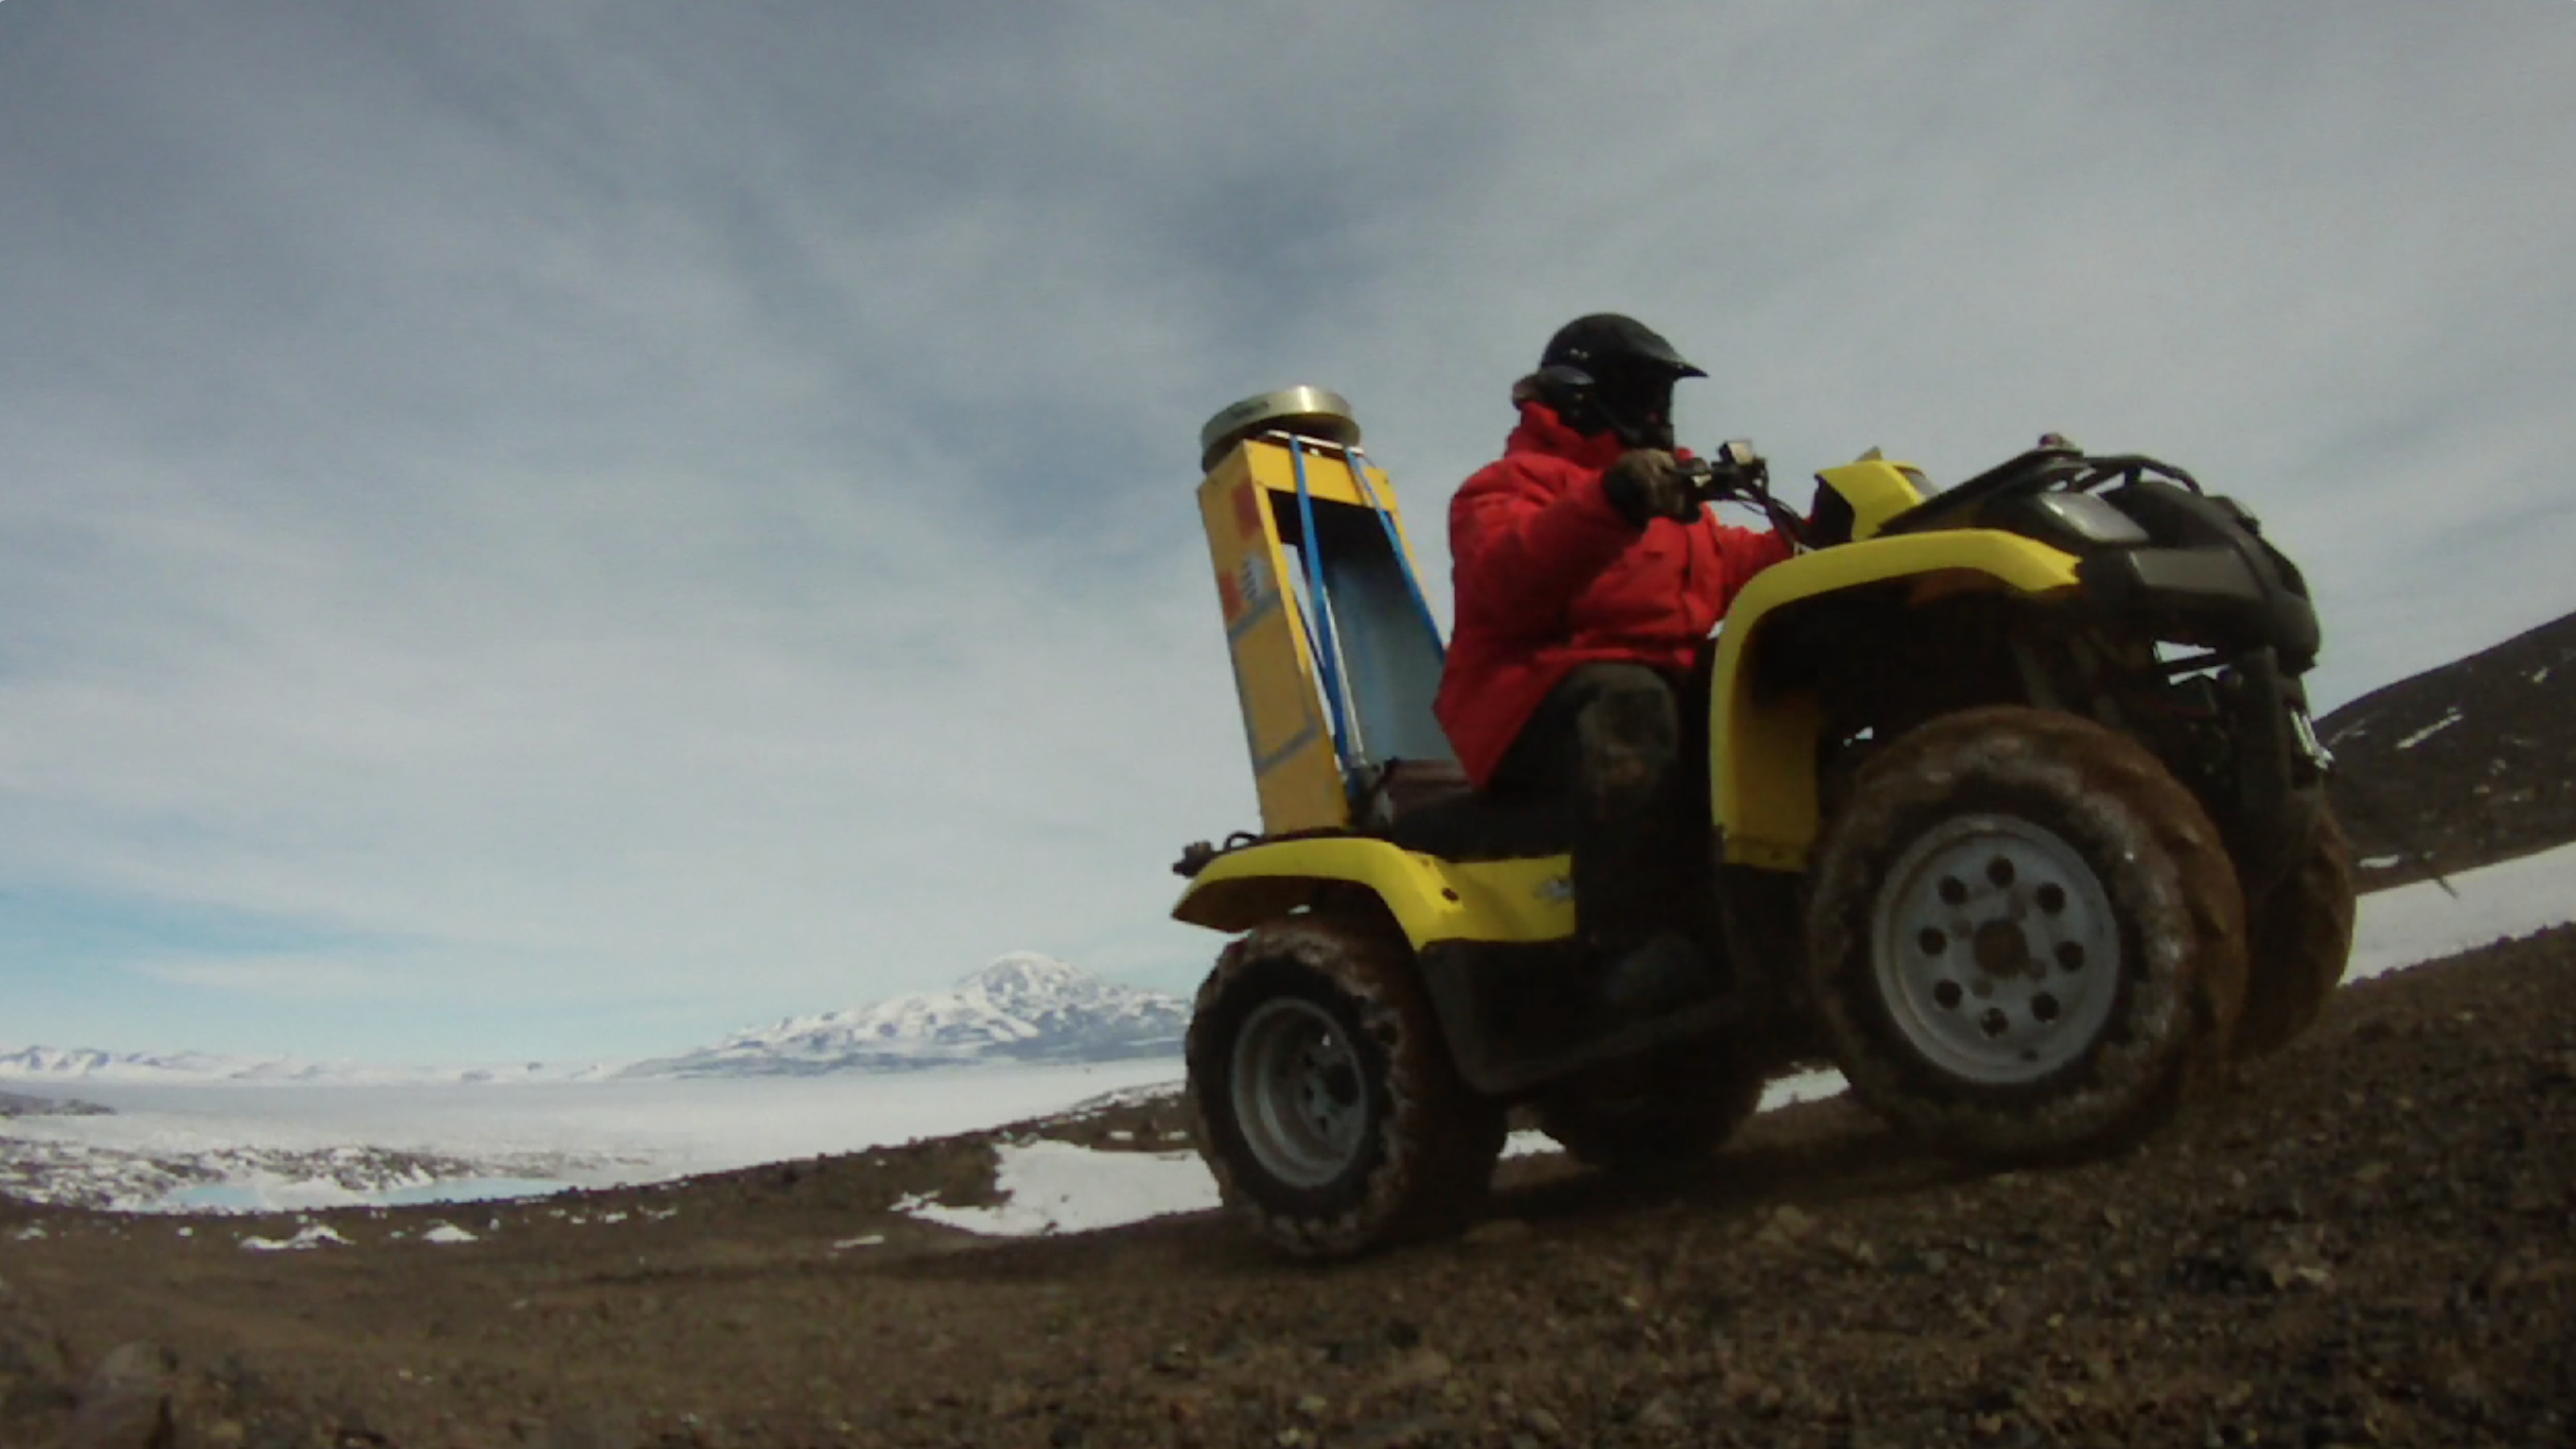
Go to this pageOperation IceBridge: Four-Wheeling in Antartica For complete transcript, click here. || Black_island_thumb-2_copy.png (2638x1484) [3.0 MB] || Black_island_thumb-2_copy_searchweb.png (320x180) [84.0 KB] || Black_island_thumb-2_copy_web.png (320x180) [84.0 KB] || Black_island_thumb-2_copy_thm.png (80x40) [8.8 KB] || Black_Island_full_720x480.webmhd.webm (960x540) [55.7 MB] || Black_Island_full_prores.mov (1280x720) [4.1 GB] || Black_Island_full_appletv.m4v (960x540) [117.7 MB] || Black_Island_full_youtube_hq.mov (1280x720) [275.4 MB] || Black_Island_full_1280x720.wmv (1280x720) [141.7 MB] || Black_Island_full_appletv_subtitles.m4v (960x540) [117.6 MB] || Black_Island_full_nasaportal.mov (640x360) [117.3 MB] || Black_Island_full_ipod_lg.m4v (640x360) [46.4 MB] || Black_Island_full_720x480.wmv (720x480) [124.0 MB] || Black_Island_CAP.en_US.srt [4.5 KB] || Black_Island_CAP.en_US.vtt [4.5 KB] || Black_Island_full_ipod_sm.mp4 (320x240) [25.0 MB] ||
OIB: McMurdo Accomplished, West Antarctic Calling
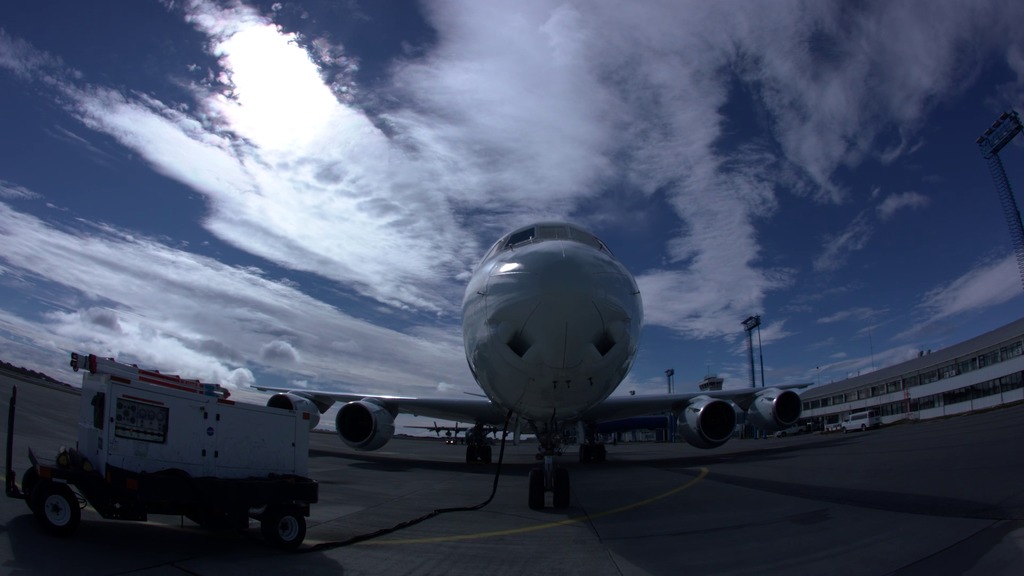
Go to this pageFor complete transcript, click here. || McMurdo_Punta_Arenas_handoff_youtube_hq00152_print.jpg (1024x576) [50.0 KB] || McMurdo_Punta_Arenas_handoff_youtube_hq_print.jpg (1024x576) [54.3 KB] || McMurdo_Punta_Arenas_handoff_youtube_hq_searchweb.png (320x180) [46.7 KB] || McMurdo_Punta_Arenas_handoff_youtube_hq_web.png (320x180) [46.7 KB] || McMurdo_Punta_Arenas_handoff_youtube_hq_thm.png (80x40) [3.7 KB] || McMurdo_Punta_Arenas_handoff_720x480.webmhd.webm (960x540) [29.3 MB] || McMurdo_Punta_Arenas_handoff_prores.mov (1280x720) [2.2 GB] || McMurdo_Punta_Arenas_handoff_1280x720.wmv (1280x720) [71.6 MB] || McMurdo_Punta_Arenas_handoff_youtube_hq.mov (1280x720) [122.4 MB] || McMurdo_Punta_Arenas_handoff_nasaportal.mov (640x360) [60.1 MB] || McMurdo_Punta_Arenas_handoff_720x480.wmv (720x480) [56.9 MB] || McMurdo_Punta_Arenas_handoff_ipod_lg.m4v (640x360) [24.9 MB] || McMurdo_Punta_Arenas_handoff.en_US.srt [2.9 KB] || McMurdo_Punta_Arenas_handoff.en_US.vtt [2.9 KB] || McMurdo_Punta_Arenas_handoff_ipod_sm.mp4 (320x240) [13.4 MB] ||
2016
IceBridge images of crack in Larsen C Ice Shelf
Go to this pageFlying low over the Earth’s southernmost continent, Operation IceBridge is wrapping up its eighth consecutive field season of mapping the ice sheet and glaciers of Antarctica, as well as the surrounding sea ice. With more than 300 hours logged in the air over 24 science flights, the mission is considering 2016 one of the most successful seasons yet. || IceBridgeAnt16_4.00600_print.jpg (1024x576) [97.3 KB] || IceBridgeAnt16_4.00600_searchweb.png (320x180) [82.8 KB] || IceBridgeAnt16_4.00600_web.png (320x180) [82.8 KB] || IceBridgeAnt16_4.00600_thm.png (80x40) [6.6 KB] || IceBridgeAnt16_4.mp4 (1920x1080) [163.1 MB] || IceBridgeAnt16_4.webm (1920x1080) [16.3 MB] || GSFC_20161208_IceBridge_m12449_IceBridge.en_US.vtt [3.0 KB] || GSFC_20161208_IceBridge_m12449_IceBridge.en_US.srt [3.1 KB] ||
2018
NASA's View of Pine Island Glacier's Latest Iceberg
Go to this pageLast week, Antarctica's Pine Island Glacier calved a massive iceberg, known as Iceberg B-46, into the Amundsen Sea. Pine Island has lost several large icebergs in the last few years -- it's one of the most rapidly melting glaciers in the Antarctic and a significant contributor to sea level rise.NASA's Operation IceBridge flew over Pine Island Glacier on Nov. 7, capturing images and collecting data over the newly formed iceberg and remaining glacier.Read more about the new iceberg. ||
2019
NASA’s Operation IceBridge Completes Eleven Years of Polar Surveys
Go to this pageMusic:Foraging At Duskby Benjamin James Parsons [PRS];Orchestra Grooveby James Alexander Dorman [PRS];Watching Ladybirdsby Benjamin James Parsons [PRS];Nanofiberby Andrew Michael Britton [PRS], David Stephen Goldsmith [PRS]Complete transcript available. || OIBTop10_FINAL_COLOR.00_00_58_00.Still001.jpg (1920x1080) [743.5 KB] || OIBTop10_2019.mov (1920x1080) [1.1 GB] || OIBTop10_2019.webm (960x540) [139.0 MB] || OIBTop10_2019.mp4 (1920x1080) [542.3 MB] || OIBTop10_FINAL_COLOR.en_US.srt [6.4 KB] || OIBTop10_FINAL_COLOR.en_US.vtt [6.4 KB] ||




![Music: Moonstone by Rainmaker [PRS]Complete transcript available.](/vis/a010000/a013100/a013110/Bergs_print.jpg)
