Operation IceBridge - SVS Visualizations
Arctic
- Produced Video
- Produced Video
- Visualization
- Produced Video
- Produced Video
- Visualization
Antarctic
West Antarctic Glacier Ice Flows and Elevation Change
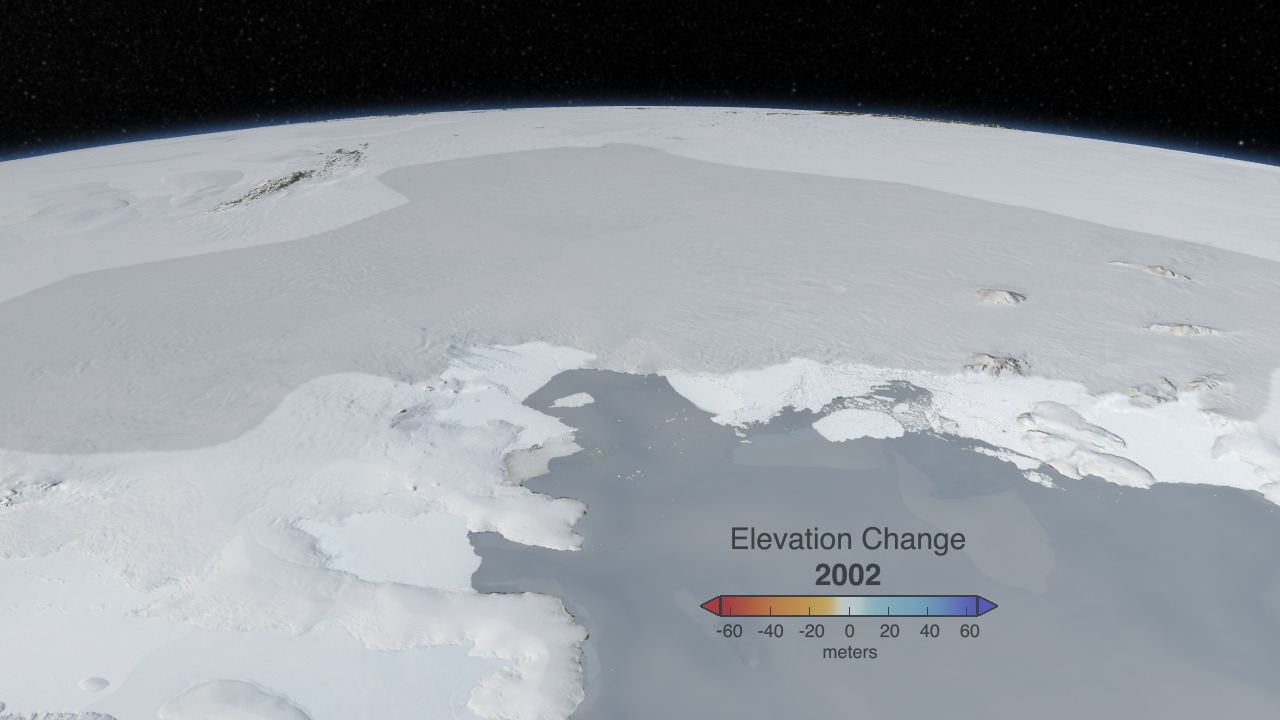
Go to this pageThis animation shows glacier changes detected by ATM, ICESat and ice bridge data in the highly dynamic Amundsen Embayment of West Antarctica. We know that ice speeds in this area have increased dramatically from the late 1990s to the present as the ice shelves in this area have thinned and the bottom of the ice has lost contact with the bed beneath. As the ice has accelerated, ice upstream of the coast must be stretched more vigorously, causing it to thin. NASA-sponsored aircraft missions first measured the ice surface height in this region in 2002, followed by ICESat data between 2002 and 2009. Ice Bridge aircraft have measured further surface heights in 2009 and 2010, and these measurements continue today. Integrating these altimetry sources allows us to estimate surface height changes throughout the drainage regions of the most important glaciers in the region. We see large elevation changes at the coast on Thwaites glacier, at the center of the images, and large and accelerating elevation changes extending inland from the coast on Pine Island and Smith glaciers, to the left and right of the images, respectively. The changes on Pine Island and Smith glaciers mark these as potential continuing sources of ice to the sea, and they have been surveyed in 2011 by Ice Bridge aircraft and targeted for repeat measurements in coming years. ||
Operation IceBridge Flight Paths - Antarctica Fall 2010 Campaign
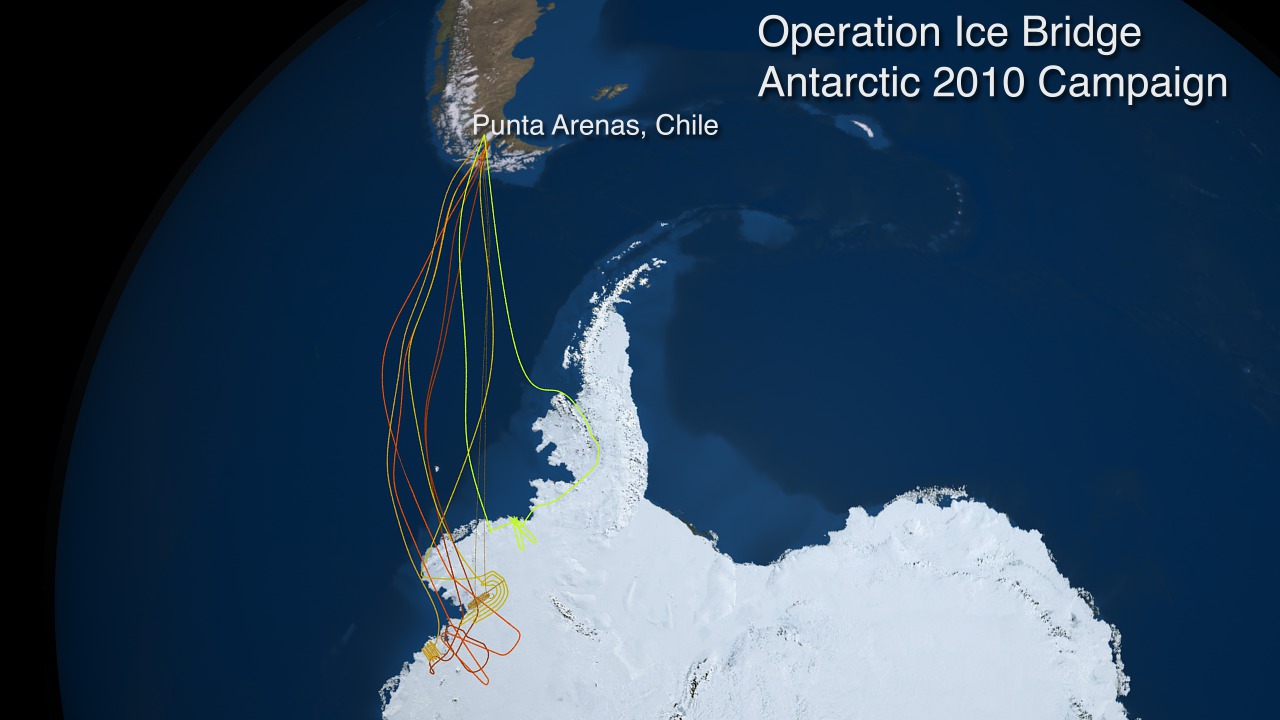
Go to this pageOperation IceBridge — a NASA airborne mission to observe changes in Earth's rapidly changing polar land ice and sea ice — is soon to embark on its fourth field season in October. The mission is now paralleled by a campaign to bring data to researchers as quickly as possible and to accelerate the analysis of those changes and how they may affect people and climate systems.Data from campaigns flown prior to the inception of IceBridge will also be archived at NSIDC. These include data from the Airborne Topographic Mapper (ATM) instrument; mountain glacier data from the University of Alaska Fairbanks; and deep radar bedmap data from University of Kansas radar instruments. Combined with NSIDC's existing complete archive of data from the Geoscience Laser Altimeter System (GLAS) instrument aboard ICESat, researchers will be able to access a rich repository of complementary measurements.IceBridge, a six-year NASA mission, is the largest airborne survey of Earth's polar ice ever flown. It will yield an unprecedented three-dimensional view of Arctic and Antarctic ice sheets, ice shelves and sea ice. These flights will provide a yearly, multi-instrument look at the behavior of the rapidly changing features of the Greenland and Antarctic ice.Data collected during IceBridge will help scientists bridge the gap in polar observations between NASA's ICESat — in orbit since 2003 — and ICESat-2, planned for late 2015. ICESat stopped collecting science data in 2009, making IceBridge critical for ensuring a continuous series of observations. ||
Operation IceBridge Flight Paths - Antarctica Fall 2009 Campaign
Go to this pageEarly in the 20th century, a succession of adventurers and scientists pioneered the exploration of Antarctica. A century later, they're still at it, albeit with a different set of tools. This fall, a team of modern explorers will fly over Earth's southern ice-covered regions to study changes to its sea ice, ice sheets, and glaciers as part of NASA's Operation Ice Bridge.Operation Ice Bridge is a six-year campaign of annual flights to each of Earth's polar regions. The first flights in March and April carried researchers over Greenland and the Arctic Ocean. This fall's Antarctic campaign, led by principal investigator Seelye Martin of the University of Washington, will begin the first sustained airborne research effort of its kind over the continent. Data collected by researchers will help scientists bridge the gap between NASA's Ice, Cloud and Land Elevation Satellite (ICESat) — which is operating the last of its three lasers — and ICESat-II, scheduled to launch in 2014.The Ice Bridge flights will help scientists maintain the record of changes to sea ice and ice sheets that have been collected since 2003 by ICESat. The flights will lack the continent-wide coverage that can be achieved by satellite, so researchers carefully select key target locations. But the flights will also turn up new information not possible from orbit, such as the shape of the terrain below the ice.Six flights are scheduled along Antarctica's peninsula, one along the Getz Ice Shelf, two over the Pine Island Glacier, and two others along the Amundsen coast to include the Thwaites, Smith, and Kohler glaciers. ||
Antarctica Exposed
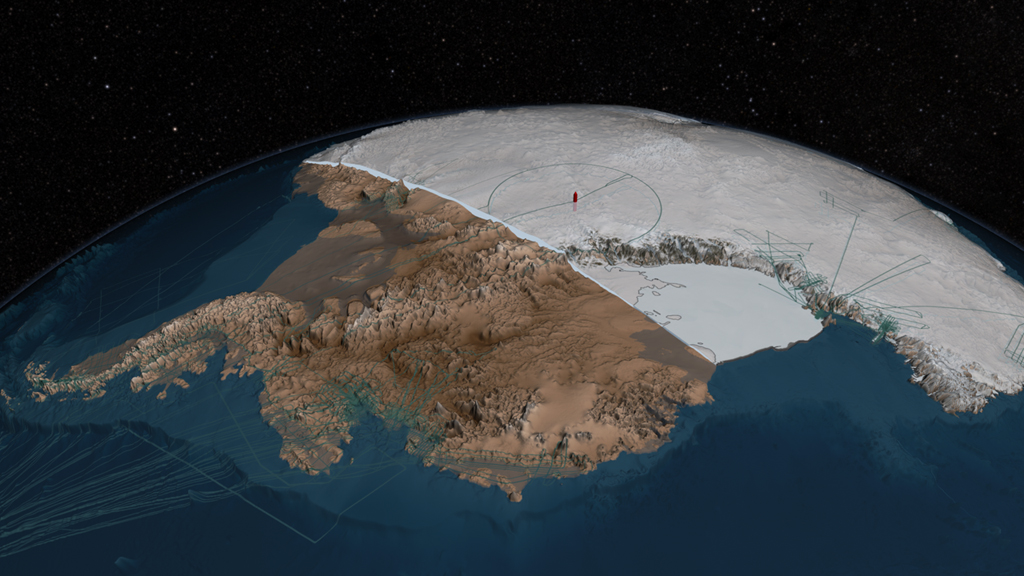
Go to this pageOur understanding of what lies beneath the world's biggest ice sheet has taken another leap forward. Thanks to work led by the British Antarctic Survey, scientists have a new 3D map of Antarctica’s ice and bedrock. The map, called Bedmap2, incorporates millions of new measurements, including data collected by NASA's ICESat satellite and airborne Operation IceBridge mission. The result is a virtual reconstruction of the continent’s bedrock topography and ice layers captured in never-before-seen detail. Antarctica plays a large role in the global climate system. The melting and emptying of its ice into the sea influences ocean currents and the rate of sea level rise. By having a precise map of Antarctica’s mountains, ridges, slopes and valleys—all of which affect how fast the continent's ice travels across the ice sheet—scientists can better predict future rates of ice flow. Watch the video to learn more. ||
West Antarctic Collapse
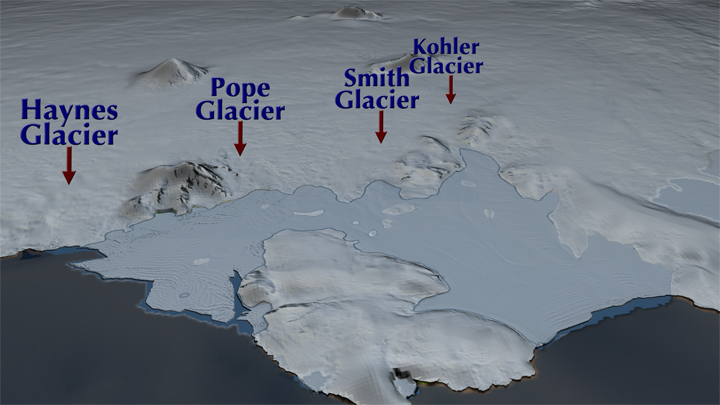
Go to this pageA new study by researchers at NASA and the University of California, Irvine, finds a rapidly melting section of the West Antarctic Ice Sheet appears to be in an irreversible state of decline, with nothing to stop the glaciers in this area from melting into the sea according to glaciologist and lead author Eric Rignot, of UC Irvine and NASA's Jet Propulsion Laboratory in Pasadena, California.Three major lines of evidence point to the glaciers' eventual demise: the changes in their flow speeds, how much of each glacier floats on seawater, and the slope and depth of the terrain they are flowing over. In a paper in April, Rignot's research group discussed the steadily increasing flow speeds of these glaciers over the past 40 years. This new study examines the other two lines of evidence.As glaciers flow out from land to the ocean, large expanses of ice behind their leading edges float on the seawater. The point on a glacier where it first loses contact with land is called the grounding line. Nearly all glacier melt occurs on the underside of the glacier beyond the grounding line, on the section floating on seawater. The Antarctic glaciers studied have thinned so much they are now floating above places where they used to sit solidly on land, which means their grounding lines are retreating inland.—><!——><!—Above: Move bar to compare the grounding line of the Smith Glacier from 1996 (left) to the location in 2011 (right) which has retreated inland 35 km during this time. The green line indicates the location of the 1996 grounding line. Download HTML to embed this in your web page.The bedrock topography is another key to the fate of the ice in this basin. All the glacier beds slope deeper below sea level as they extend farther inland. As the glaciers retreat, they cannot escape the reach of the ocean, and the warm water will keep melting them even more rapidly.Below are two edited versions of narrated stories released by JPL to explain this research. In addition are the two versions of the unedited animations provided to JPL to support the release. The unedited animations show the region of study by the JPL researchers, identifying by name the glaciers that terminate in the Amundsen Sea. One of the animations includes data showing the velocity of the glaciers in the region, flow vectors showing the movement of the glaciers colored by their velocity and a difference image showing the change in velocity between 1996 and 2008. The second animation does not include these datasets. Both versions of the animation draw close to the Smith Glacier and show how the grounding line of this glacier has moved inland 35 kilometers between 1996 and 2011. As the surface of the ice sheet is peeled away, showing the height and depth of the bedrock topography. Regions below sea level are shown in shades of brown while areas above sea level are shown in green. Sea level is shown in yellow. ||
Operations
Operation IceBridge Flight Lines 2009-2019
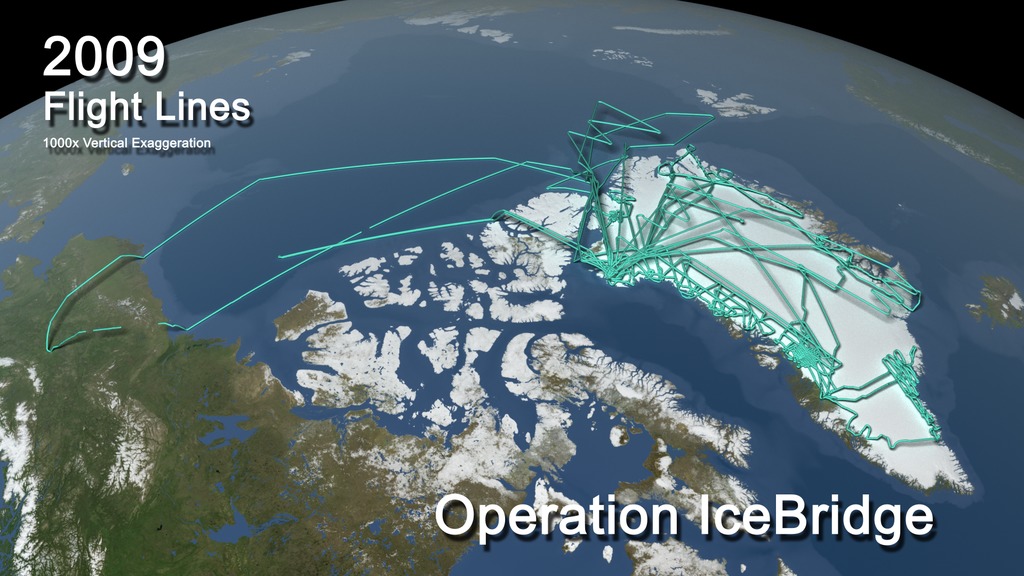
Go to this pageOperation Icebridge Flight Lines 2009-2019, Arctic || icebridge_arctic.0001_print.jpg (1024x576) [168.2 KB] || icebridge_arctic.0001_searchweb.png (320x180) [95.5 KB] || icebridge_arctic.0001_thm.png (80x40) [7.2 KB] || arctic (1920x1080) [128.0 KB] || icebridge_arctic_1080p30.mp4 (1920x1080) [32.8 MB] || icebridge_arctic_1080p30.webm (1920x1080) [6.5 MB] || icebridge_arctic_1080p30.mp4.hwshow [220 bytes] ||
DC-8 Floor plan animation
Go to this pageNASA's DC-8 aircraft is a four-engine jetliner capable of traveling at 40,000 feet for up to 12 hours. This spring, Ice Bridge will harness the power and longevity of the DC-8 to conduct both high- and low-altitude flights for sea and land ice surveys. A number of cutting-edge science instruments are onboard . This conceptual animation shows the aircraft and the locations of all of the instruments on the DC-8 for the spring 2010 mission. ||
Laser Radar Animation
Go to this pageLaser and radar instruments aboard NASA aircraft provide measurements of the snow and ice surface and down to the bedrock under the ice. Lasers, with a shorter wavelength, measure the surface elevation of the snow or ice to within a fraction of an inch. Radar instruments utilize a longer wavelength and can penetrate the ice to "see" below the surface, providing a profile of ice characteristics and also the shape of the bedrock. This information is critical for understanding how and why the world's biggest ice masses are changing. ||
