Presentation by Greg Shirah
Visuals
Great Zoom into/out of New Orleans, Louisiana: Ernest N. Morial Convention Center
Go to this pageUsing data from different spacecraft and some powerful computer technology, visualizers at the Goddard Space Flight Center present you with a collection of American cities in a way you have never seen them before. Starting with our camera high above the Earth, we rush in towards the surface at what would be an impossible speed for any known vehicle. Passing through layers of atmosphere, the colors of our destinations shimmer with their own unique characteristics, and suddenly we find ourselves floating in virtual space just above the ground.This zoom in to the Ernest N. Morial Convention Center in New Orleans, Louisiana was created for a presentation at SIGGRAPH 2009. ||
Towers in the Tempest
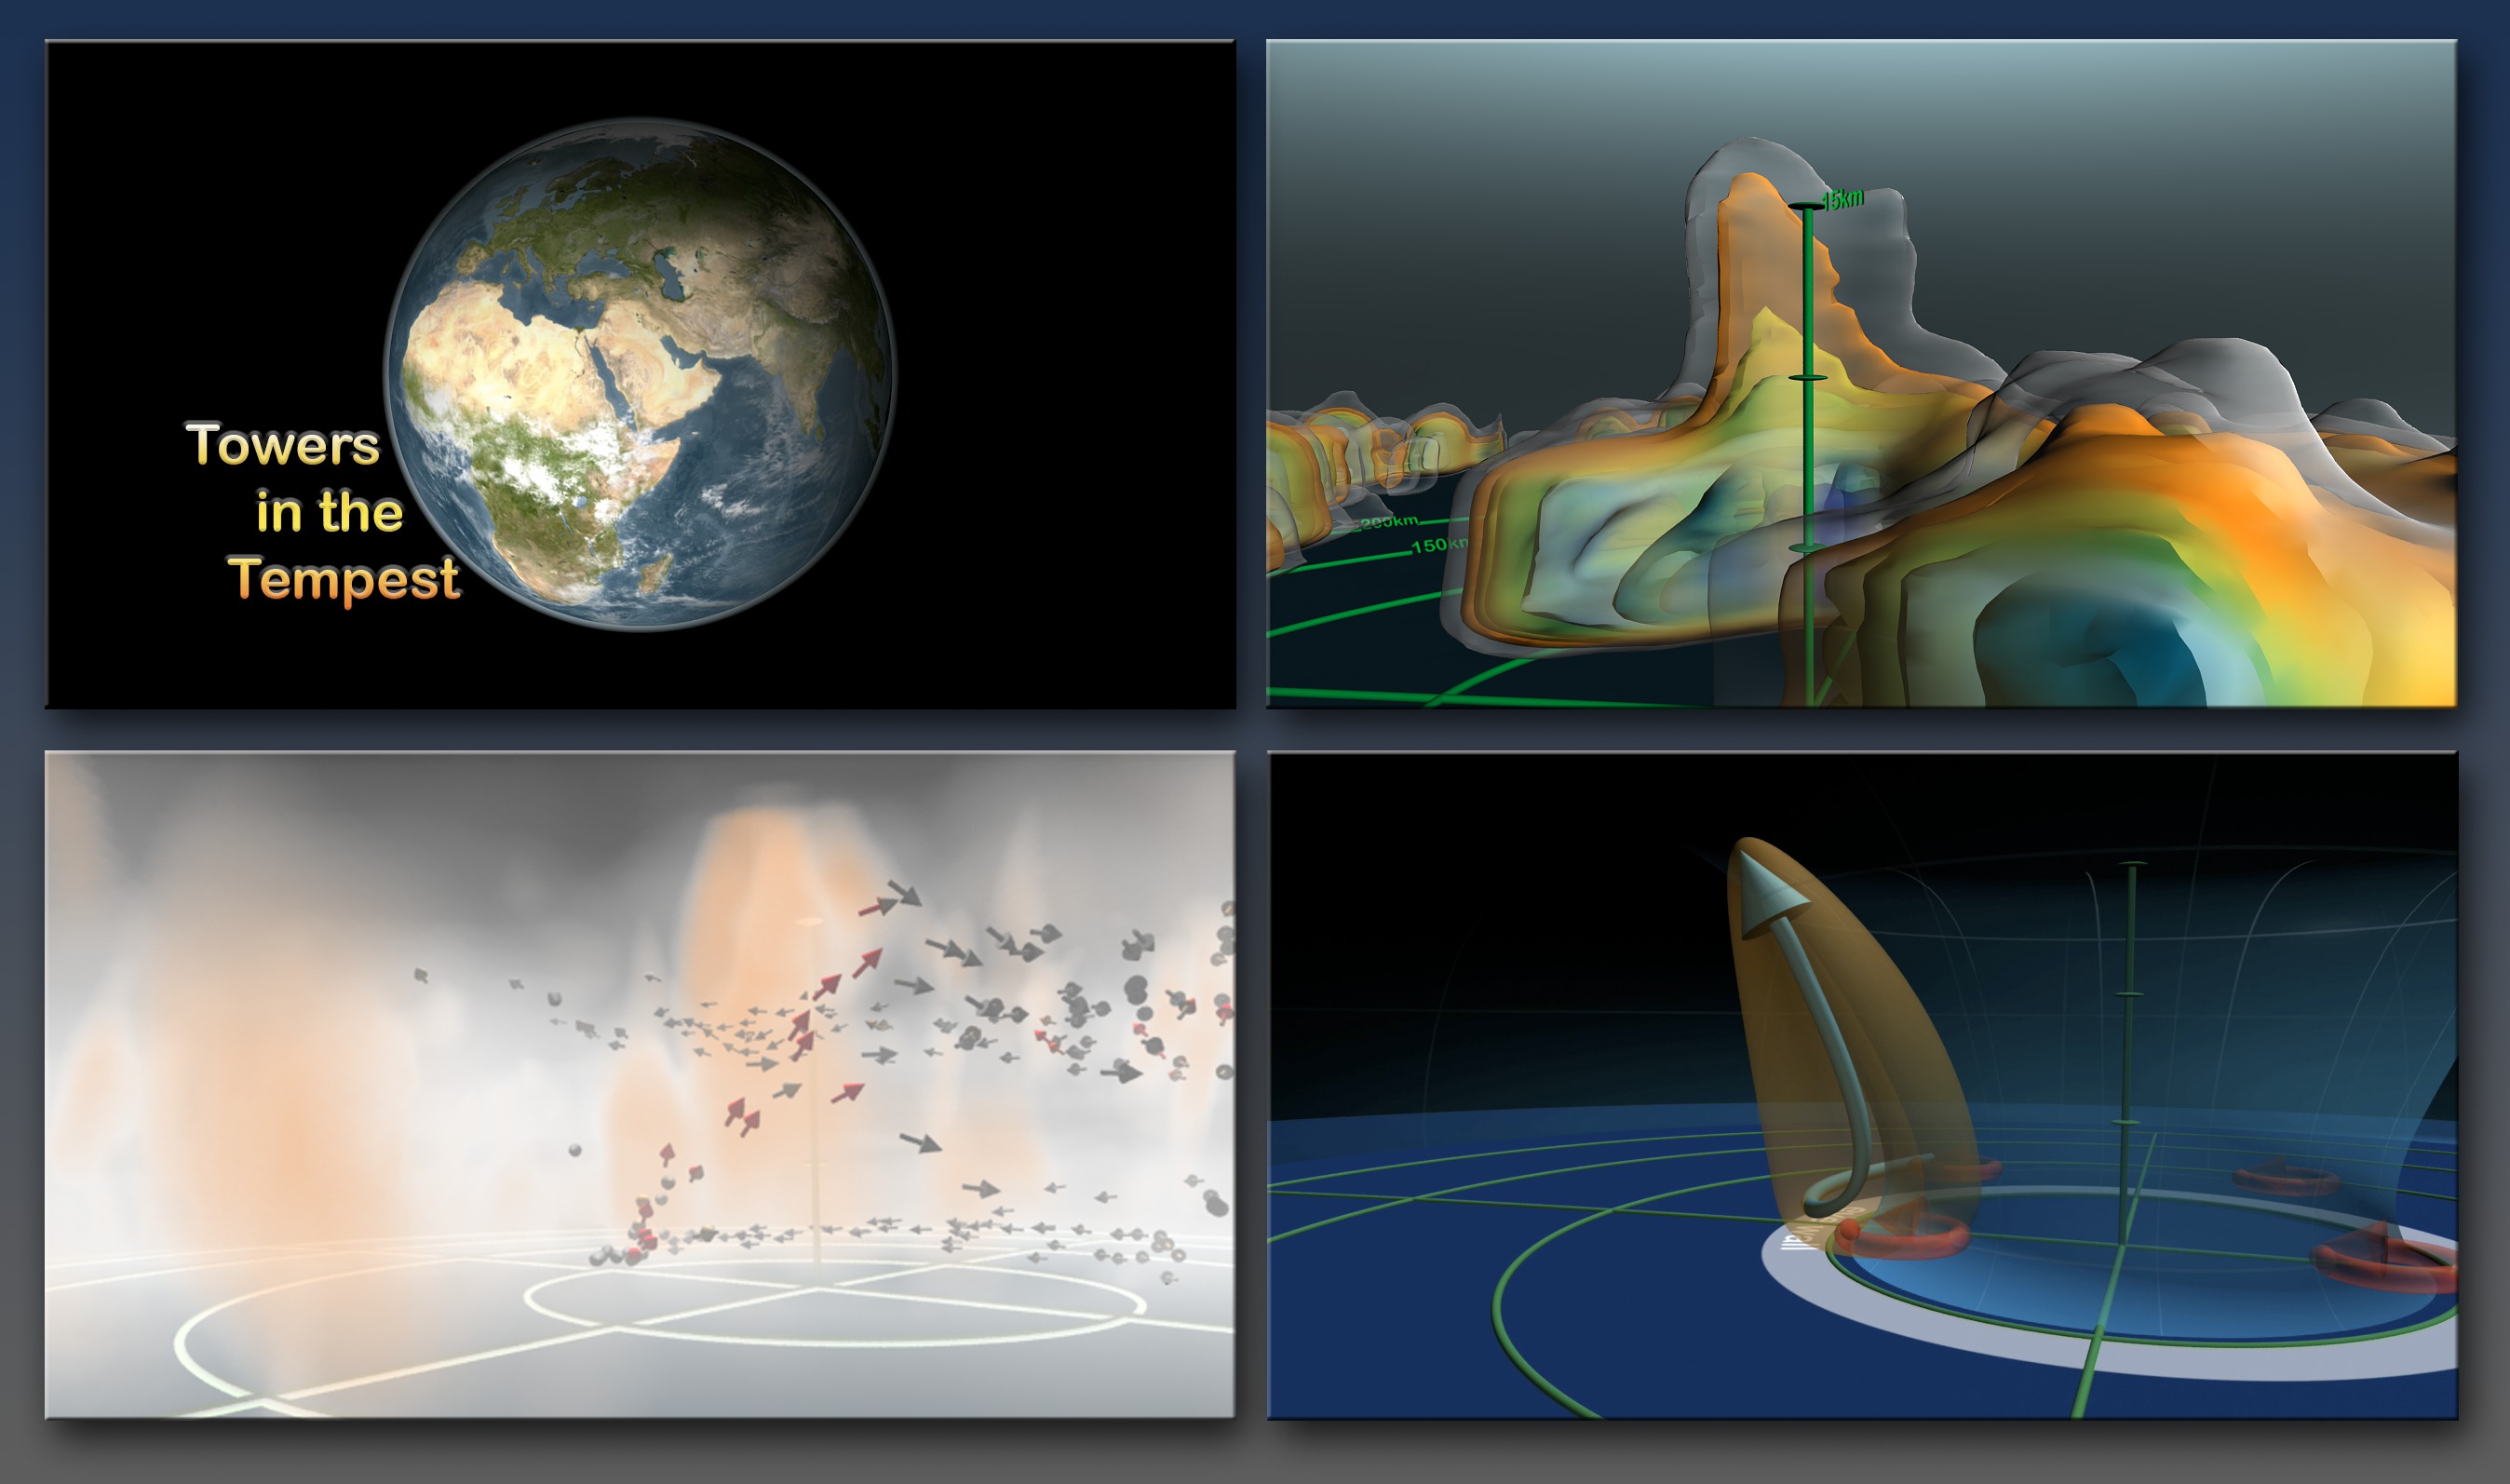
Go to this pageThis visualization won Honorable Mention in the National Science Foundation's Science and Engineering Visualization Challenge in September 2007. It was also shown during the SIGGRAPH 2008 Computer Animation Festival in Los Angeles, CA. 'Towers in the Tempest' is a 4.5 minute narrated animation that explains recent scientific insights into how hurricanes intensify. This intensification can be caused by a phenomenon called a 'hot tower'. For the first time, research meteorologists have run complex simulations using a very fine temporal resolution of 3 minutes. Combining this simulation data with satellite observations enables detailed study of 'hot towers'. The science of 'hot towers' is described using: observed hurricane data from a satellite, descriptive illustrations, and volumetric visualizations of simulation data. The first section of the animation shows actual data from Hurricane Bonnie observed by NASA's Tropical Rainfall Measuring Mission (TRMM) spacecraft. Three dimensional precipitation radar data reveal a strong 'hot tower' in Hurricane Bonnie's internal structure. The second section uses illustrations to show the dynamics of a hurricane and the formation of 'hot towers'. 'Hot towers' are formed as air spirals inward towards the eye and is forced rapidly upwards, accelerating the movement of energy into high altitude clouds. The third section shows these processes using volumetric cloud, wind, and vorticity data from a supercomputer simulation of Hurricane Bonnie. Vertical wind speed data highlights a 'hot tower'. Arrows representing the wind field move rapidly up into the 'hot tower, boosting the energy and intensifying the hurricane. Combining satellite observations with super-computer simulations provides a powerful tool for studying Earth's complex systems. The complete script is available here . The storyboard is available here . There is also a movie of storyboard drawings with narration below. ||
fvGCM Climate Model of Hurricane Frances and other storms
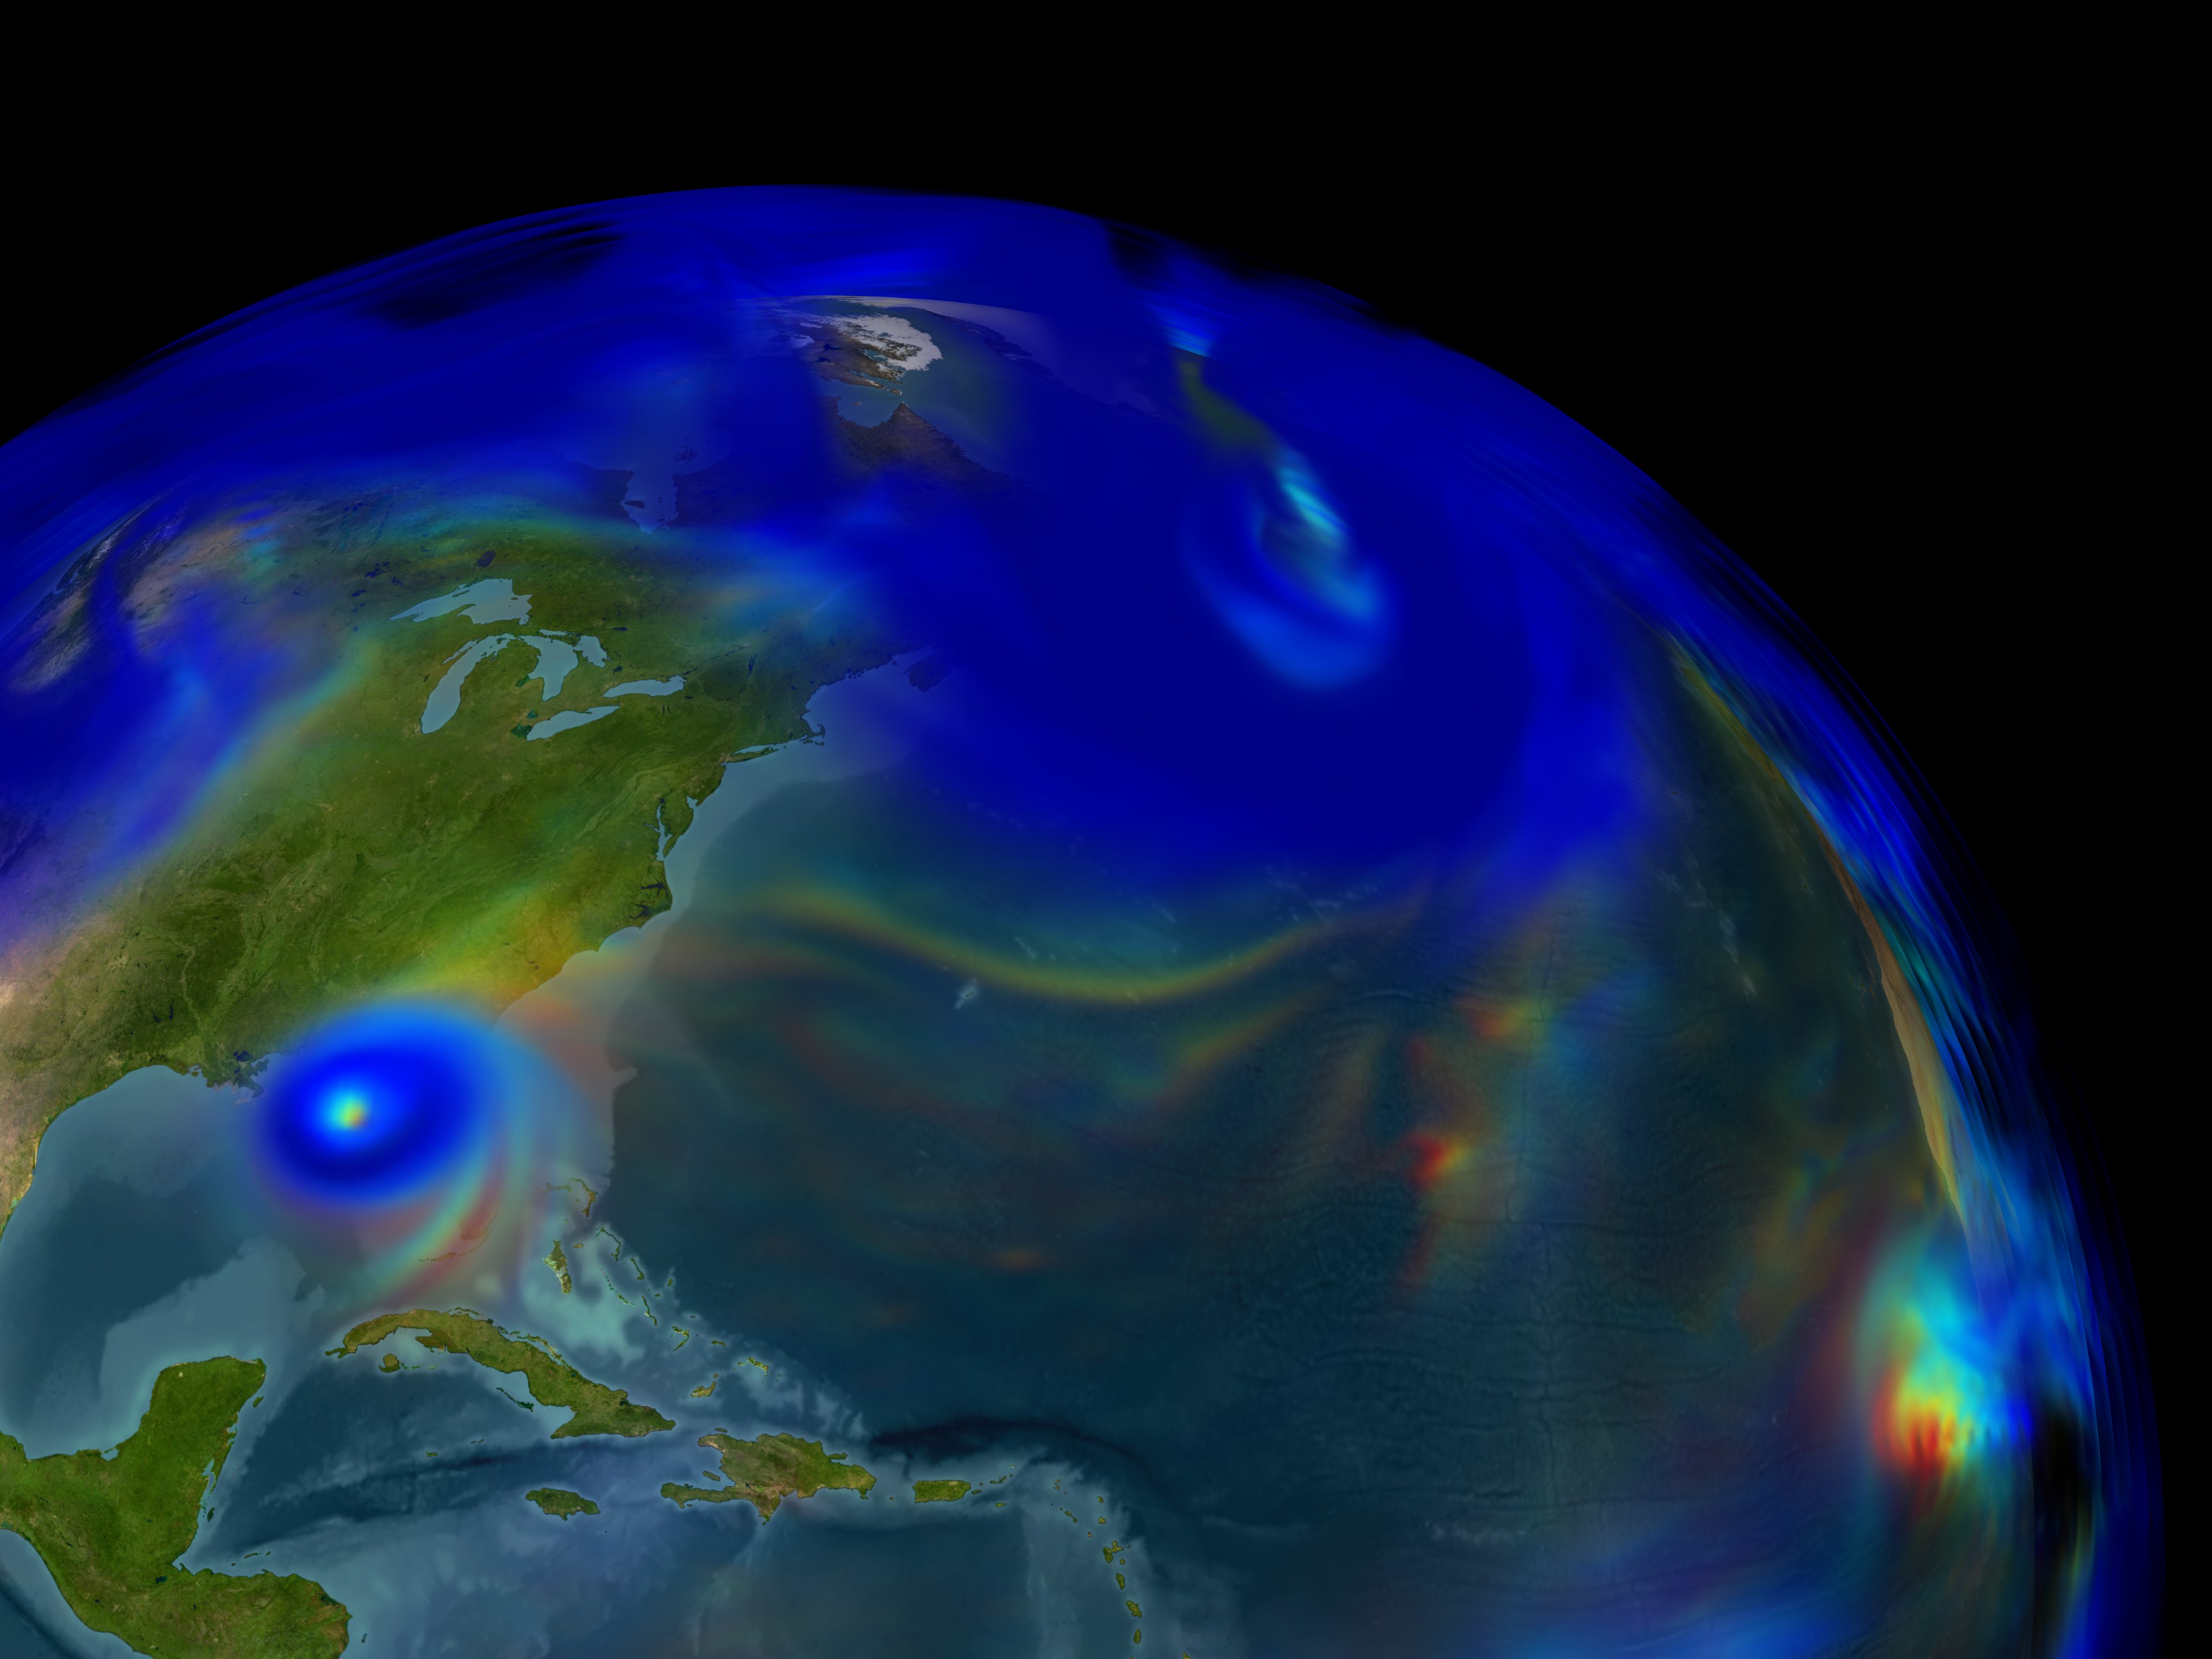
Go to this pageThis animation illustrates the output of NASA's finite-volume General Circulation Model (fvGCM) which is a global, 1/4 degree atmospheric model. Three dimensional volumetric representations of tropical cyclones are shown around the world including: Hurricane Francis in the Western Atlantic, Tropical Depression Ivan in the Eastern Atlantic, Tropical Cyclone Pheobe in the Indian Ocean, and Super Typhoon Songda in the Western North Pacific. The structures are defined by areas of high wind speeds. The colors represent total precipitable water (blue is low, red is high). ||
Guided Tour of LIMA Flyover
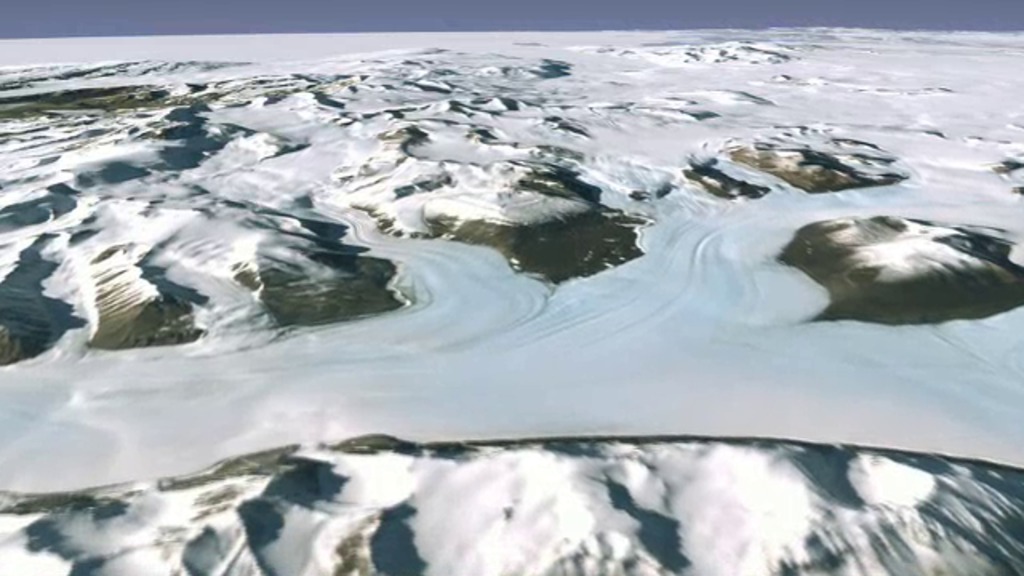
Go to this pageIn 2007, more than 1,100 Landsat 7 images were used to create the first ever, high-resolution, true color map of Antarctica. The Landsat Image Mosaic of Antarctica (LIMA) is a virtually cloud-free, 3-D view of Antarctica's frozen landscape produced by NASA, working with the National Science Foundation, the U.S. Geological Survey and the British Antarctic Survey.Visualizers stitched together Landsat 7 satellite imagery acquired in 1999 and 2001 with a digital elevation model and field data measurements. ||
FROZEN: A Spherical Movie About the Cryosphere
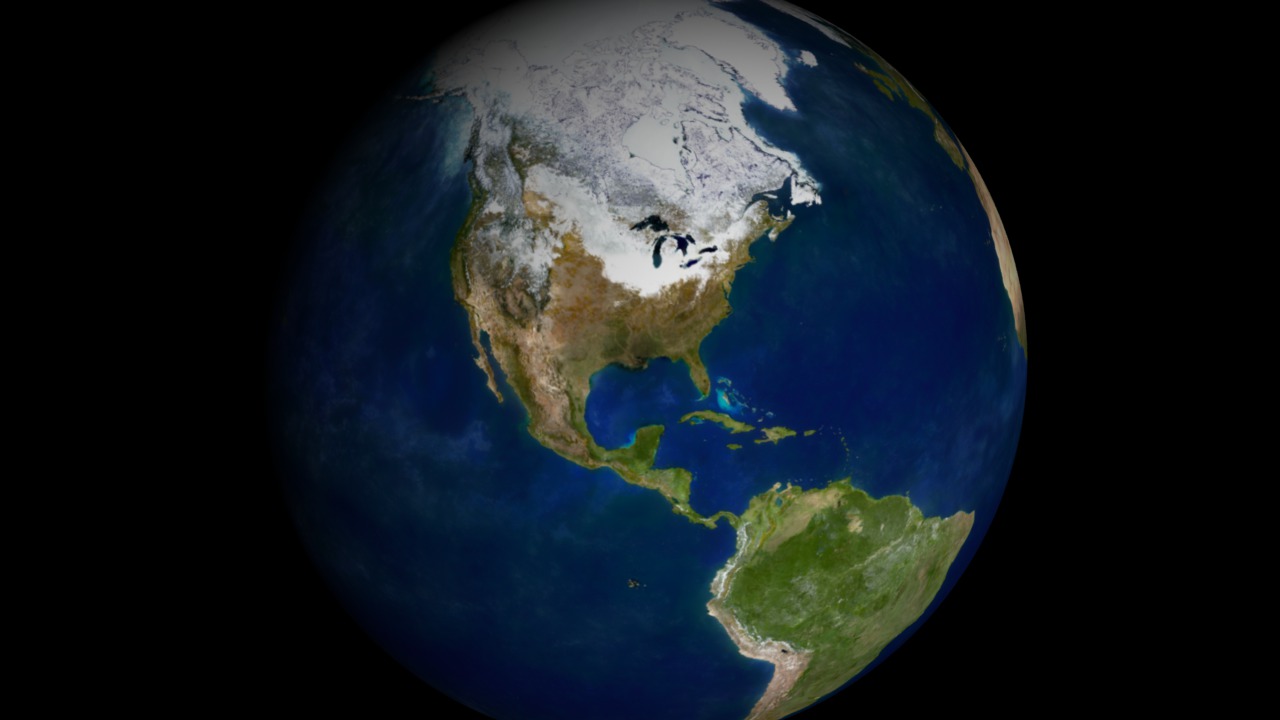
Go to this pageNASA's home for spherical films on Magic Planet. Download the Magic Planet-ready movie file here.Released on March 27, 2009, FROZEN is NASA's second major production for the Science On a Sphere platform, a novel cinema-in-the-round technology developed by the Space Agency's sibling NOAA. Viewers see the Earth suspended in darkness as if it were floating in space. Moving across the planet's face, viewers see the undulating wisps of clouds, the ephemeral sweep of fallen snow, the churning crash of shifting ice, and more.FROZEN brings the Earth alive. Turning in space, the sphere becomes a portal onto a virtual planet, complete with churning, swirling depictions of huge natural forces moving below. FROZEN features the global cryosphere, those places on Earth where the temperature doesn't generally rise above water's freezing point. As one of the most directly observable climate gauges, the changing cryosphere serves as a proxy for larger themes.But just as thrilling as this unusual—and unusually realistic—look at the planet's structure and behavior is the sheer fun and fascination of looking at a spherically shaped movie. FROZEN bends the rules of cinema, revealing new ways to tell exciting, valuable stories of all kinds. The movie may be FROZEN, but the experience itself rockets along. ||
Lunar Reconnaissance Orbiter (LRO) Orbit Insertion
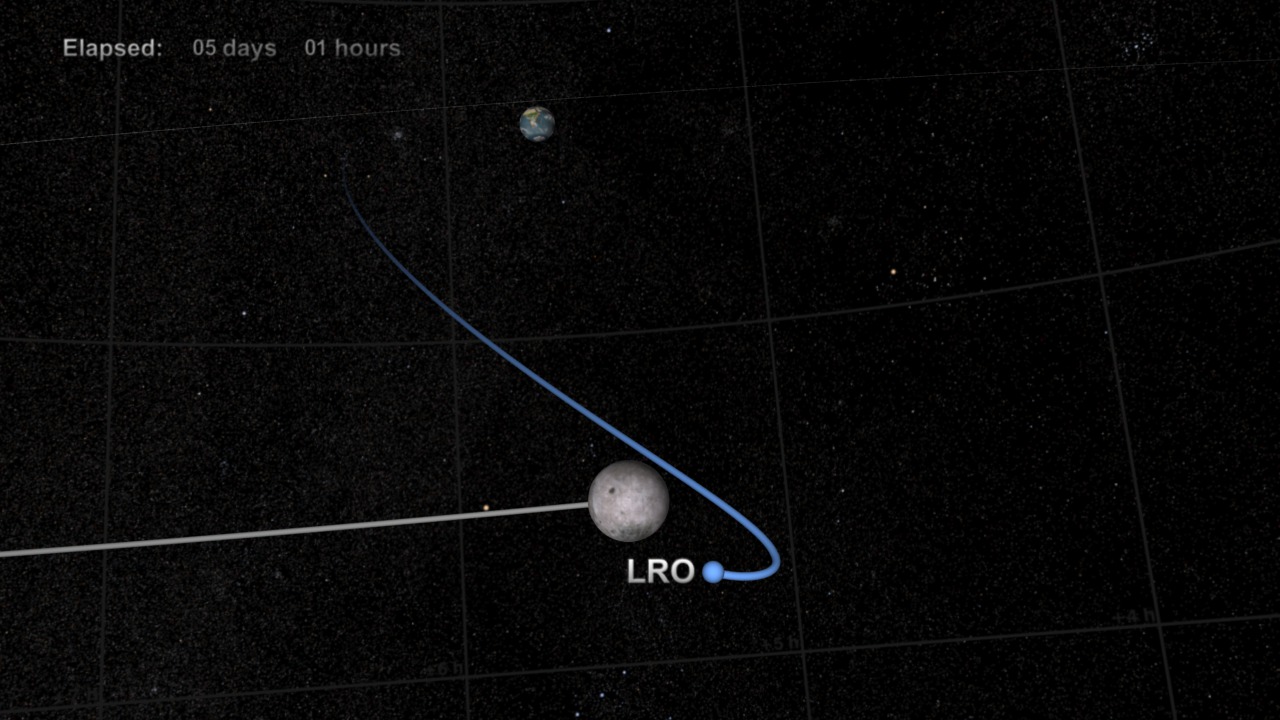
Go to this pageThis visualization shows an example of how the orbit insertion for the Lunar Reconnaissance Orbiter (LRO) might look. LRO launches from Cape Canaveral, then flies around the Earth and on to the moon. Time speeds up during the journey to the moon, then slows again as LRO approaches the moon. LRO begins orbiting the moon and, through a series of several "burns", moves in closer to its desired orbit. LRO's initial orbit plane around the moon is parallel to the direction of the moon's travel.This visualization was created before launch using simulated ephemeris data. The ephemeris data driving this visualization was based on a simulated nighttime launch on 11/24/2008; but, the actual launch may happen during the daytime.A stereoscopic version of this visualization can be found HERE. For more information on the coodinate systems in the animation see HERE. ||
LRO in Earth Centered and Moon Centered Coordinates
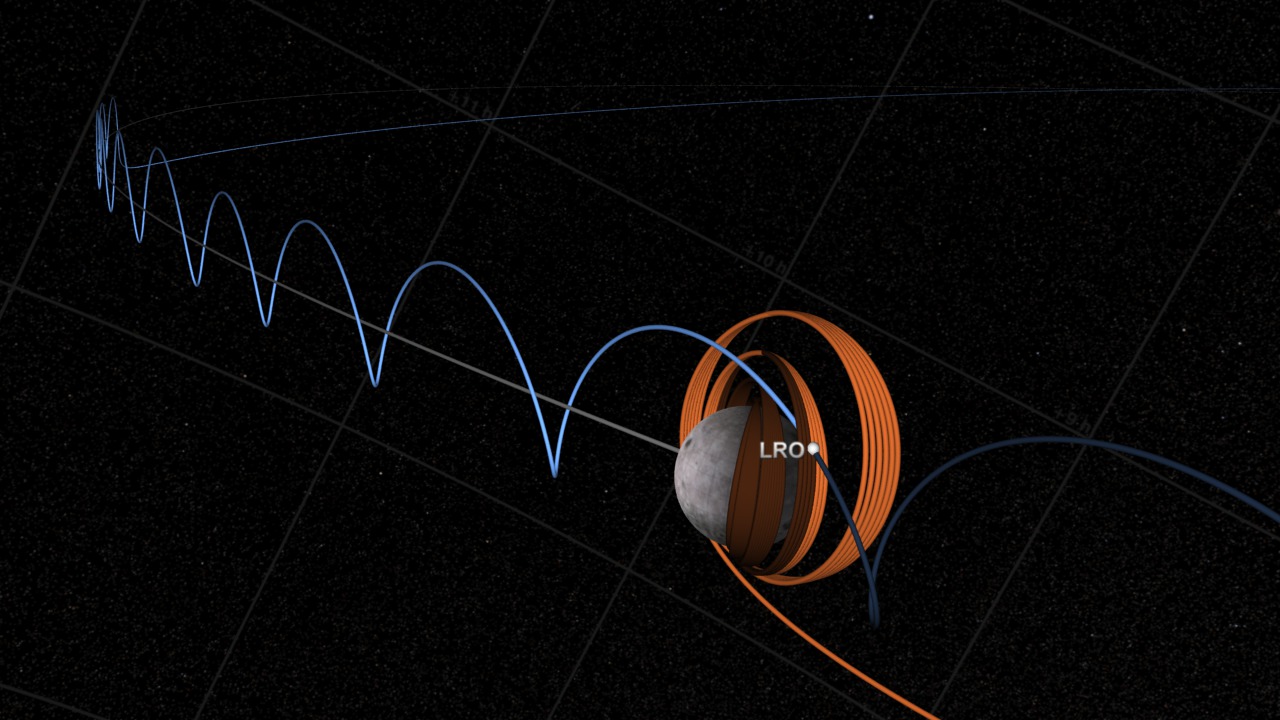
Go to this pageThis visualization shows the Lunar Reconnaissance Orbiter (LRO) orbit insertion from two different points of view (i.e., coordinate systems): Earth centered inertial coordinates and moon centered fixed coordinates. Orbit trails are shown in bright colors where the orbits have been and in darker colors for where the orbits will be. At any particular time, LRO is exactly at the intersection of the two orbit trail curves. The Earth centered coordinates are in blue and the moon centered coordinate are in orange.Why are there two different trails?Because the moon is moving, the moon centered coordinate system is moving. If the moon was stationary with respect to the Earth, both trails would look the same; but since the moon is moving, the moon's trail is always moving and the trails look different.Think of LRO orbiting the moon. From the moon's perspective, it's just going in an ellipse around the moon. In this case, the observation point (the moon) is moving with LRO. But, from the Earth's perspective, if you plotted out the trail of LRO, you would get a series of loops as LRO goes around the moon and as the moon moves through the sky.Animating an orbit trail that changes between two discrete coordinate systems is a challenge. A discontinuity arises if you just switch over from one trail to another. To animate a smooth transition one solution is to carefully select sections of the Earth centered and moon centered curves and then morph from the Earth centered curve section to the moon centered curve section while the animation was playing. This technique was used here as well. ||
LRO Transition from Earth-Centered to Moon-Centered Coordinates
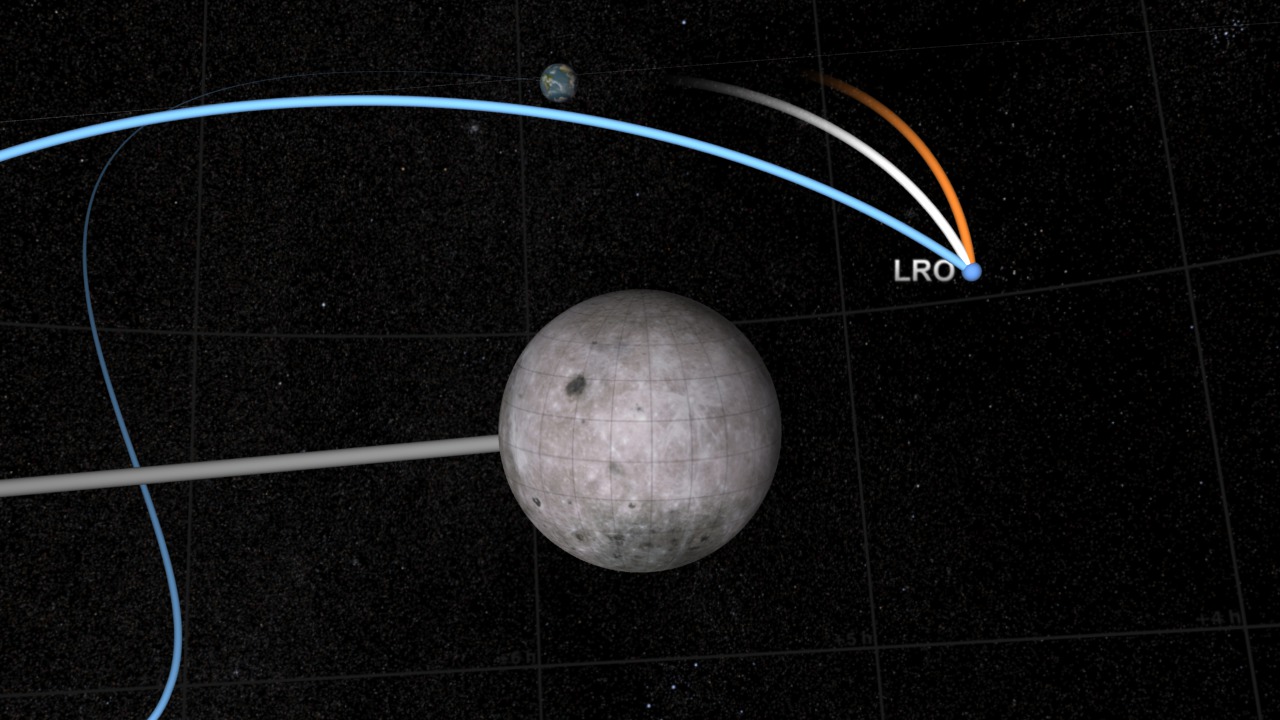
Go to this pageThis animation illustrates the solution to a human factors problem in the visualization of an orbit path, in this case the launch and lunar orbit insertion of the Lunar Reconnaissance Orbiter satellite.The visualization (found HERE) shows LRO orbiting the Earth, traveling from the Earth to the moon, and entering lunar orbit. Throughout the visualization, a trail is drawn to show LRO's path. This trail is a history of LRO's motion.The viewer's expectation is that LRO first travels in a circular orbit centered on the Earth, then follows a smoothly curving path connecting the Earth to the moon, and finally enters an elliptical orbit around the moon. The problem for the animator is that an accurate trail satisfying all of these expectations is impossible to draw in a single coordinate system. A trail drawn in Earth-centered coordinates forms a looping, spring-like path when LRO enters lunar orbit, and a trail drawn in moon body-fixed coordinates becomes disconnected from the Earth and precesses through space.Simply switching from one coordinate system to the other would make the trail appear to jump suddenly and dramatically. Creating a hybrid trail would leave a visually confusing elbow in LRO's path.The solution illustrated here is to morph the trail from one coordinate system to the other. The blue trail is the Earth-centered path, the orange trail is the moon body-fixed path, and the white trail is the morph between the two. In the visualization, the Earth trail shortens, disconnecting it from the Earth, and then morphs over about 400 frames into the moon body-fixed trail. With careful timing, the result is a visually seamless transition from one coordinate system to the other.Notice that the difference in coordinate systems creates no ambiguity about the present position of LRO at any given time. LRO is always at the intersection of the trails. The problem arises when attempting to depict the history of its motion. That history takes different shapes in coordinate systems that move relative to one another.An animation showing LRO's entire path in both coordinate systems simultaneously can be found HERE. ||
Sentinels of the Heliosphere
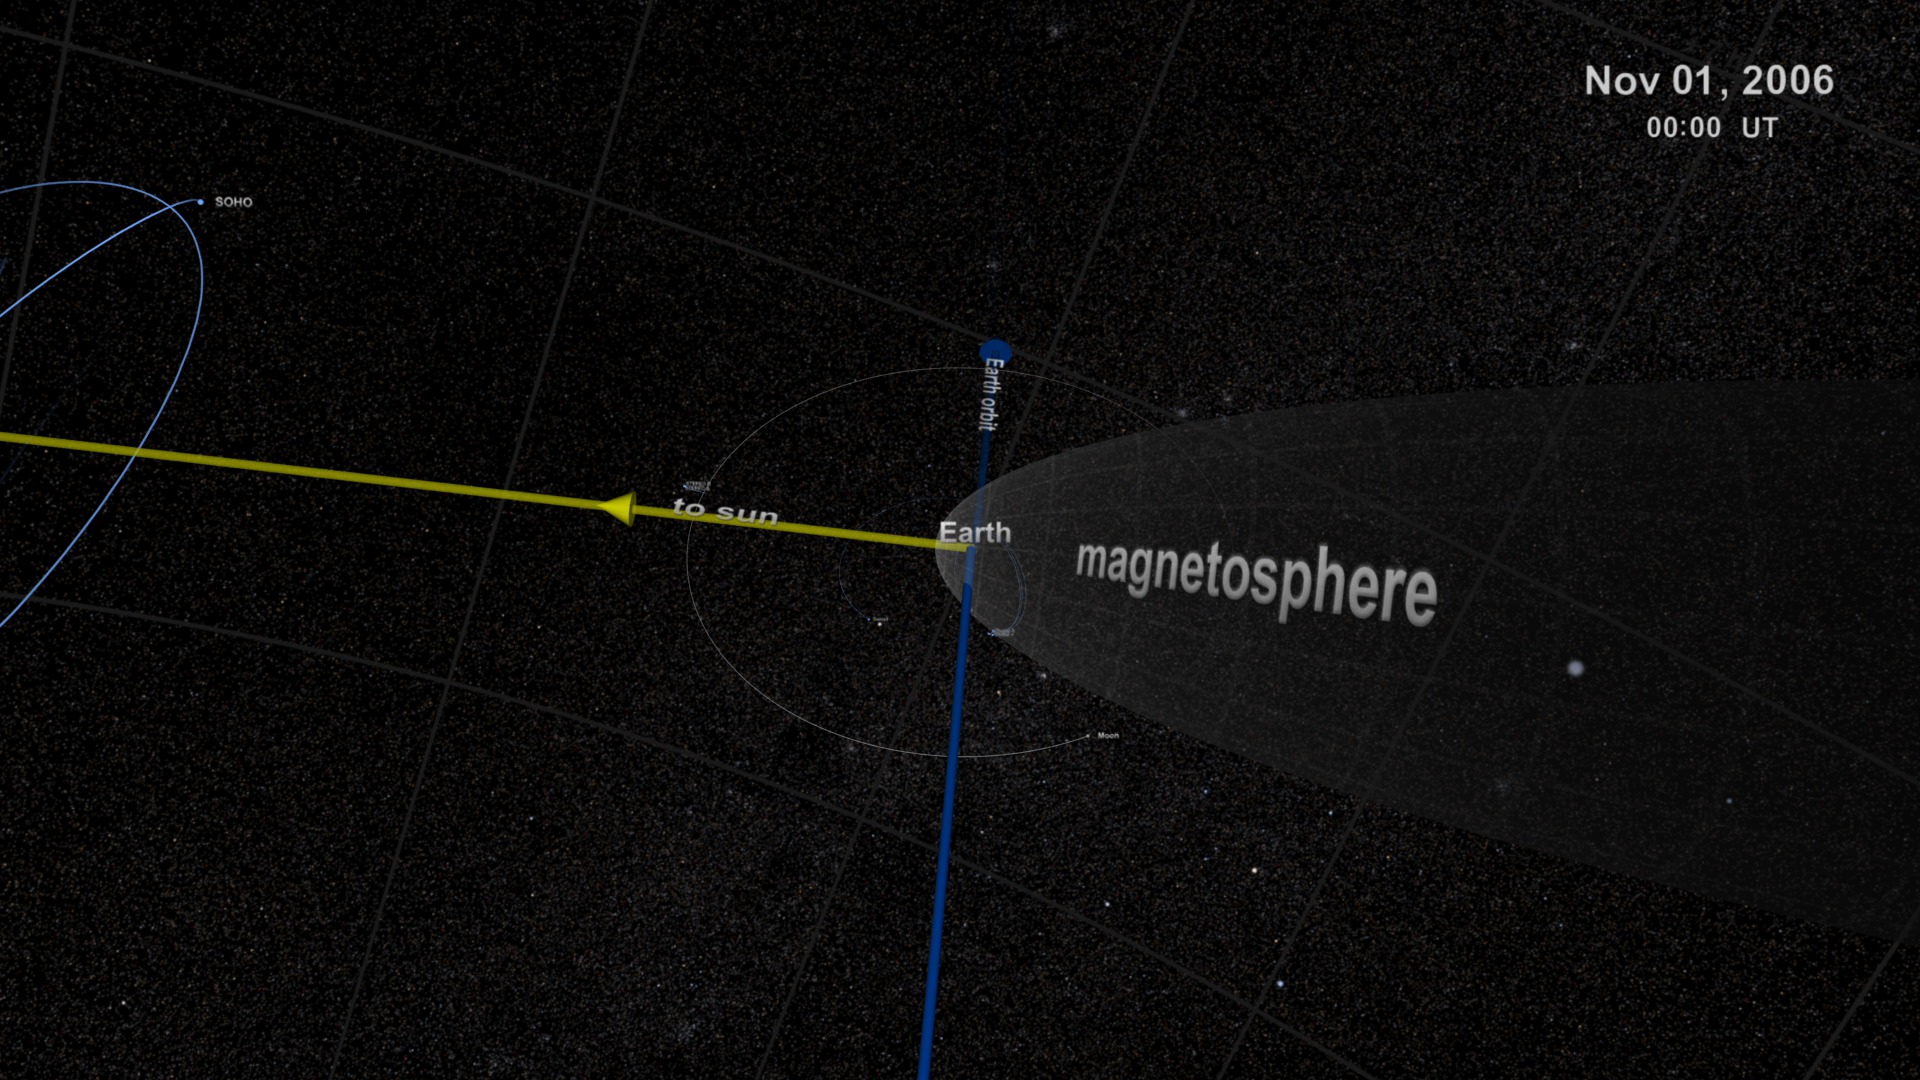
Go to this pageHeliophysics is a term to describe the study of the Sun, its atmosphere or the heliosphere, and the planets within it as a system. As a result, it encompasses the study of planetary atmospheres and their magnetic environment, or magnetospheres. These environments are important in the study of space weather.As a society dependent on technology, both in everyday life, and as part of our economic growth, space weather becomes increasingly important. Changes in space weather, either by solar events or geomagnetic events, can disrupt and even damage power grids and satellite communications. Space weather events can also generate x-rays and gamma-rays, as well as particle radiations, that can jeopardize the lives of astronauts living and working in space.This visualization tours the regions of near-Earth orbit; the Earth's magnetosphere, sometimes called geospace; the region between the Earth and the Sun; and finally out beyond Pluto, where Voyager 1 and 2 are exploring the boundary between the Sun and the rest of our Milky Way galaxy. Along the way, we see these regions patrolled by a fleet of satellites that make up NASA's Heliophysics Observatory Telescopes. Many of these spacecraft do not take images in the conventional sense but record fields, particle energies and fluxes in situ. Many of these missions are operated in conjunction with international partners, such as the European Space Agency (ESA) and the Japanese Space Agency (JAXA).The Earth and distances are to scale. Larger objects are used to represent the satellites and other planets for clarity.Here are the spacecraft featured in this movie:Near-Earth Fleet:Hinode: Observes the Sun in multiple wavelengths up to x-rays. SVS pageRHESSI : Observes the Sun in x-rays and gamma-rays. SVS pageTRACE: Observes the Sun in visible and ultraviolet wavelengths. SVS pageTIMED: Studies the upper layers (40-110 miles up) of the Earth's atmosphere.FAST: Measures particles and fields in regions where aurora form.CINDI: Measures interactions of neutral and charged particles in the ionosphere. AIM: Images and measures noctilucent clouds. SVS pageGeospace Fleet:Geotail: Conducts measurements of electrons and ions in the Earth's magnetotail. Cluster: This is a group of four satellites which fly in formation to measure how particles and fields in the magnetosphere vary in space and time. SVS pageTHEMIS: This is a fleet of five satellites to study how magnetospheric instabilities produce substorms. SVS pageL1 Fleet: The L1 point is a Lagrange Point, a point between the Earth and the Sun where the gravitational pull is approximately equal. Spacecraft can orbit this location for continuous coverage of the Sun.SOHO: Studies the Sun with cameras and a multitude of other instruments. SVS pageACE: Measures the composition and characteristics of the solar wind. Wind: Measures particle flows and fields in the solar wind. Heliospheric FleetSTEREO-A and B: These two satellites observe the Sun, with imagers and particle detectors, off the Earth-Sun line, providing a 3-D view of solar activity. SVS pageHeliopause FleetVoyager 1 and 2: These spacecraft conducted the original 'Planetary Grand Tour' of the solar system in the 1970s and 1980s. They have now travelled further than any human-built spacecraft and are still returning measurements of the interplanetary medium. SVS pageThis enhanced, narrated visualization was shown at the SIGGRAPH 2009 Computer Animation Festival in New Orleans, LA in August 2009; an eariler version created for AGU was called NASA's Heliophysics Observatories Study the Sun and Geospace. ||
