SDO First Light
Overview
These are "First Light" release movies for Solar Dynamics Observatory (SDO) from April 11, 2010. For more information about SDO, visit the SDO web site @ NASA.gov.
Press Release Materials
SDO First Light Media
Go to this pageA compilation of some of the videos and stills used during the SDO First Light press conference.There are more video and stills available. ||
SDO First Light High Resolution Stills
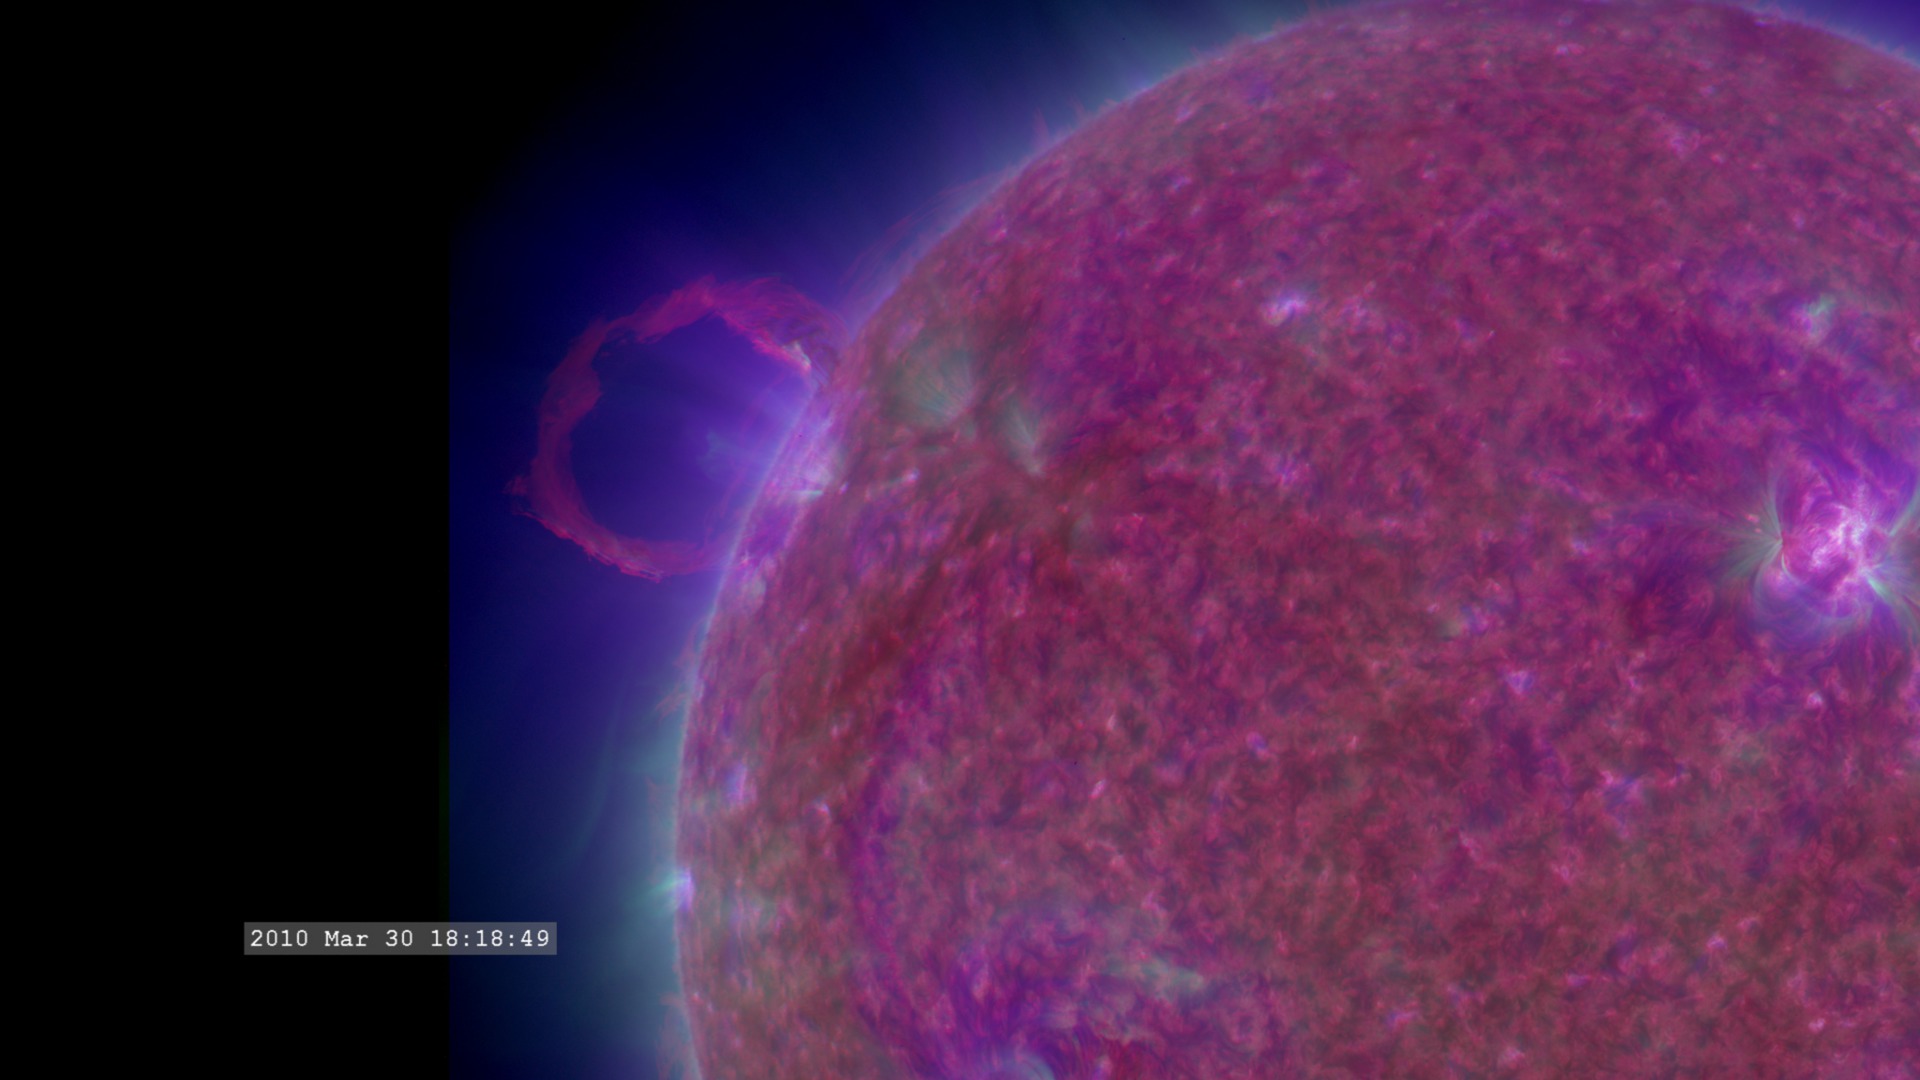
Go to this pageStills from the AIA instrument on SDO. They show the March 30, 2010 "First Light" prominence eruption captured just after the AIA sensors were activated. All images are from the ultraviolet part of the spectrum, specifically the wavelengths of 304, 211, 193, and 171 Ångstroms. The stills are in multiple resolutions and are available as tiff and jpeg files. ||
SDO Atmospheric Imaging Assembly (AIA)
The Atmospheric Imaging Assembly (AIA) views the lower atmosphere of the Sun in ultraviolet wavelengths where we can see hot plasma moving along magnetic field lines. Home page for the Atmospheric Imaging Assembly.
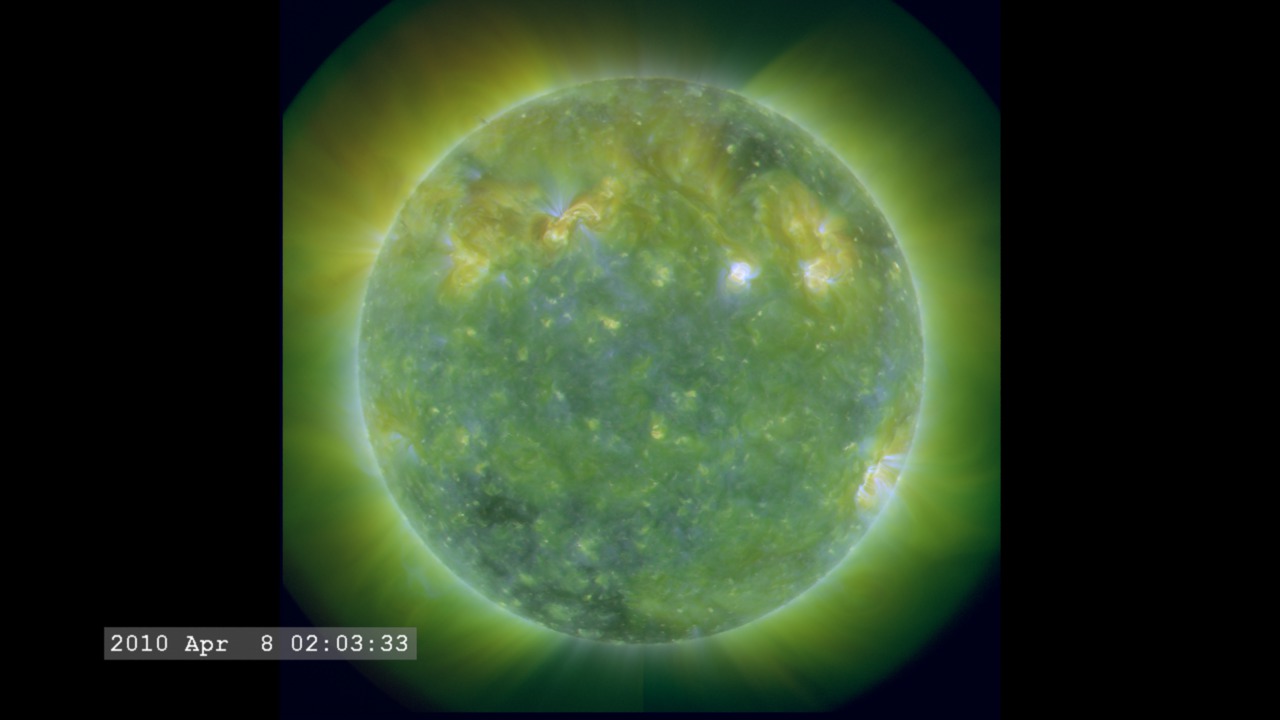
SDO/AIA CME Event of April 8, 2010 Full Disk (Multiband)
Go to this pageThis visualization is a full-disk view of the CME launched from the Sun on April 8, 2010. This is a 3-color image produced by combining three different filters from the AIA instrument: 211 (red), 193 (green), and 171 (blue). ||
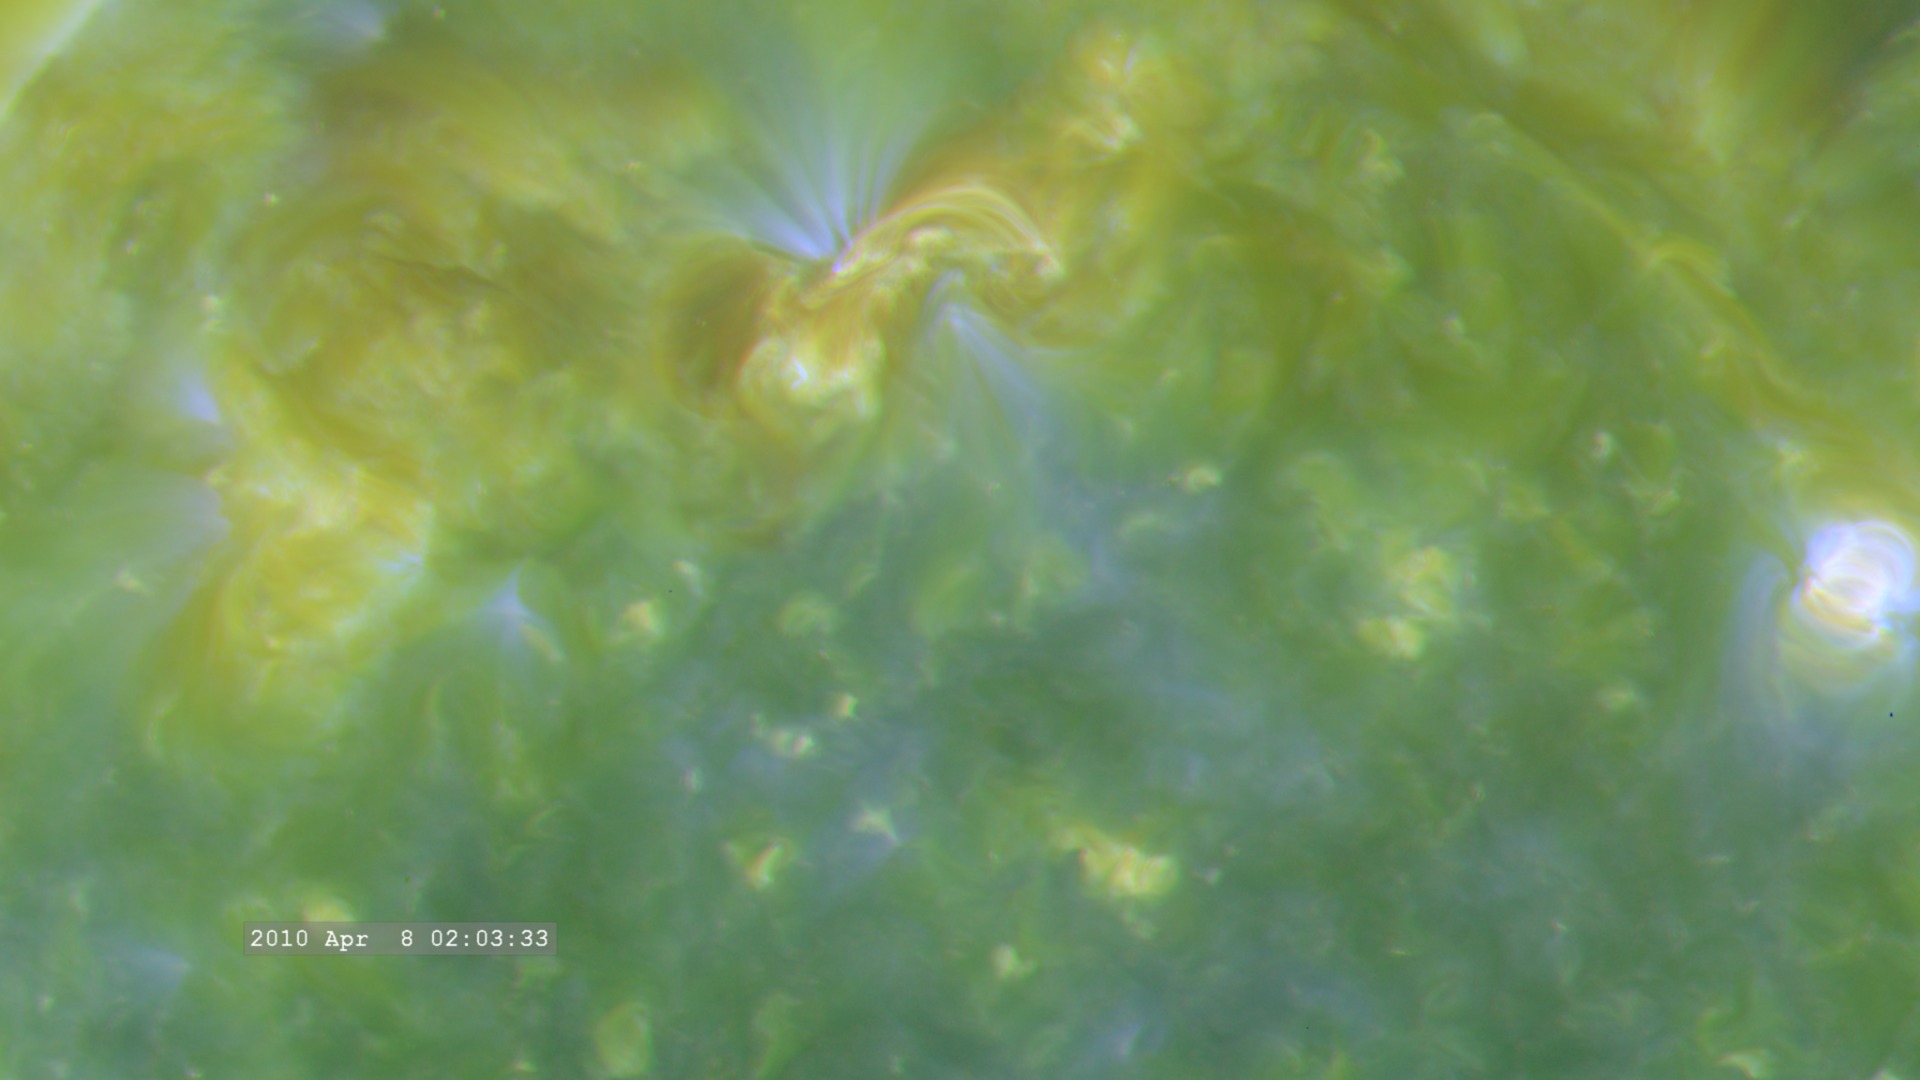
SDO/AIA CME Event of April 8, 2010 (Multiband)
Go to this pageThis is a close-up view of the April 8 CME in ultraviolet light which reveals a wave (darker regions) expanding outward from the flare event. This movie creates a color image by combining filters for 211 Ångstroms (red), 193 Ångstroms (green) and 171 Ångstroms (blue). ||
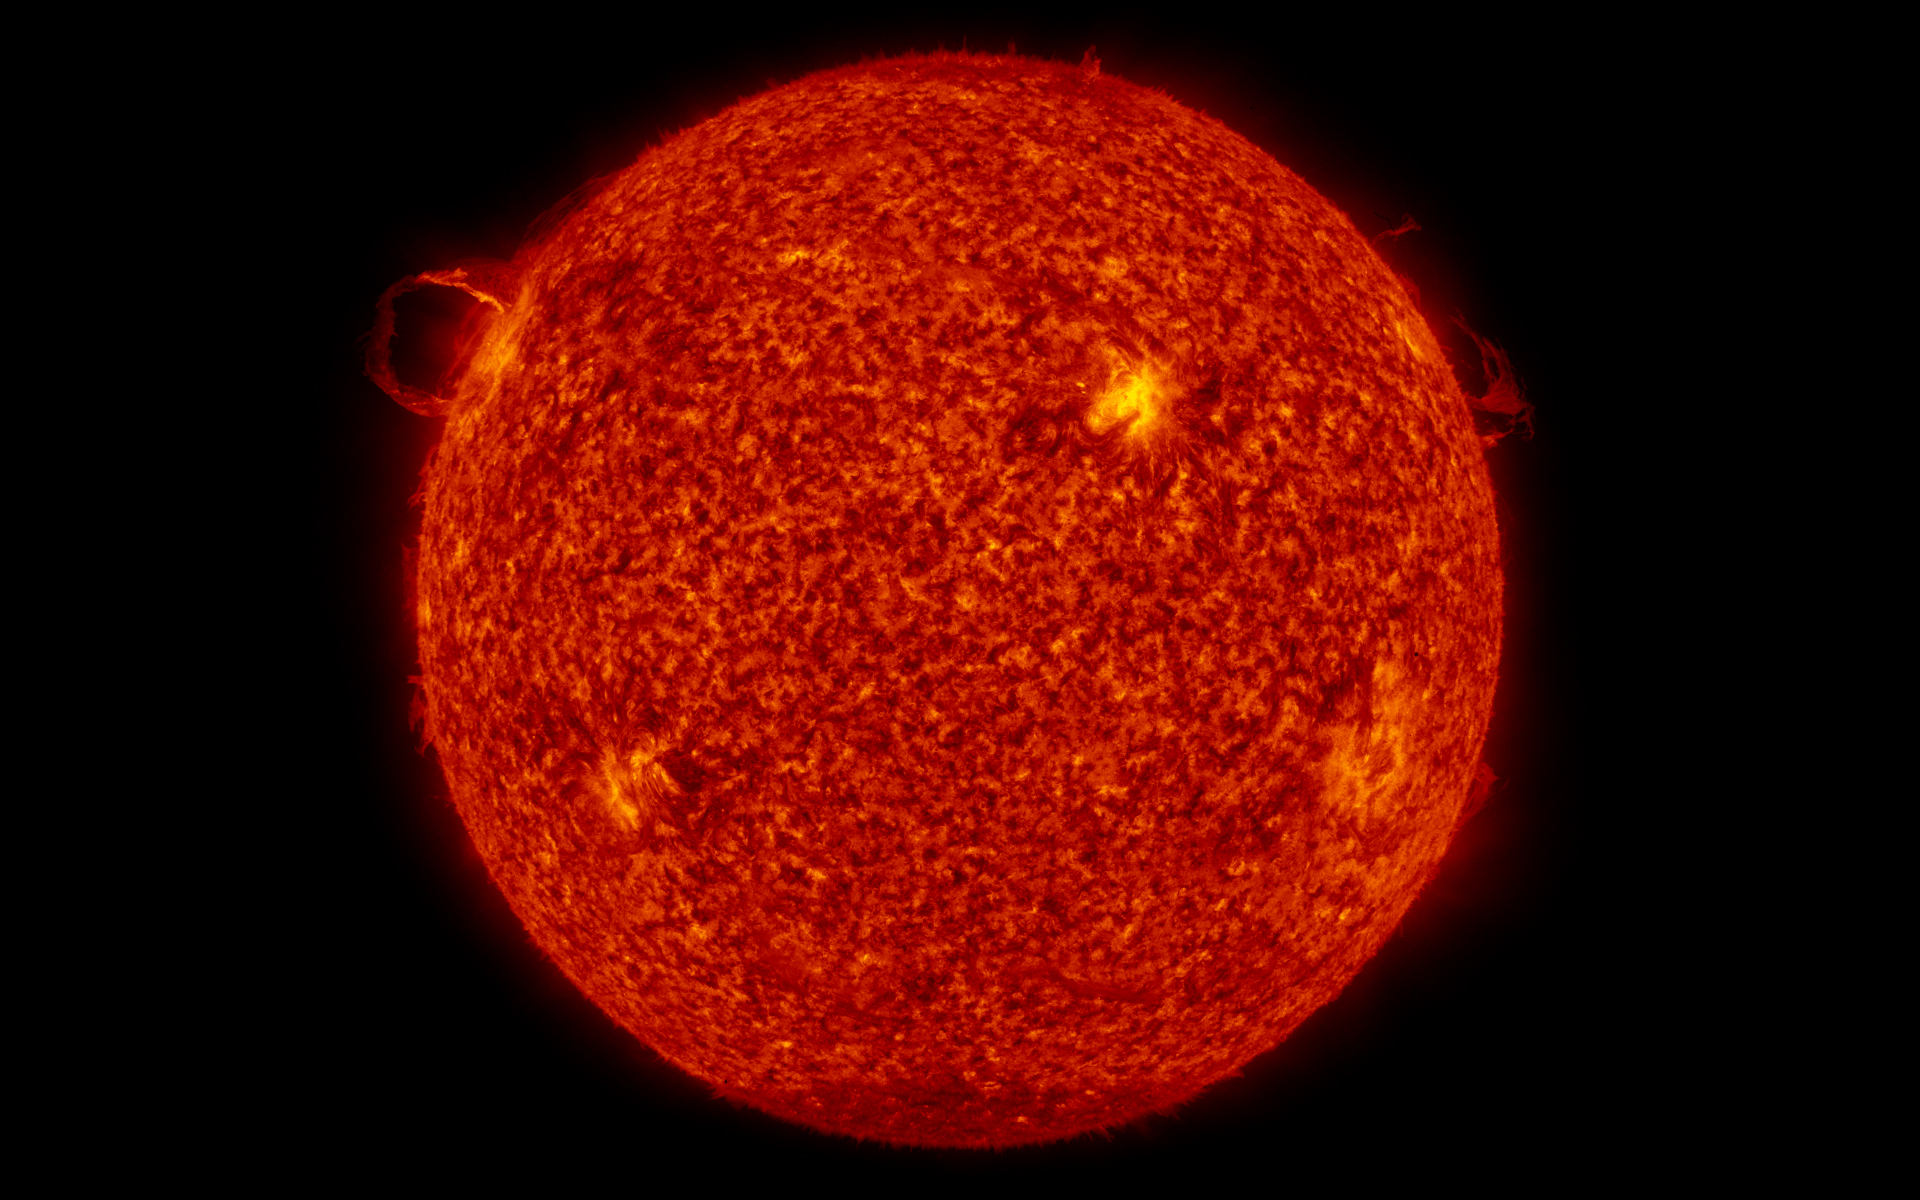
SDO/AIA Zoom-In on Launching Filament (Bands 304, 171, 211)
Go to this pageAs the AIA camera was activated, one of its first views was this fliament launching from the Sun. ||
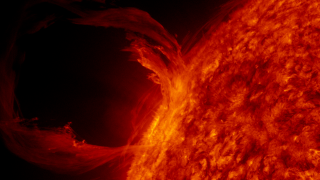
SDO/AIA Close-up on Launching Filament (band 304)
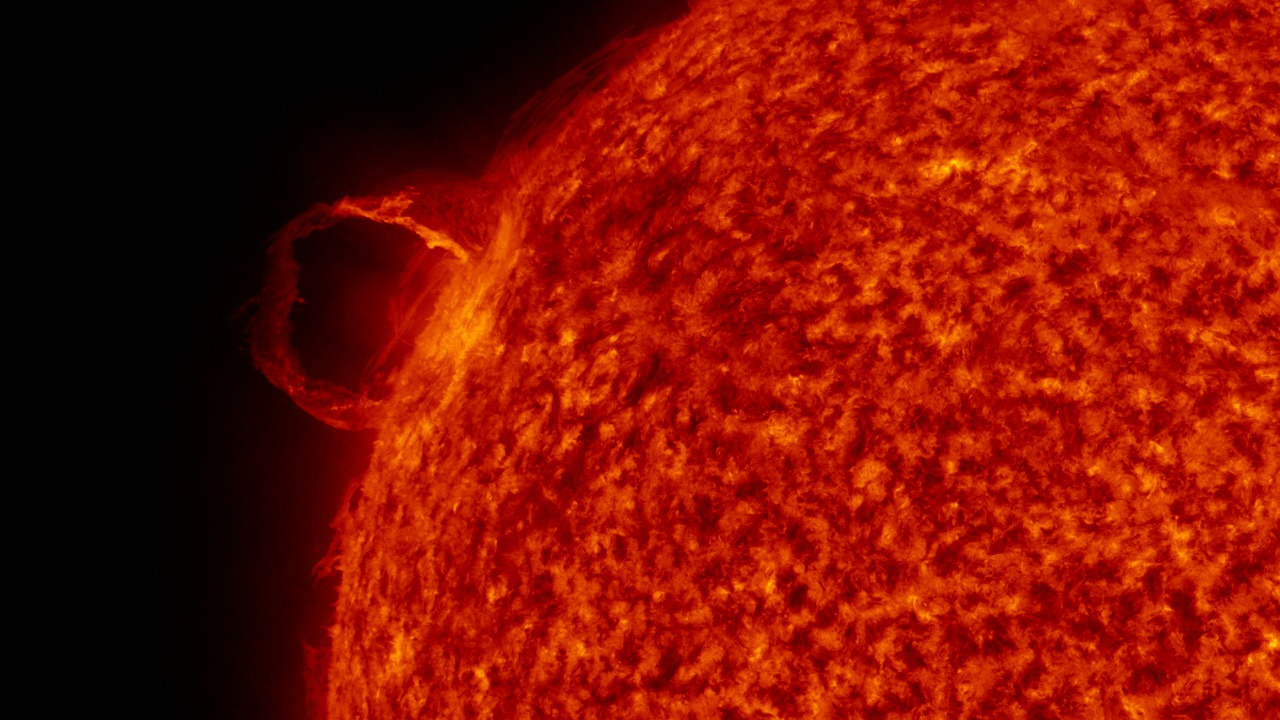
Go to this pageA close-up view of the filament launch in the 304 band, which corresponds to a wavelength of about 304 Ångstroms. ||
SDO/AIA Full-Disk View of Launching Filament (Band 304)
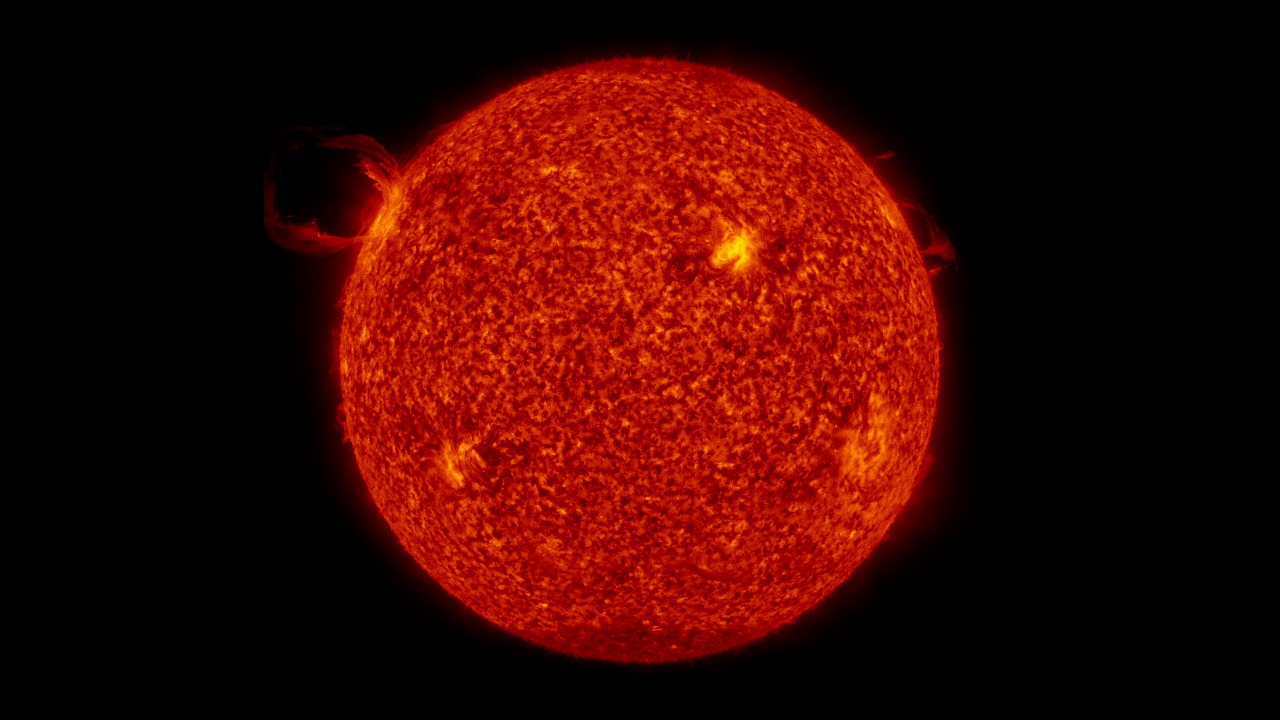
Go to this pageFull disk view of a filament launch in the SDO AIA 304 band. ||
SDO/AIA Zoom-out of Launching Filament (Band 304)
Go to this pageThis view of the filament launch loops several times before pulling out to show the full solar disk. ||
SDO Helioseismic Magnetic Imager (HMI) Continuum Images
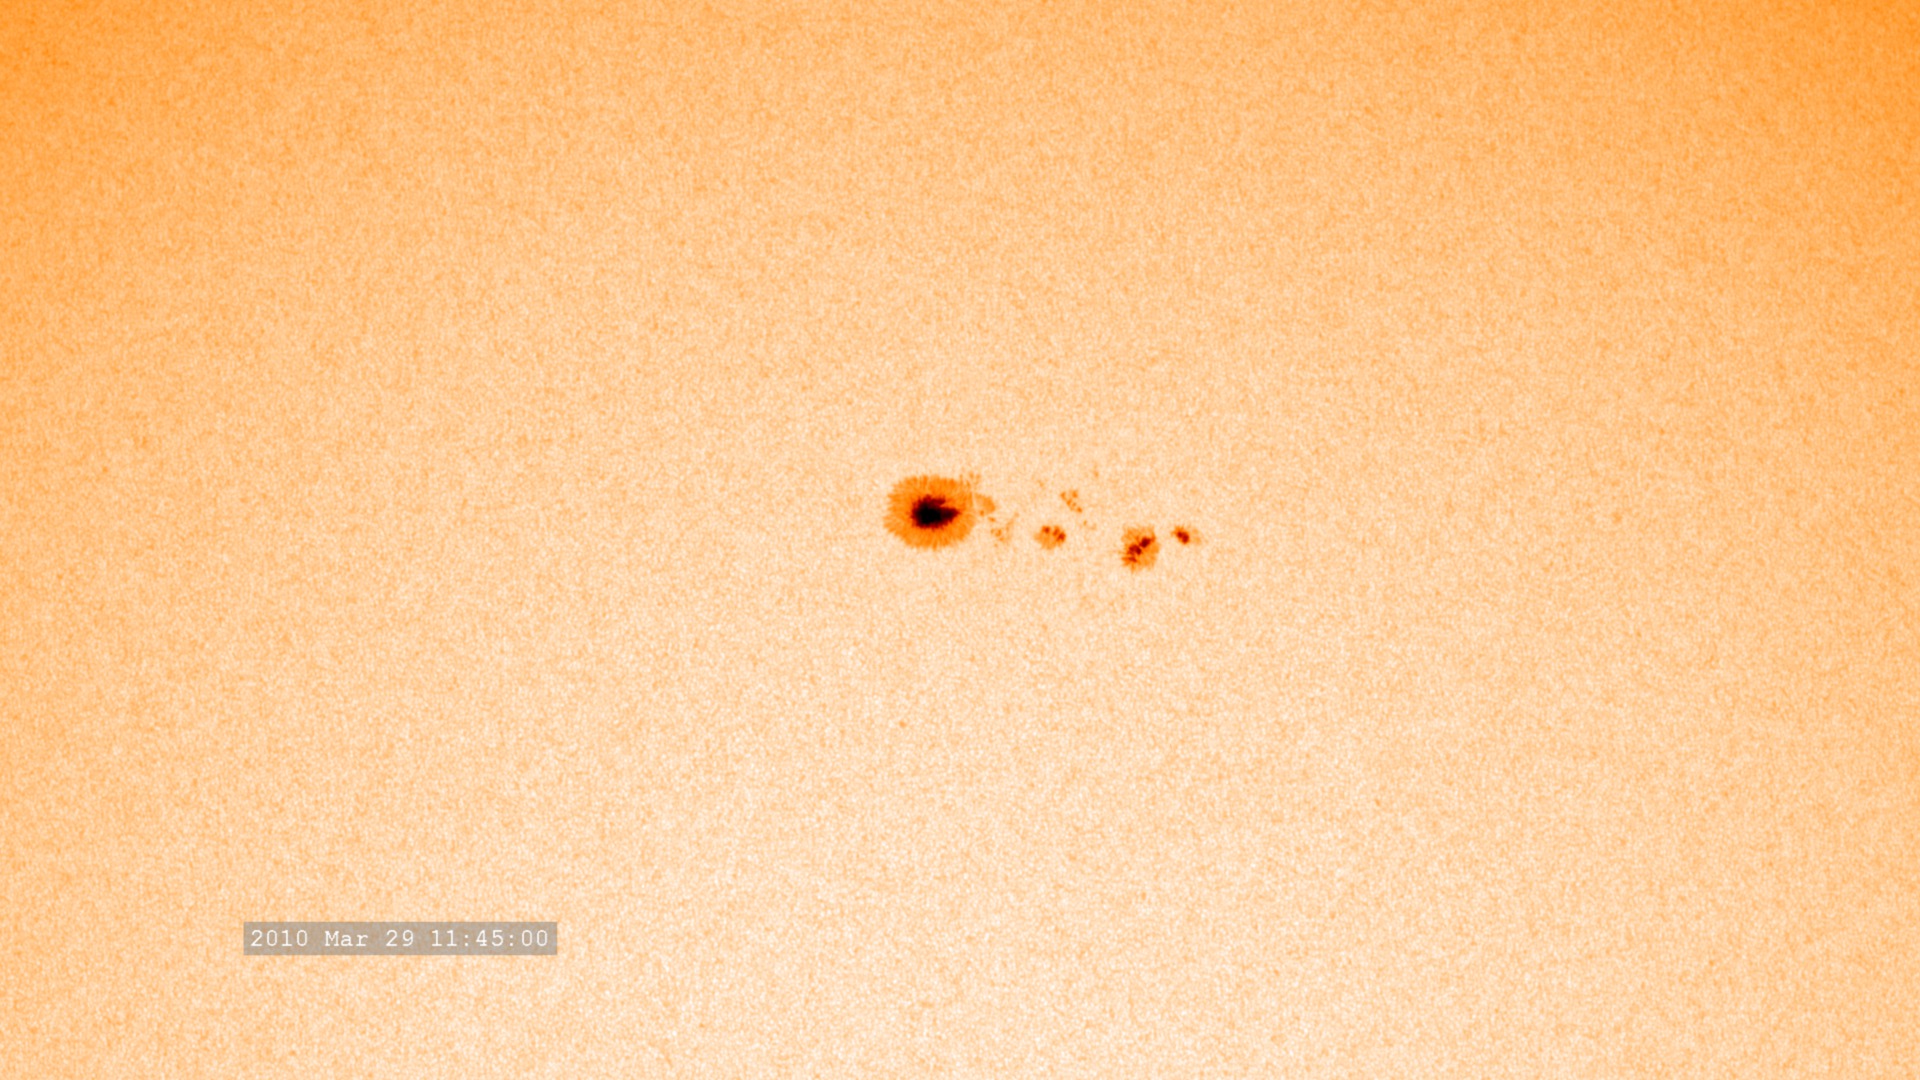
The continuum images are constructed from several filters on HMI which closely resemble an optical image.
The Helioseismic and Magnetic Imager (HMI) images the Sun in a set of narrow wavelengths which enables us to study motions at the solar surface and collect magnetic field information. Home Page for the Helioseismic and Magnetic Imager.
SDO/HMI Continuum Full Disk View - March 29, 2010
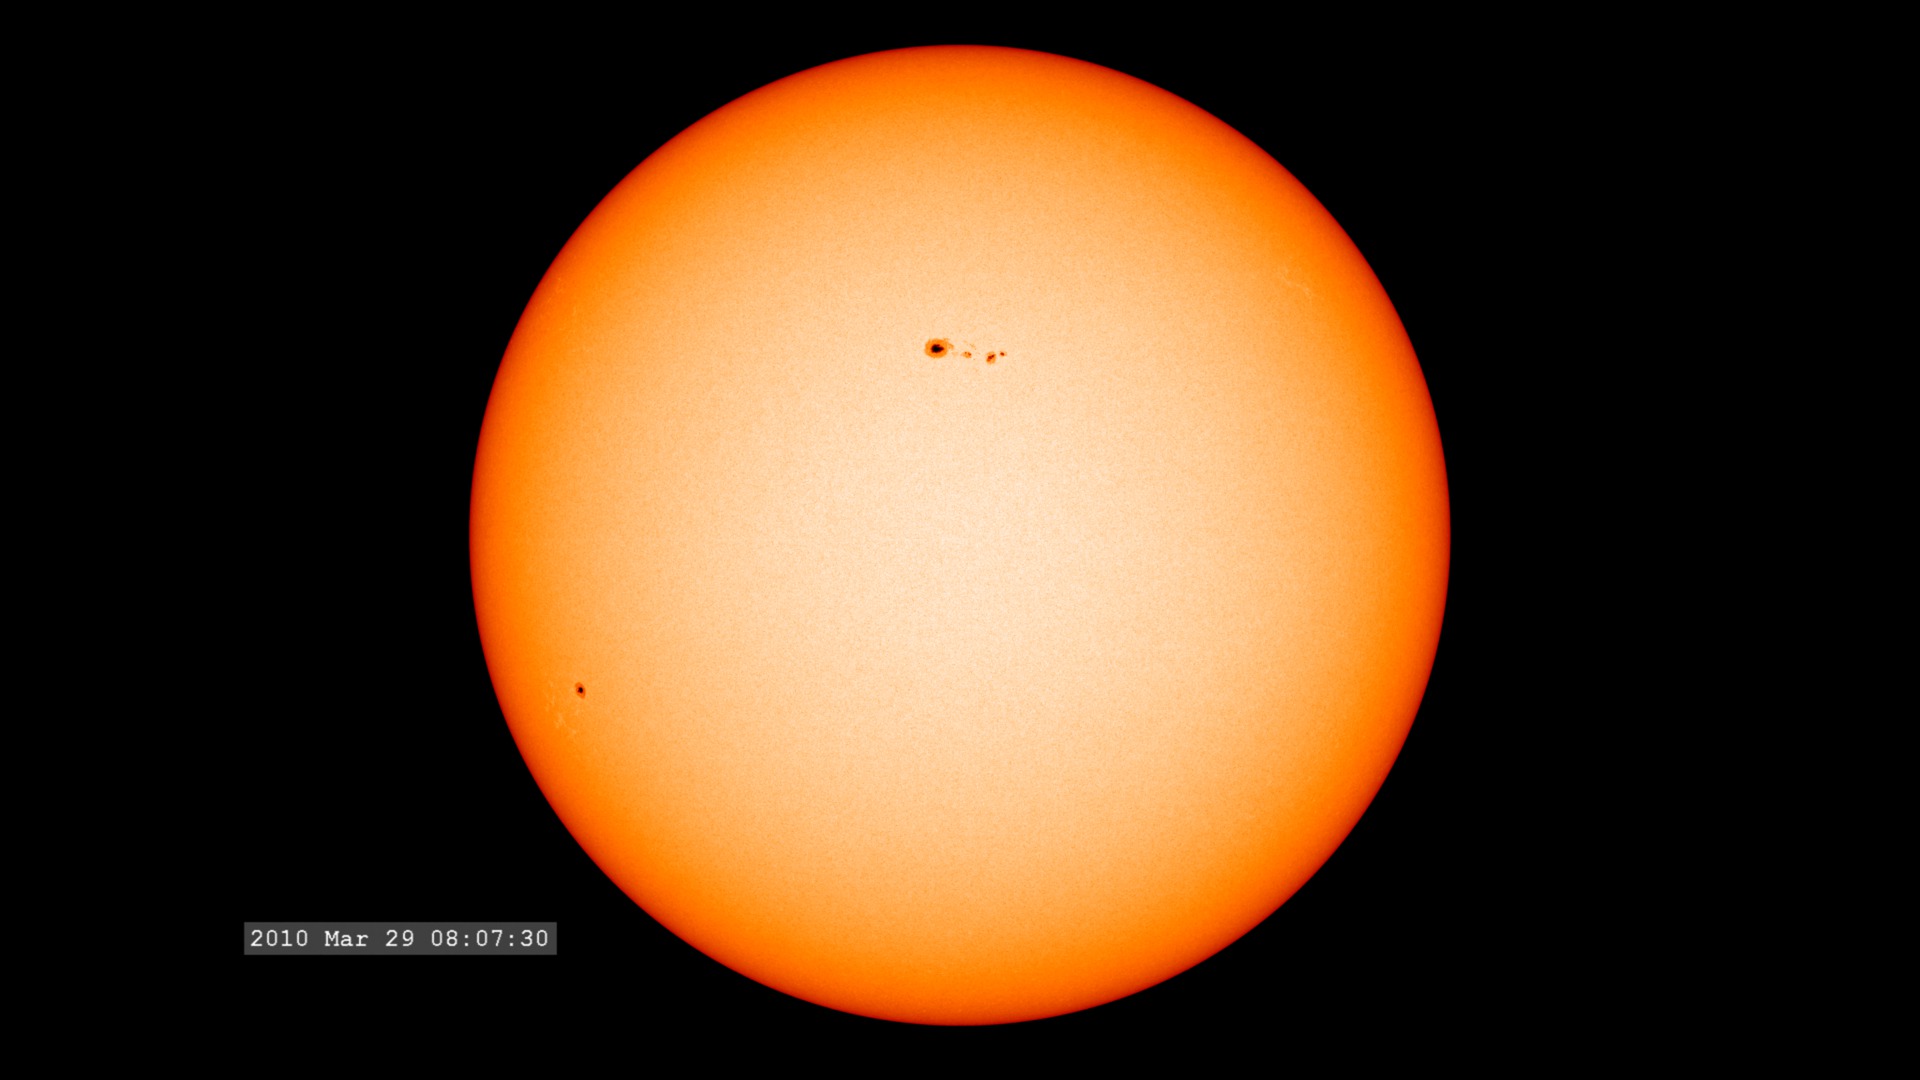
Go to this pageThis early sequence of HMI images from SDO focuses on a large sunspot group of Solar Cycle 24. ||
SDO/HMI Continuum Sunspot Closeup - March 29, 2010
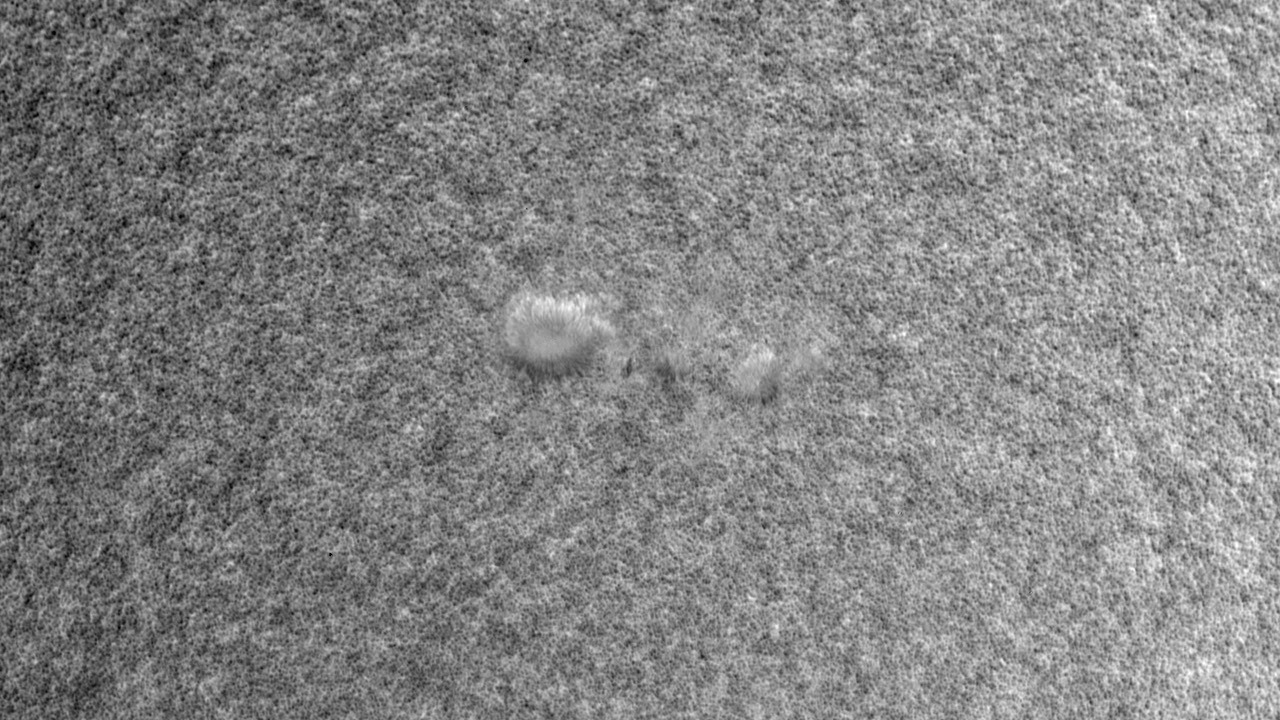
Go to this pageThis is a close-up view of a large sunspot group visible as the HMI instrument turned on their imagers. ||
SDO/HMI Continuum Sunspot Zoom-in - March 29, 2010
Go to this pageThis is a zoom-in view of a large sunspot group visible as the HMI instrument turned on their imagers. ||
SDO/HMI Continuum Full Disk View - April 7, 2010
Go to this pageThis early sequence of HMI images from SDO focuses on a large sunspot group of Solar Cycle 24. ||
SDO HMI Magnetograms
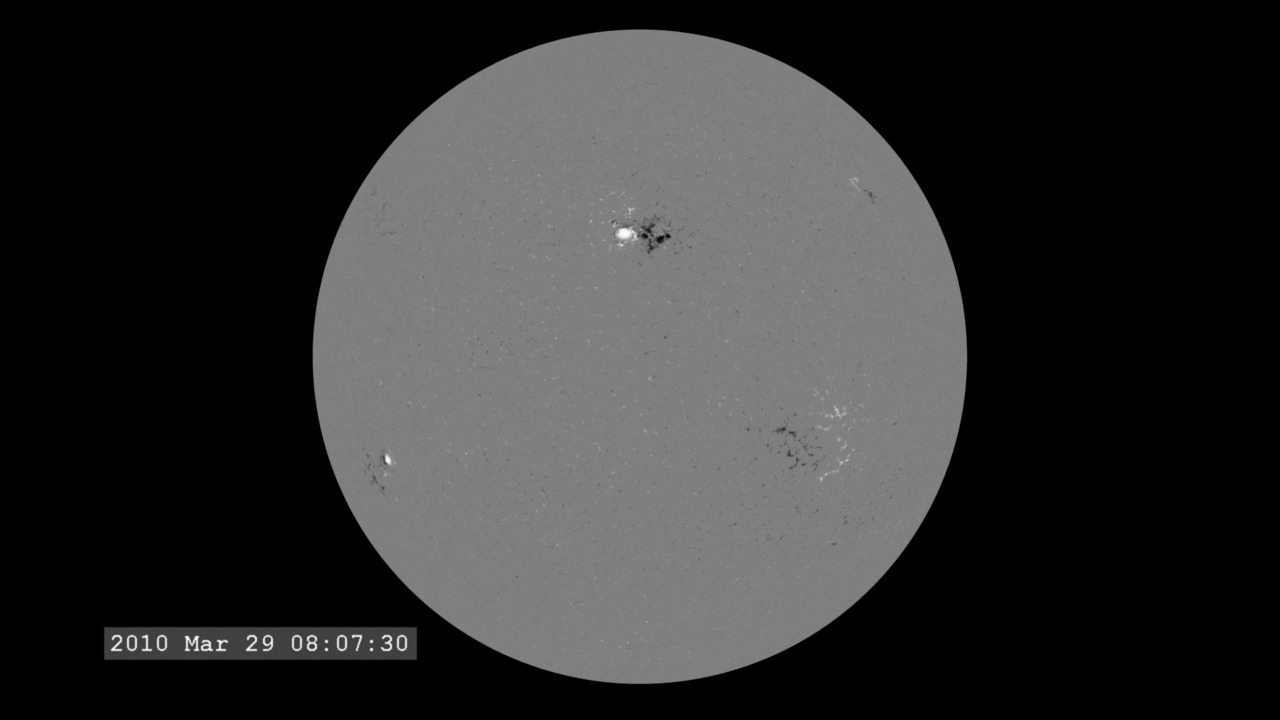
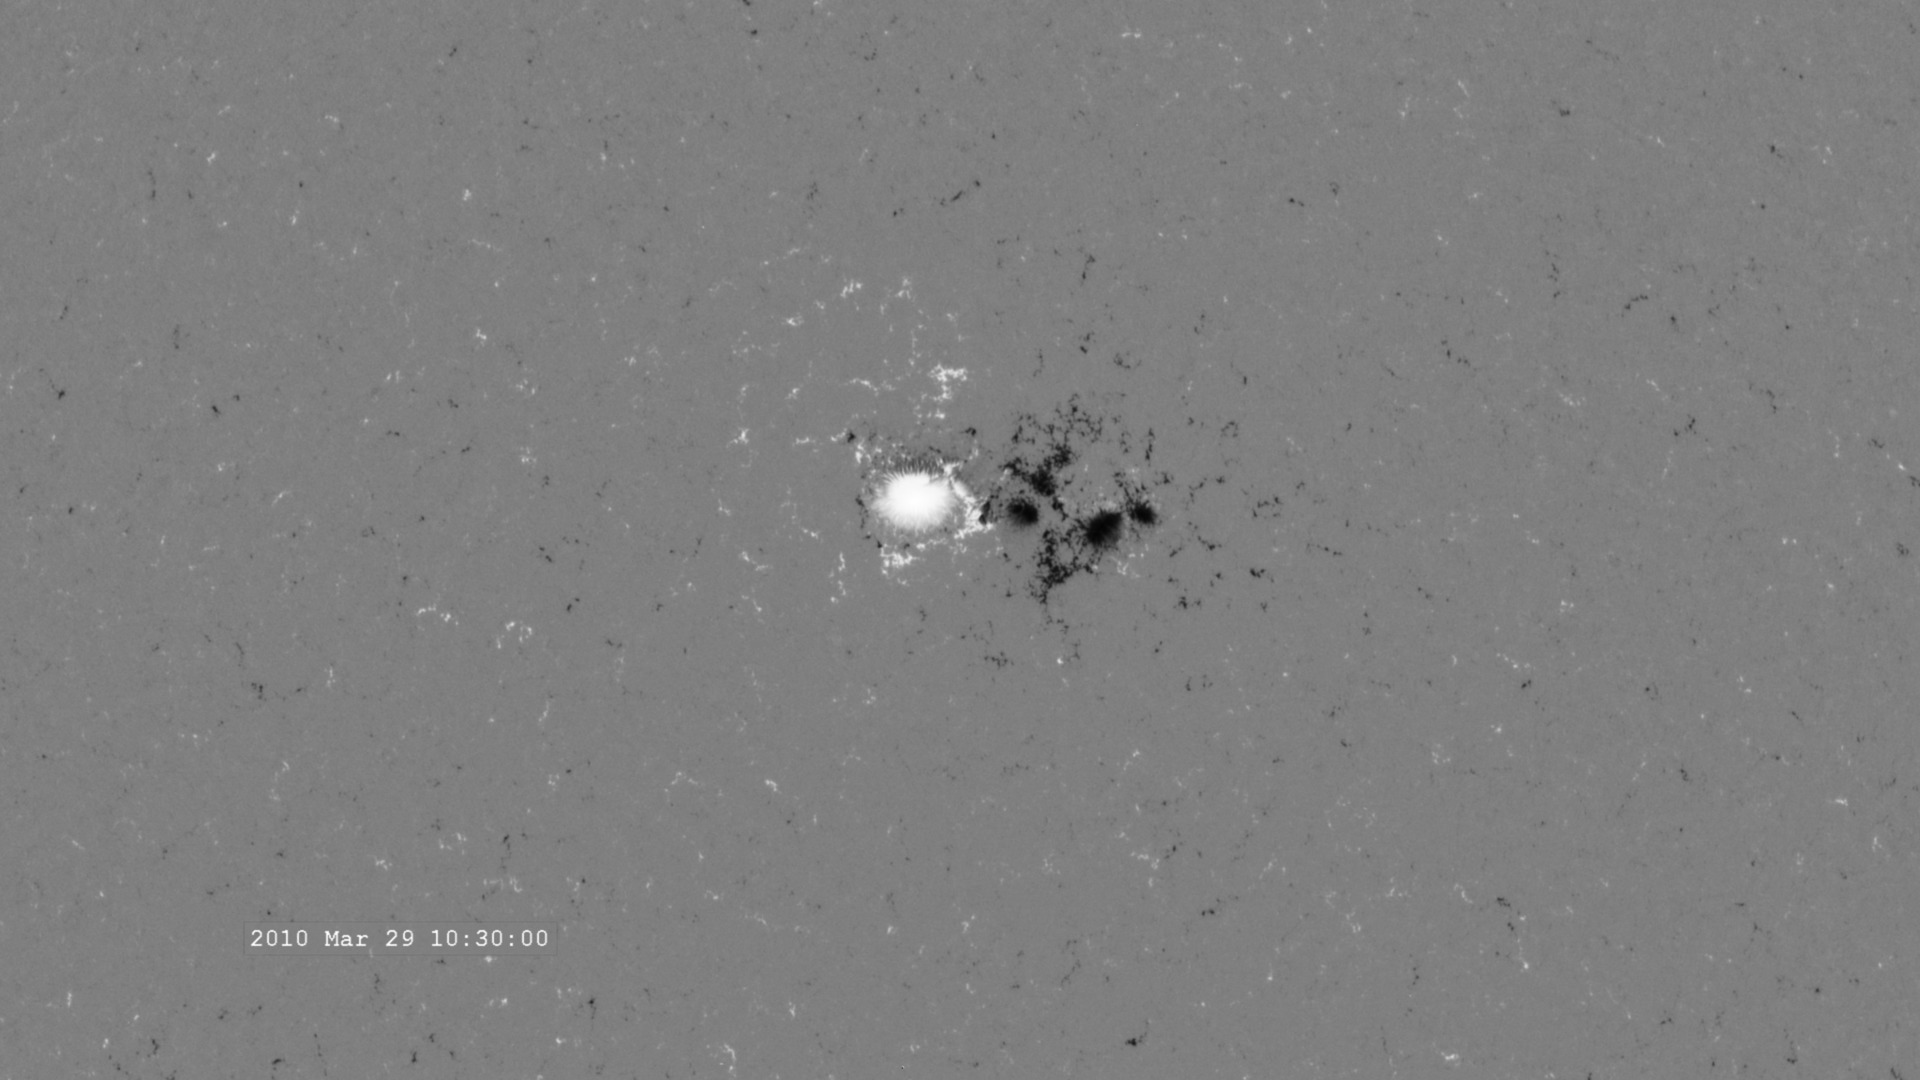
Magnetograms are constructed from multiple images, measuring the splitting of spectral lines in a magnetic field, called the Zeeman effect (Wikipedia).
The Helioseismic and Magnetic Imager (HMI) images the Sun in a set of narrow wavelengths which enables us to study motions at the solar surface and collect magnetic field information. Home Page for the Helioseismic and Magnetic Imager.
SDO/HMI Magnetogram Full Disk View - March 29, 2010
Go to this pageThis early sequence of images from the HMI imager is processed to reveal the magnetic field structure (magnetogram). White locations represent a positive magnetic field value (north polarity) while black represents a negative magnetic field value (south polarity). Grey is zero magnetic field.The black and white region slightly above the center corresponds to a visible sunspot. Weaker magnetic regions are visible around the disk. ||
SDO/HMI Magnetogram Sunspot Close-Up - March 29, 2010
Go to this pageThis early sequence of images from the HMI imager is processed to reveal the magnetic field structure (magnetogram). White locations represent a positive magnetic field value (north polarity) while black represents a negative magnetic field value (south polarity). Grey is zero magnetic field.This version is a close-up view of a large sunspot group. ||
SDO/HMI Magnetogram Sunspot Zoom-In - March 29, 2010
Go to this pageThis early sequence of images from the HMI imager is processed to reveal the magnetic field structure (magnetogram). White locations represent a positive magnetic field value (north polarity) while black represents a negative magnetic field value (south polarity). Grey is zero magnetic field.This movie zooms-in on a large sunspot group. ||
SDO/HMI Magnetogram Full Disk View - April 7, 2010
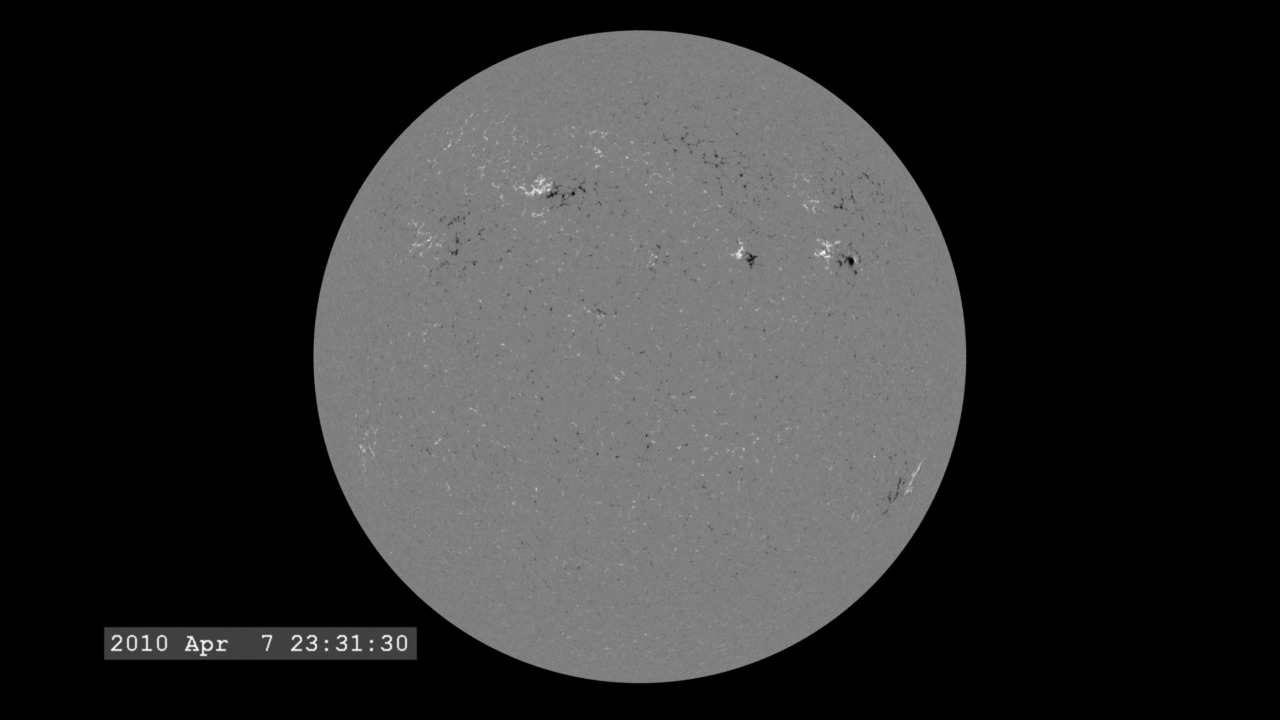
Go to this pageThis early sequence of images from the HMI imager is processed to reveal the magnetic field structure (magnetogram). White locations represent a positive magnetic field value (north polarity) while black represents a negative magnetic field value (south polarity). Gray is zero magnetic field.Notice that the surface magnetic fields reveal much more structure than the white-light images in SDO/HMI Continuum Full Disk View - April 7, 2010. ||
SDO HMI Dopplergrams
Dopplergrams are also constructed from multiple filtered images, measuring the speed of each pixel by measuring the Doppler Shift (Wikipedia) of the spectral line.
The Helioseismic and Magnetic Imager (HMI) images the Sun in a set of narrow wavelengths which enables us to study motions at the solar surface and collect magnetic field information. Home Page for the Helioseismic and Magnetic Imager.
SDO/HMI Dopplergram Sunspot Close-Up - March 29, 2010
Go to this pageThe dopplergram from SDO/HMI data shows the velocity of solar material on the line-of-sight. White pixels are moving away from the camera and black pixels are moving towards the camera. ||
SDO and Previous Missions
A Comparative View of the Sun: SDO/AIA 193 and SOHO/EIT 195
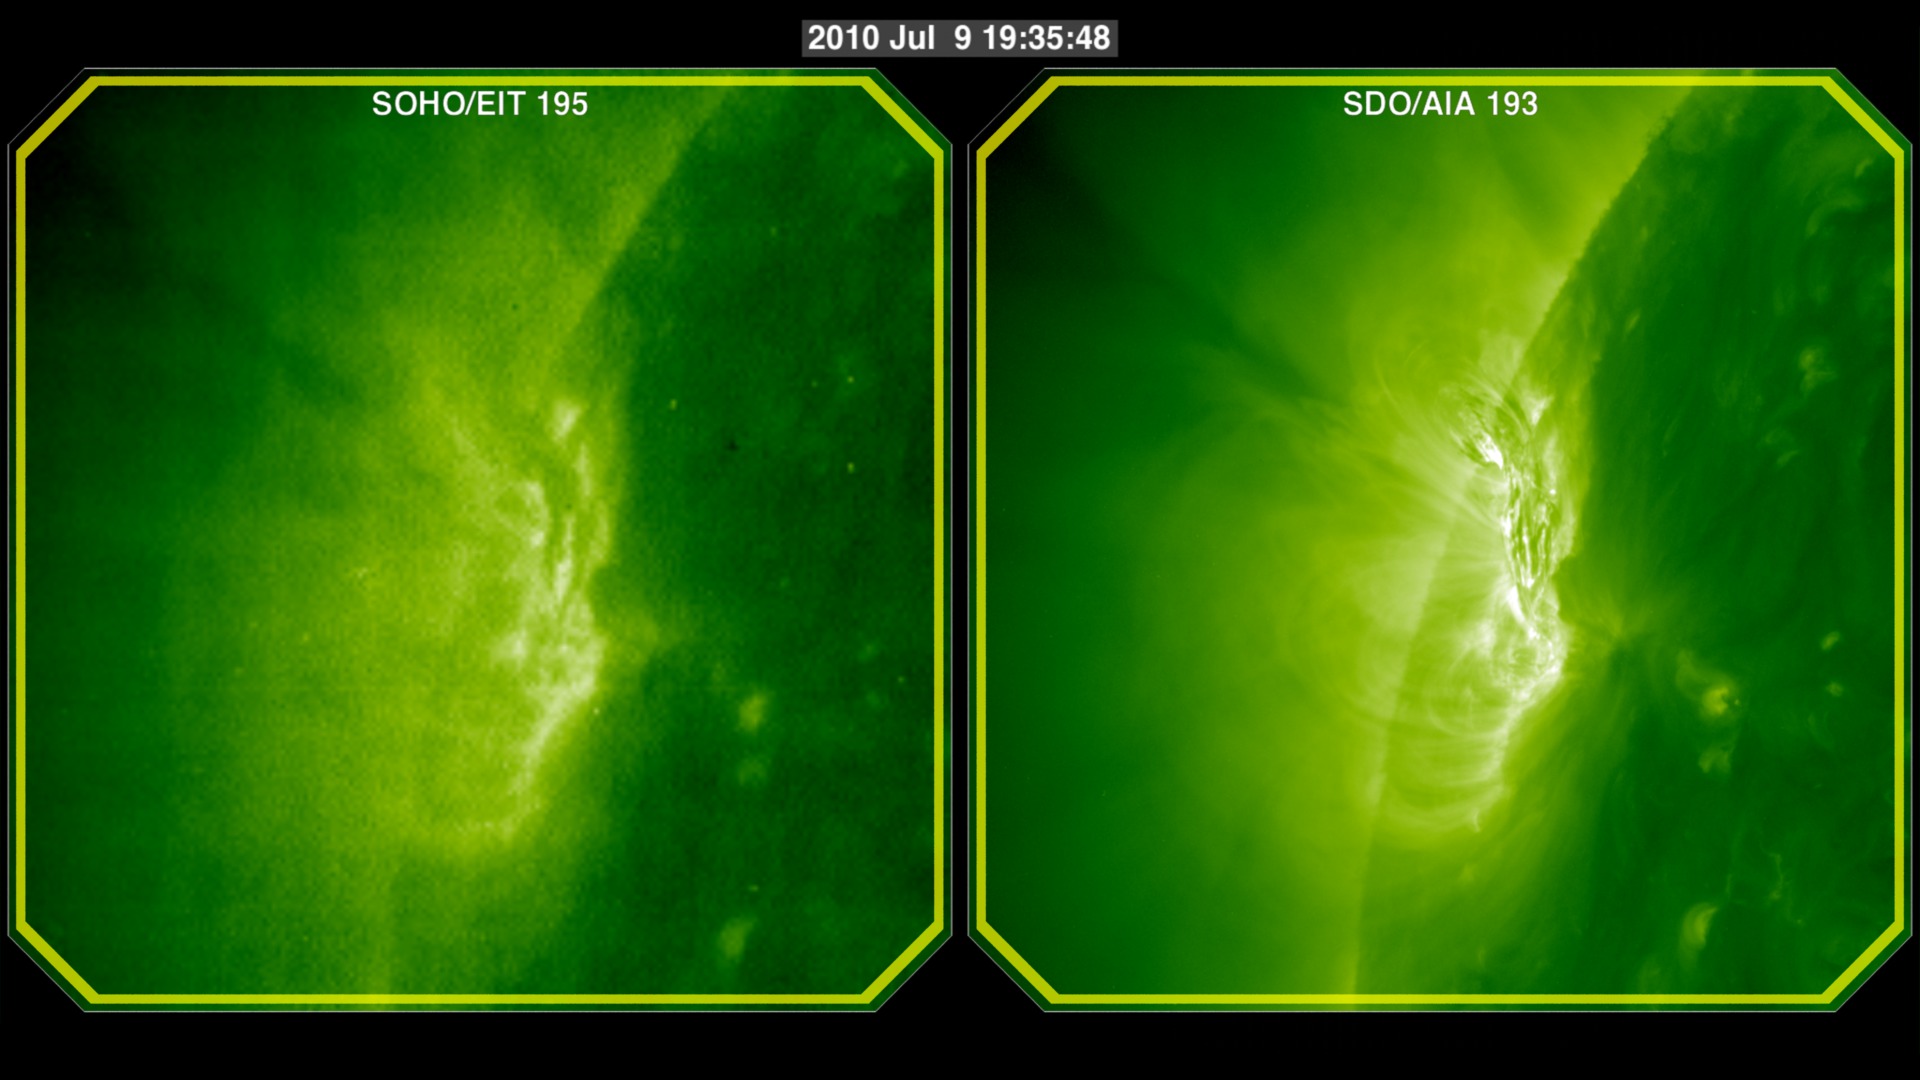
Go to this pageThis movie compares the spatial and temporal resolutions of the SDO/AIA (Atmospheric Imaging Assembly) imager to the SOHO/EIT (Extreme ultraviolet Imaging Telescope) imager. SOHO/EIT's highest resolution is 1024x1024 pixels with images taken about every 12 minutes for the 195 Ångstrom band. The SDO/AIA 193 band takes images at 4096x4096 pixels every twelve seconds!In this movie we can see the difference this makes for a closeup view of Active Region 1087. EIT reveals changes in the active region, which AIA reveals many details.This visualization is a companion piece to A Comparative View of the Sun: SDO/AIA 193 and STEREO-B/EUVI 195. ||
A Comparative View of the Sun: SDO/AIA 193 and STEREO-B/EUVI 195
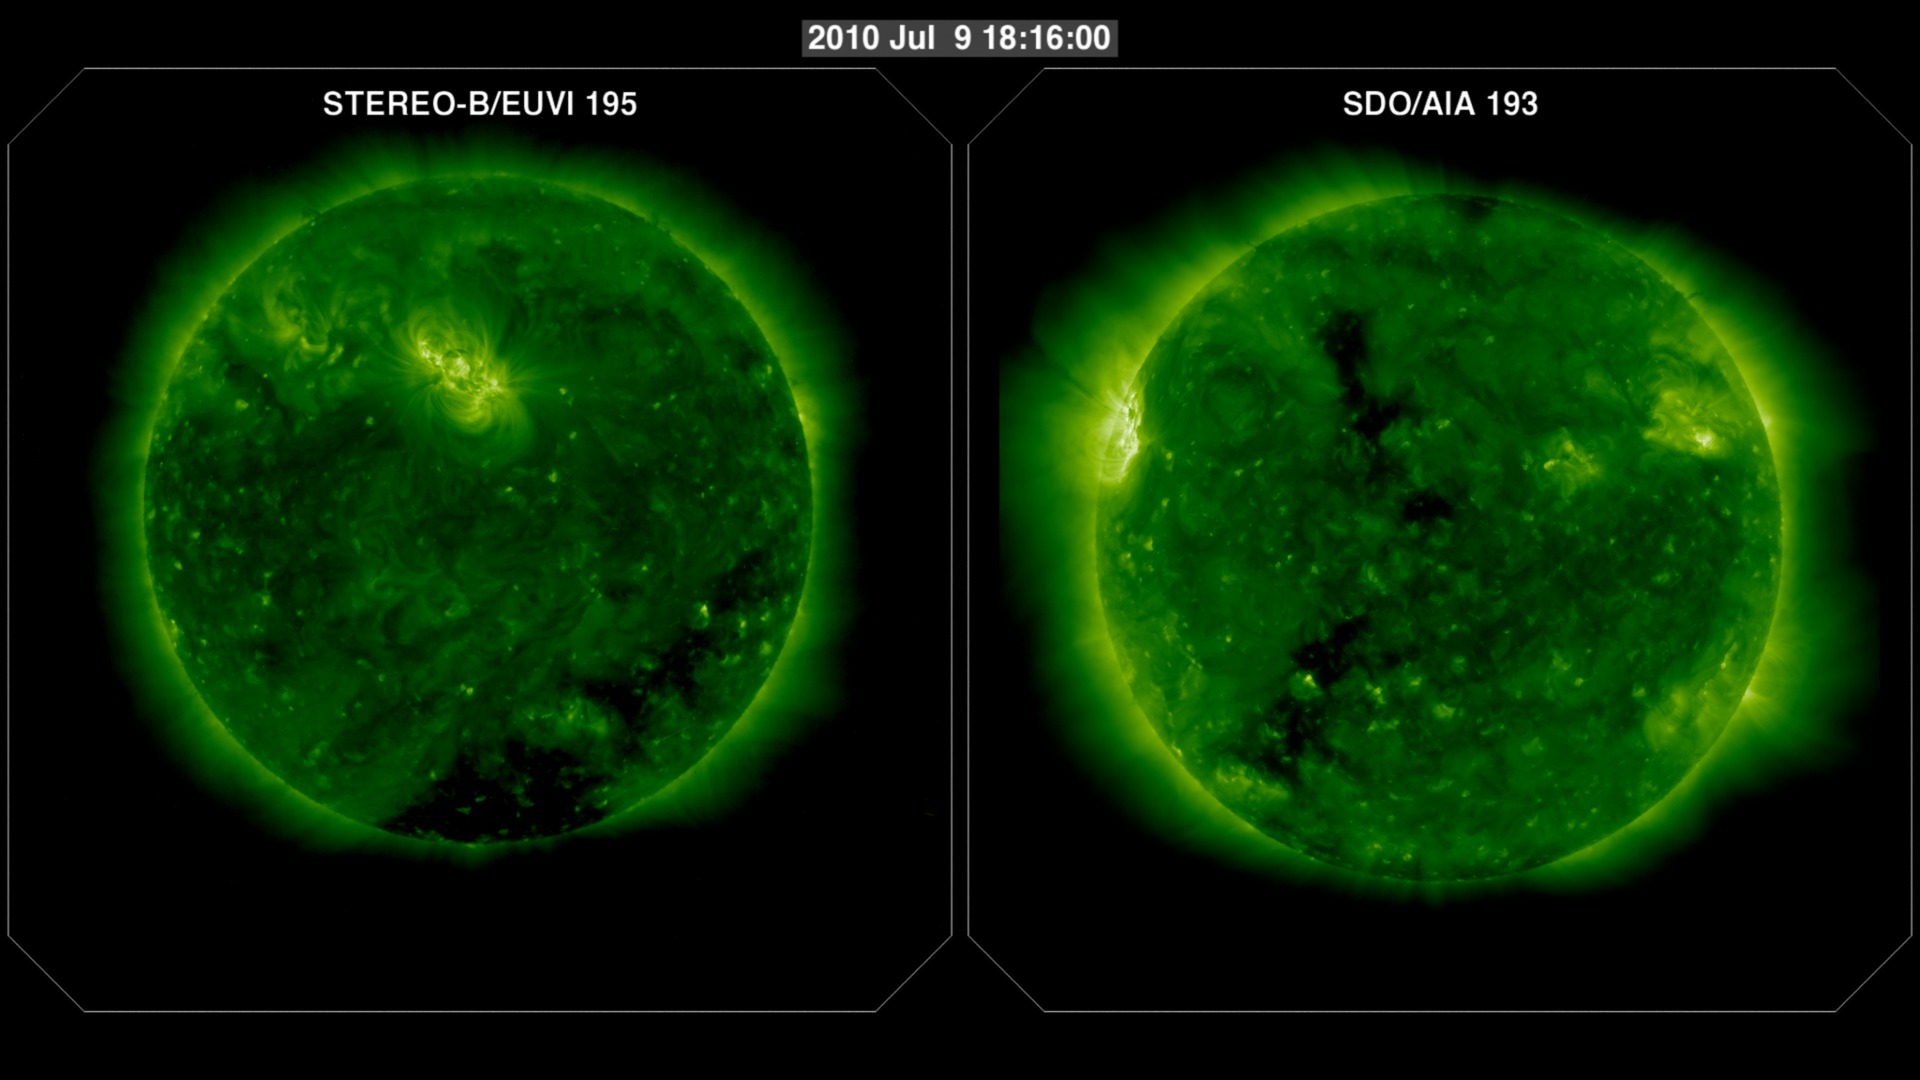
Go to this pageThis movie compares the spatial and temporal resolutions of the SDO/AIA (Atmospheric Imaging Assembly) imager to the STEREO/EUVI (Extreme UltraViolet Imager) imager. STEREO-B/EUVI's highest resolution is 2048x2048 pixels with images taken about every 5 minutes for the 195 Ångstrom band. The SDO/AIA 193 band takes images at 4096x4096 pixels every twelve seconds!While STEREO's vantage point at this time is very different from SDO, we can still identify some features of the Active Region 1087 in these two views. EUVI shows the launch of the filament, while AIA reveals many finer details.This visualization is a companion piece to A Comparative View of the Sun: SDO/AIA 193 and SOHO/EIT 195. ||
Additional SDO Resources
- Link
SDO First Light High Resolution Stills
Go to this pageStills from the AIA instrument on SDO. They show the March 30, 2010 "First Light" prominence eruption captured just after the AIA sensors were activated. All images are from the ultraviolet part of the spectrum, specifically the wavelengths of 304, 211, 193, and 171 Ångstroms. The stills are in multiple resolutions and are available as tiff and jpeg files. ||
SDO First Light Press Conference
Go to this pageA unique NASA spacecraft launched February 11, 2010, called the Solar Dynamics Observatory, or SDO, has started delivering images of the sun that have astonished scientists. SDO is the most advanced spacecraft ever designed to study the sun and its dynamic behavior. The spacecraft can produce images with clarity ten times better than high definition television and provide more comprehensive science data faster than any solar observing spacecraft in history. The goal of the mission is to help scientists study solar activity to improve forecasts of how the sun affects Earth.On April 21, 2010, NASA held a live press conference at the Newseum in Washington D.C. to unveil the first images and videos from SDO—SDO's First Light.A version of the press conference with captioning is available. ||

