Solar Flares
Overview
Solar energetic events that can impact Earth.
X-Class Flares
- Visualization
- Produced Video
- Visualization
- Produced Video
- Visualization
- Visualization
- Produced Video
- Visualization
- Produced Video
- Visualization
- Visualization
- Visualization
M-Class Flares
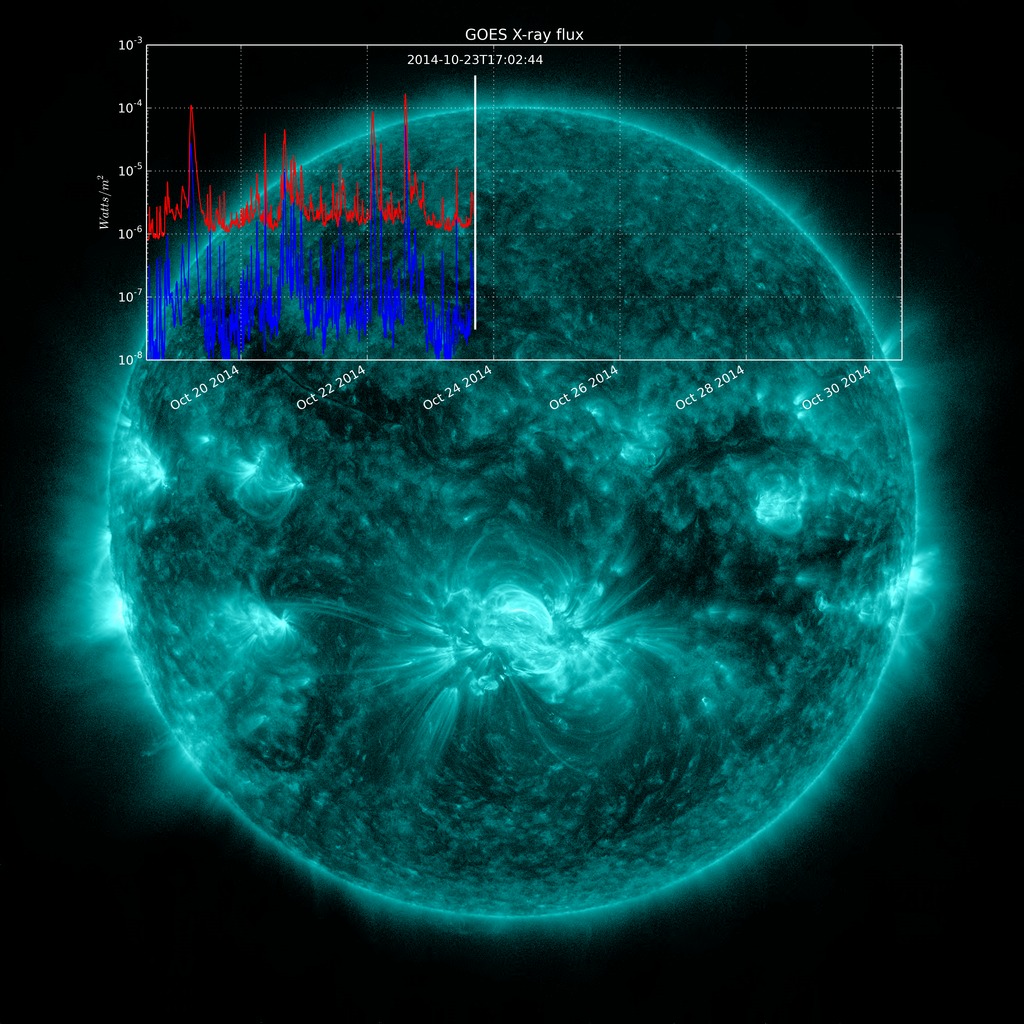
December 4, 2014: M6 Flare as Seen by Solar Dynamics Observatory & GOES
Go to this pageSDO 131 angstrom visual with overlaid plot of GOES X-ray flux during the time span. || 20141204_131AIA-GOES.composite.00500_print.jpg (1024x1024) [337.7 KB] || 20141204_131AIA-GOES.composite.00500_searchweb.png (320x180) [70.8 KB] || 20141204_131AIA-GOES.composite.00500_web.png (320x320) [107.2 KB] || 20141204_131AIA-GOES.composite.00500_thm.png (80x40) [6.1 KB] || 20141204_131AIA-GOES_1024x1024.webm (1024x1024) [3.0 MB] || 20141204_131AIA-GOES_1024x1024.mp4 (1024x1024) [68.0 MB] || SDO131AnGOES (4096x4096) [64.0 KB] || 20141204_131AIA-GOES.mp4 (4096x4096) [1.2 GB] ||
August 24, 2014: Magnificent M-flare
Go to this pageM-flares are not the most powerful flares the Sun can emit, but sometimes even they can exhibit visually exciting behavior.Here we show the lead-up to an M-flare which lauches a large amount of plasma into space. The eruption takes place starting around 12:00 UTC and launches over the next 15 minutes. But stay with it, and you'll also see some of the plasma falling back towards the Sun around 13:50 UTC. ||
The M7 Flare of October 2, 2014, seen from SDO
Go to this pageIn this 171 ångstrom image, the group of coronal loops on the lower right of the solar limb launches a stream of plasma. || Oct2014Mflare_171A_stand.HD1080i.00748_print.jpg (1024x576) [68.2 KB] || Oct2014Mflare_171A_stand.HD1080i.00748_searchweb.png (320x180) [46.9 KB] || Oct2014Mflare_171A_stand.HD1080i.00748_thm.png (80x40) [4.4 KB] || Oct2014Mflare_171A_stand.HD1080i.00748_web.png (320x180) [46.9 KB] || Oct2014Mflare_171A_stand_1080.mp4 (1920x1080) [23.2 MB] || Oct2014Mflare_171A (1920x1080) [128.0 KB] || Oct2014Mflare_171A_stand_720.mp4 (1280x720) [9.7 MB] || Oct2014Mflare_171A_stand_720.webmhd.webm (960x540) [2.9 MB] || Oct2014Mflare_171A_stand_360.mp4 (640x360) [2.6 MB] ||
Visible Light Flares
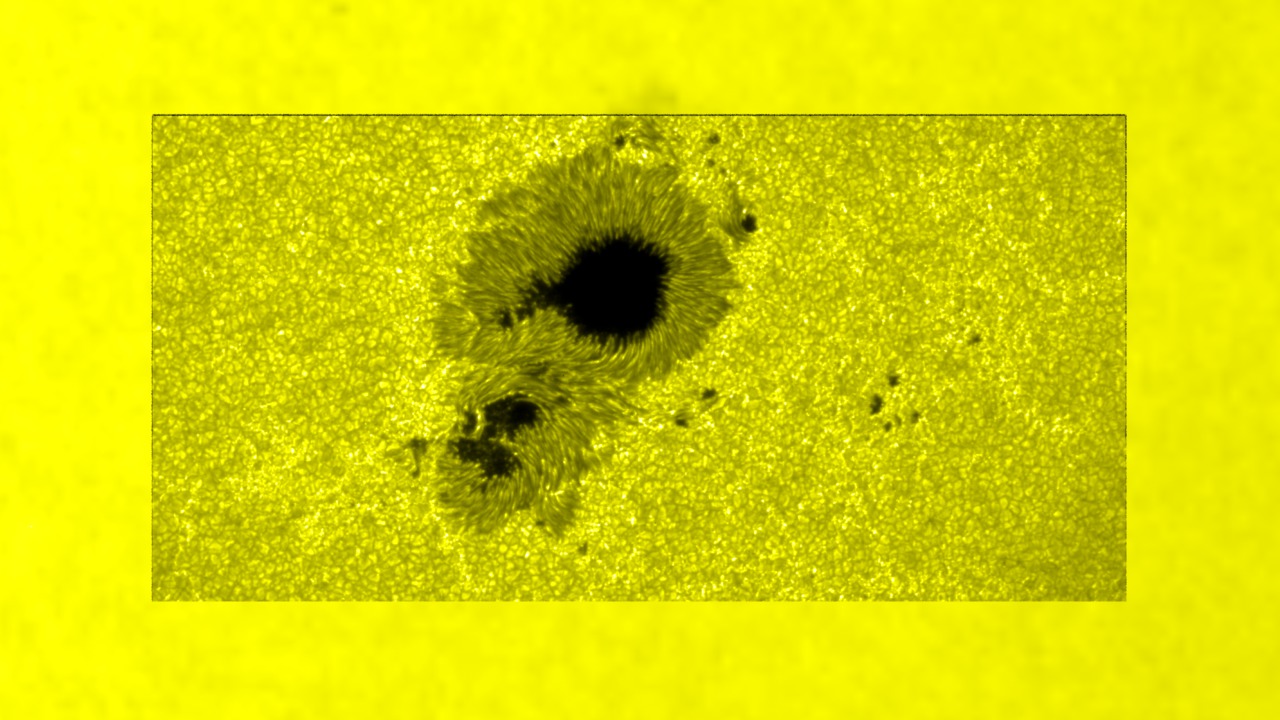
Hinode's High-resolution view of solar granulation
Go to this pageThis zoom-in from a full view of the Hinode Solar Optical Telescope (SOT) (the same as in animation 3411) shows details of solar granulation and how rapidly it changes. ||
Solar Flares in X-rays
A Multi-Mission View of the AR9906 Solar Flare with Instrument Labels
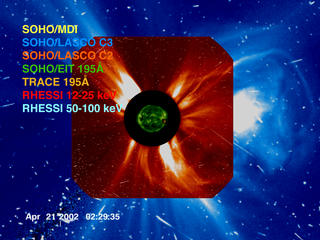
Go to this pageHere's a view of the Sun, from the point of view of a fleet of Sun-observing spacecraft - SOHO, TRACE, and RHESSI. The time scales of the data samples in this visualization range from six hours to as short as 12 seconds and the display rate varies throughout the movie. The region and event of interest is the solar flare over solar active region AR9906 on April 21, 2002. In this visualization, the instrument names appear in a color roughly matching the color used for the data, and black corresponds to no (current) instrument coverage. ||
RHESSI Observes 2.2 MeV Line Emission from a Solar Flare
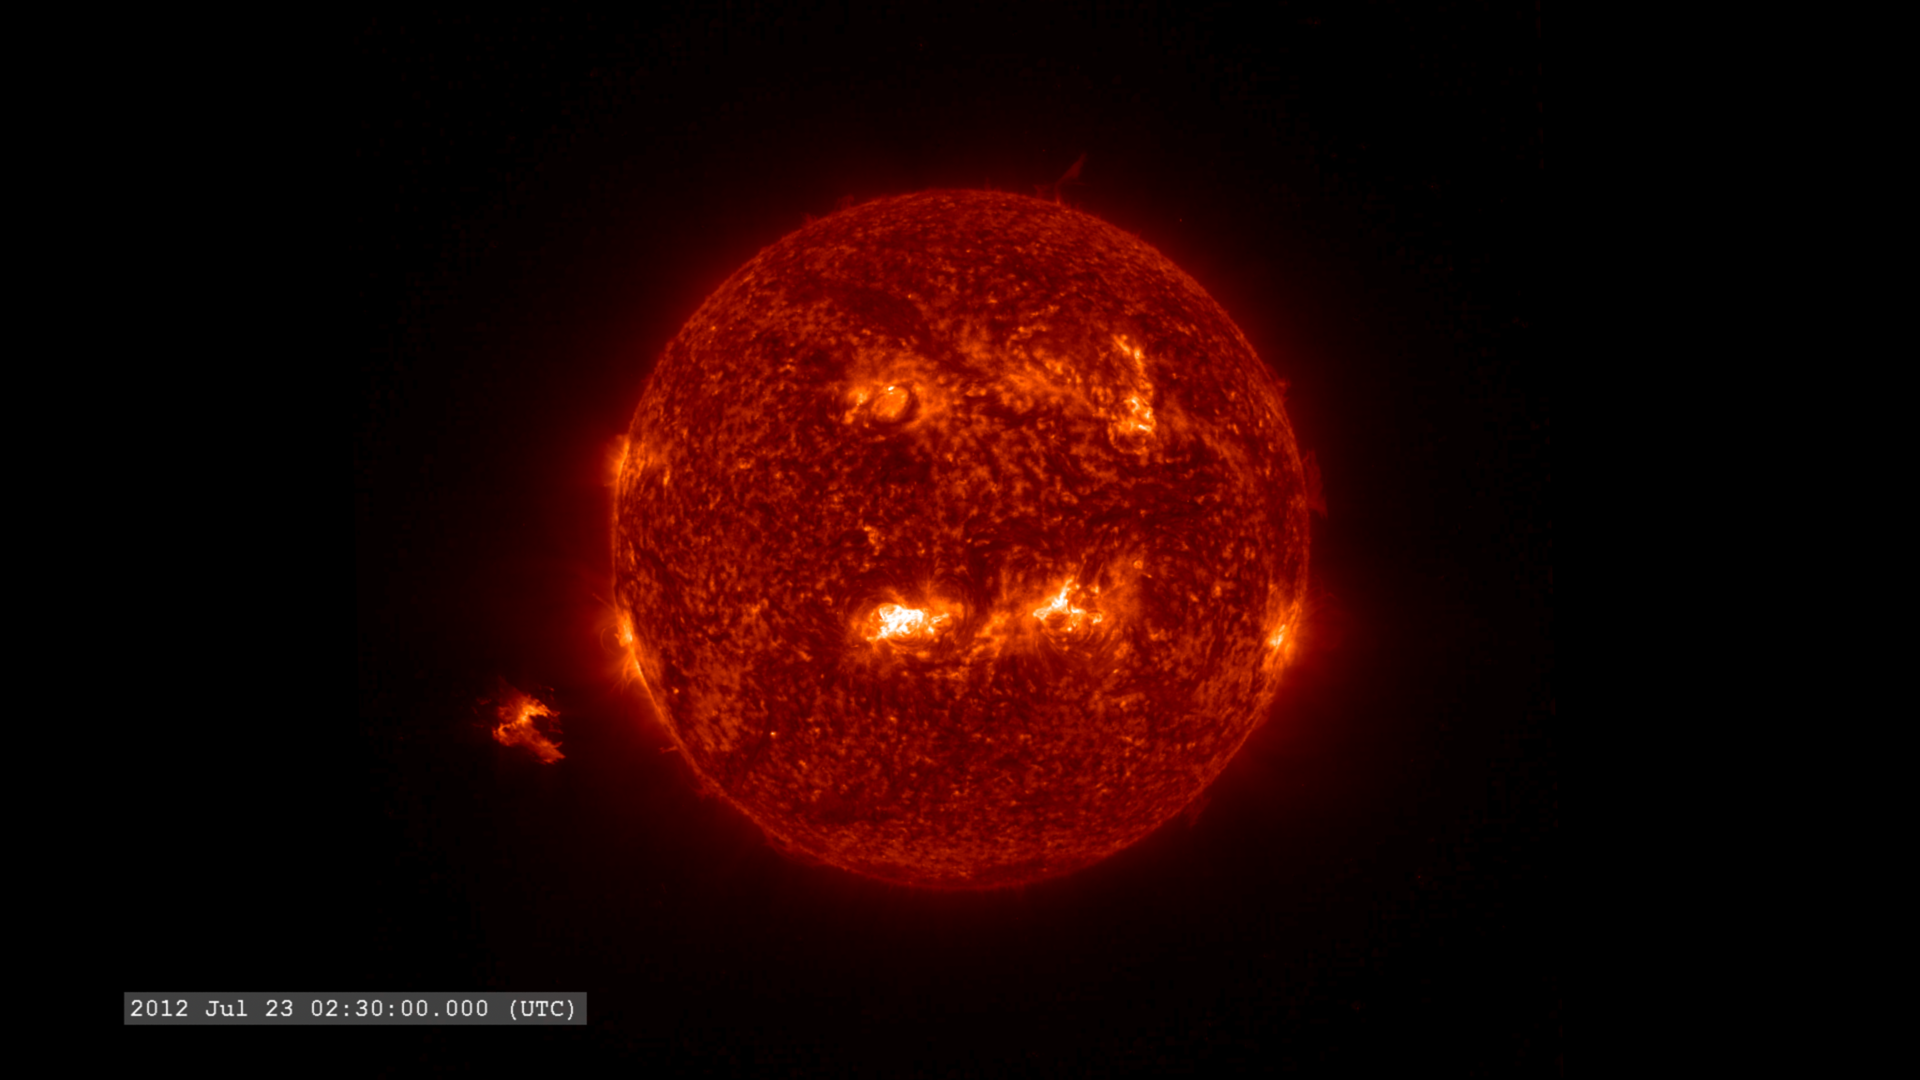
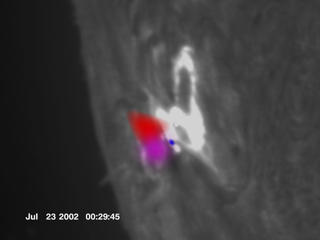
Go to this pageThe solar flare at Active Region 10039 on July 23, 2002 exhibits many exceptional high-energy phenomena including the 2.223 MeV neutron capture line and the 511 keV electron-positron (antimatter) annihilation line. In the animation, the RHESSI low-energy channels (12-25 keV) are represented in red and appears predominantly in coronal loops. The high-energy flux appears as blue at the footpoints of the coronal loops. Violet is used to indicate the location and relative intensity of the 2.2MeV emission. ||
RHESSI and TRACE View of January 20, 2005 Solar Flare
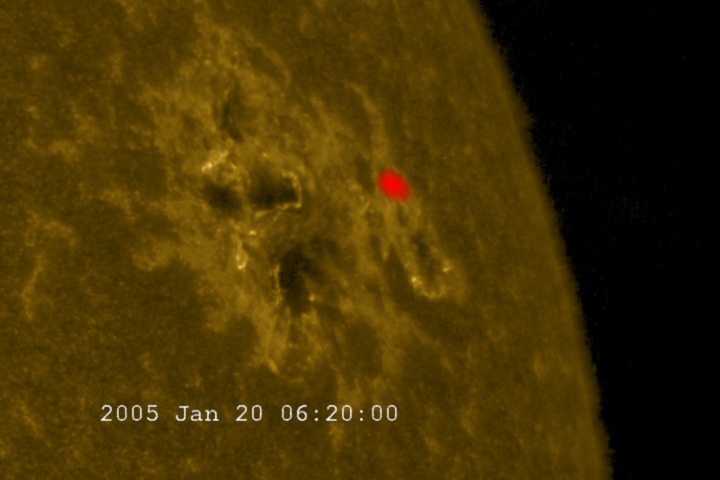
Go to this pageRHESSI spacecraft images of gamma-rays (blue) and X-rays (red) thrown off by the hottest part of the flare are shown with UV images from the TRACE spacecraft. The gamma rays are made by energetic protons at the Sun. Scientists were surprised that the gamma rays matched the energy spectrum of protons at Earth: the proton storm may have come directly from the Sun and not from the CME as anticipated. ||
Halloween 2003 Solar Storms: GOES/SXI X-ray view
Go to this pageHere is a view of the full solar disk during a two-week period in October and November of 2003 which exhibited some of the largest solar activity events since the advent of space-based solar observing. The GOES-12/Solar X-Ray Imager was experiencing significant problems during this time period and was offline during part of the opening and closing portions of this movie, which is why there is a significant number of black frames. Actual data collection began on October 28, 2003 and terminated on November 5, 2003.This movie is part of a series of movies with matching cadence designed to play synchronously with each other. The other movies in this series are Halloween 2003 Solar Storms: SOHO/EIT Ultraviolet, 195 angstromsHalloween 2003 Solar Storms: SOHO/EIT Ultraviolet, 304 angstromsHalloween 2003 Solar Storms: SOHO/MDI ContinuumHalloween 2003 Solar Storms: SOHO/MDI MagnetogramsHalloween 2003 Solar Storms: SOHO/EIT and SOHO/LASCO ||
Solar Flare Science
The Difference Between CMEs and Flares
Go to this pageCoronal mass ejections (CMEs) and flares are both solar events, but they are not the same. This video shows the differences between the two by highlighting specific features of each. ||
X-Class: A Guide to Solar Flares
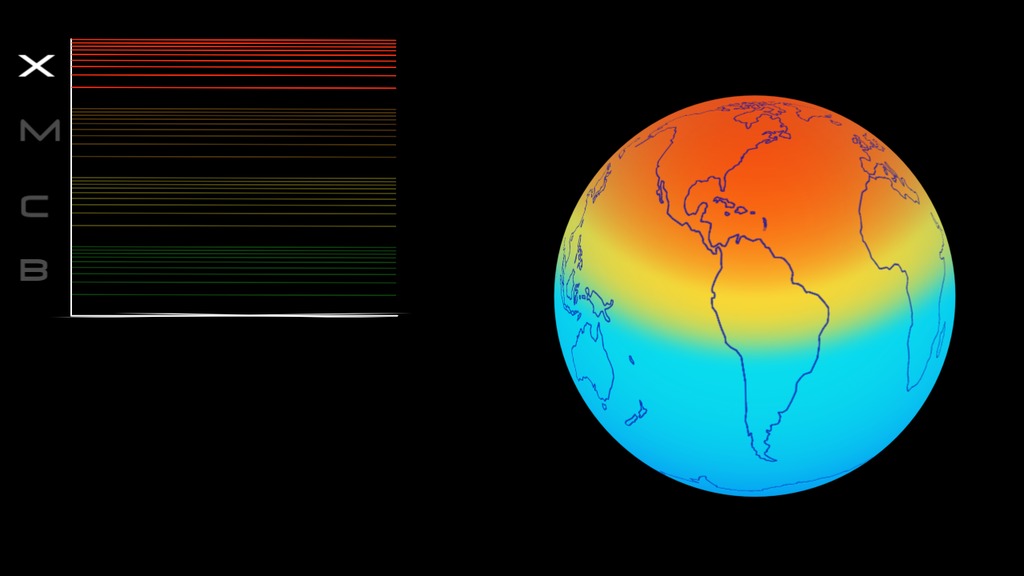
Go to this pageFlares happen when the powerful magnetic fields in and around the sun reconnect. They're usually associated with active regions, often seen as sun spots, where the magnetic fields are strongest. Flares are classified according to their strength. The smallest ones are B-class, followed by C, M and X, the largest. Similar to the Richter scale for earthquakes, each letter represents a ten-fold increase in energy output. So an X is 10 times an M and 100 times a C. Within each letter class, there is a finer scale from 1 to 9. C-class flares are too weak to noticeably affect Earth. M-class flares can cause brief radio blackouts at the poles and minor radiation storms that might endanger astronauts. Although X is the last letter, there are flares more than 10 times the power of an X1, so X-class flares can go higher than 9. The most powerful flare on record was in 2003, during the last solar maximum. It was so powerful that it overloaded the sensors measuring it. They cut-out at X17, and the flare was later estimated to be about X45. A powerful X-class flare like that can create long lasting radiation storms, which can harm satellites and even give airline passengers, flying near the poles, small radiation doses. X flares also have the potential to create global transmission problems and world-wide blackouts. ||
Simplified Model for a Solar Flare
Go to this pageThis solar flare animation illustrates the role of magnetic field lines and reconnection events in the phenomenon. || Movie of simplified solar flare model || Flare_pre.00027_print.jpg (1024x691) [77.8 KB] || Flare_thm.png (80x40) [16.5 KB] || Flare_pre.jpg (320x197) [7.6 KB] || Flare_pre_searchweb.jpg (320x180) [68.4 KB] || Flare.webmhd.webm (960x540) [2.4 MB] || Flare.mpg (720x486) [2.6 MB] ||
