Space Weather Modeling
Overview
Energetic events on the Sun can have dramatic impact on Earth and its magnetosphere. These natural events can have significant effects on Earth and space-based technologies that can cause anything from inconveniences (such as minor communications and power disruptions) to high-impact events that have significant political and economic implications (outages of large sections of the electrical power grid and other support infrastructure).
To better meet these challenges, mathematical models of the heliospheric and geospace environment are under development to better forecast these solar energetic events and their impacts on Earth.
The visualizations here illustrate two models generated by the CCMC for modeling space weather events. The CCMC hosts many different computational models. Both models were generated based on a single coronal mass ejection (CME) event in December 2006.
Enlil: The Enlil model is a time-dependent 3-D magnetohydrodynamic (MHD, Wikipedia) model of the heliosphere. In these simulations, the model covers a torus-like region around the Sun, with the inner edge at about 0.1 astronomical units (AU) (about 22 solar radii) from the Sun and the outer edge extends beyond the orbit of Mars (1.5 AU). The model extends to 60 degrees above and below the solar equator. The model propagates the changes in particle flows and magnetic fields.
BATS-R-US: BATS-R-US is also an MHD model of plasma from the solar wind moving through the Earth's magnetic dipole field. The model is initialized using measurements of the solar wind density, velocity, temperature, and magnetic field from satellites orbiting L1, such as ACE.
The Original Coronal Mass Ejection (CME)
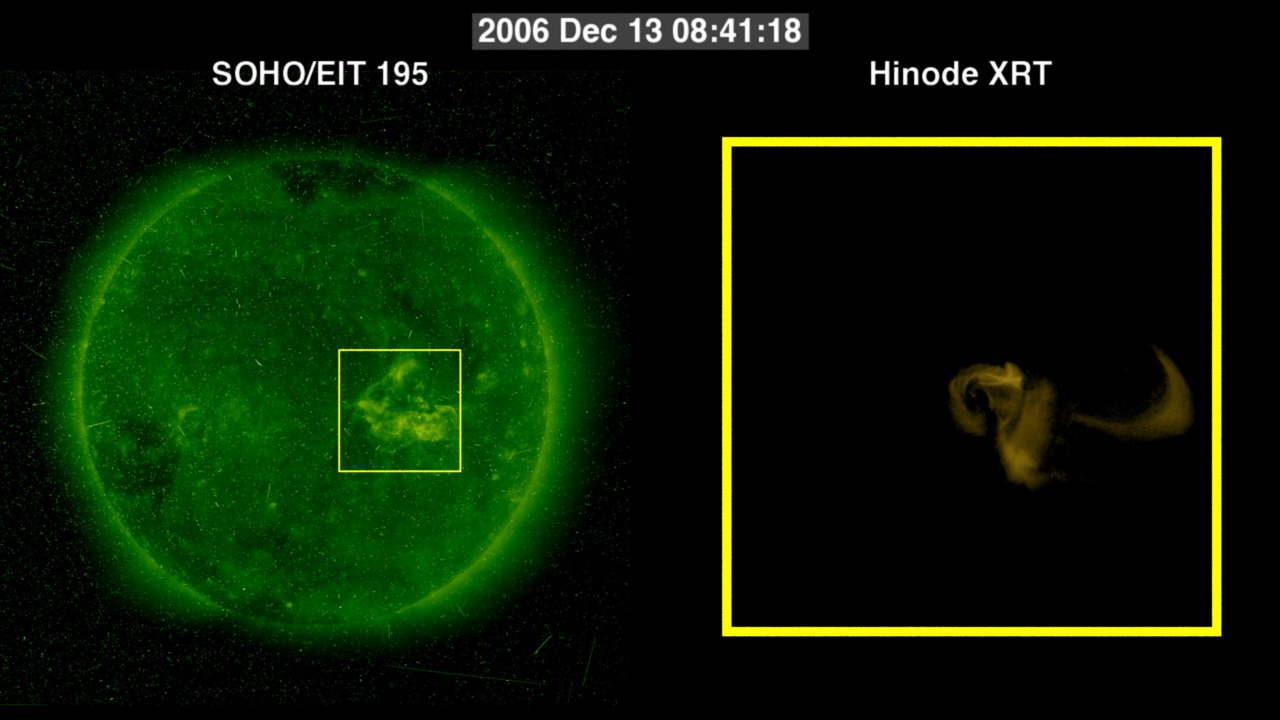
Here are satellite views of the original flare/CME event of December 13, 2006 02:54 GMT on which these simulation runs are based.
Hinode's High-Resolution View of the Sun
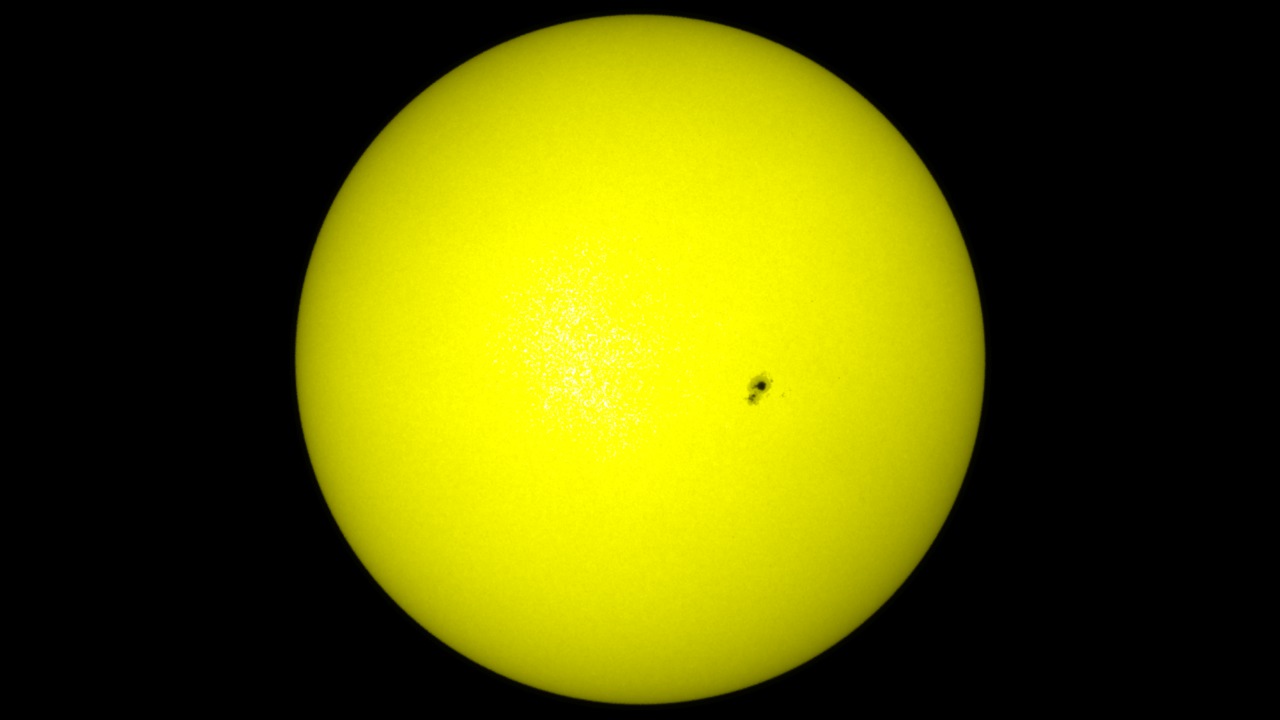
Go to this pageA new sunspot collided with an existing sunspot which built up a highly sheared magnetic configuration. This resulted in a solar flare on December 13, 2006. ||
December 2006 Flare from SOHO/EIT and Hinode/XRT
Go to this pageThis movie shows data of the December 13, 2006 flare event seen by SOHO/EIT (left) and Hinode XRT (right). The field-of-view of the Hinode images is marked with the yellow border on SOHO/EIT.This movie shows the same event as that in Hinode's High-Resolution View of the Sun. ||
The Computer Modeled Event
Space Weather Event: Incoming View
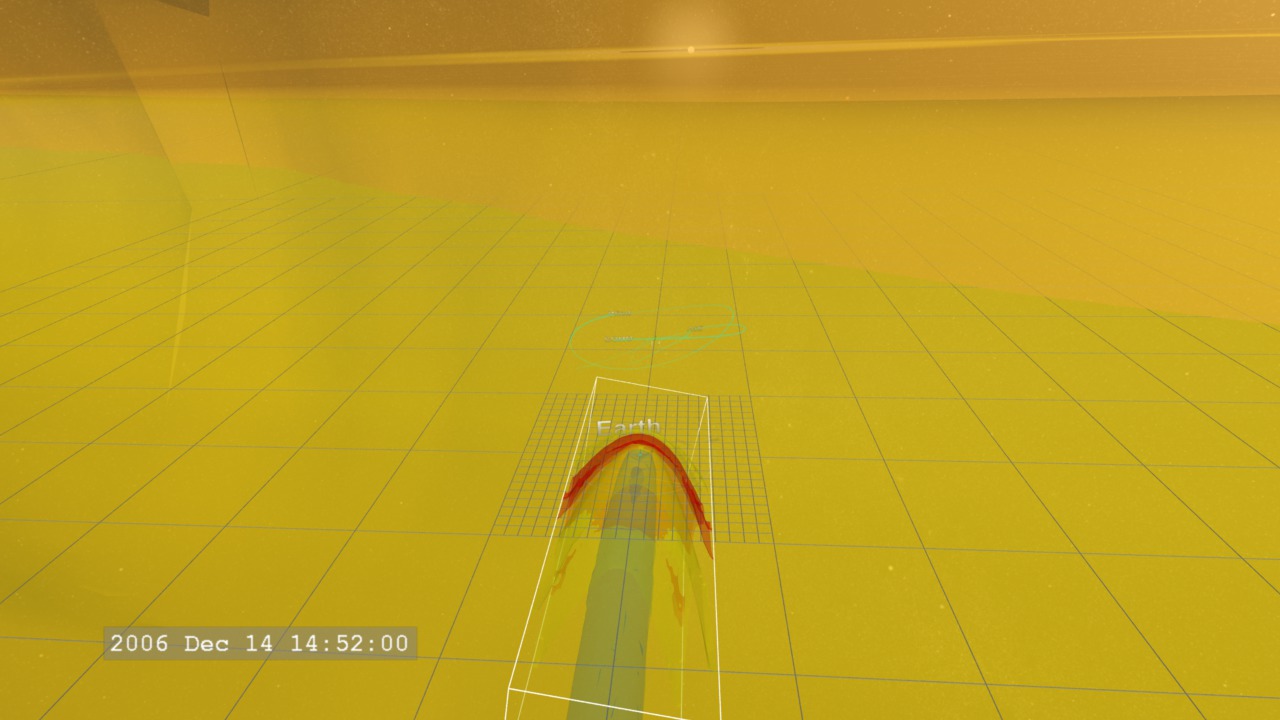
Go to this pageWe open with a view from high above the ecliptic plane, at the space between the Sun (left) and the Earth (within the small rectangular box on the right). In the plane of the Earth's orbit, we show a 'slice' of the Enlil model showing the particle density profile of the solar wind (white to yellow for decreasing particle density). The spiral 'rotating water sprinkler' pattern in the density is the Parker spiral (Wikipedia). The nested grid pattern centered on the Earth, provides a sense of scale to the scene. The smallest grid square in the opening view is 1,000 Earth radii on each side. The scale changes by a factor of ten for each step larger or smaller in size.We zoom down to the Earth as the CME (orange surface) erupts in the direction of the Earth, then move into a position behind the Earth with the Sun visible in the distance.As the particle density enhancement from the CME strikes the Earth, we see the Earth's magnetosphere respond, with the outer, high density surface (red) 'blown away'. This surface location corresponds roughly to the location of the bow shock. The bow shock has not been eliminated, only some of its particles have been depleted, to be carried off in the CME and solar wind. As the densest material of the CME passes (orange surface), plasma from the CME continues to flow by the Earth, stretching the magnetosphere into a long, thin structure behind the Earth.The magnetosphere slowly recovers from the 'impact', and regions that can confine higher particle densities reform - the red surfaces return. But not for long as the rarefaction (Wikipedia) behind the CME reaches the Earth. This lower density region provides fewer particles to repopulate the magnetosphere and makes it easier for particles confined in the magnetosphere to 'leak' out into the solar wind.For the BATS-R-US model, the isosurface colors correpond to densities of: red=20 AMUs per cubic centimeter, yellow=10.0 AMUs per cubic centimeter, light blue=1.0 AMUs per cubic centimeter, and blue=0.1 AMUs per cubic centimeter. An AMU corresponds to about the mass of a hydrogen atom, so the value roughly corresponds to the number of atoms per cubic centimeter.This visualization is part of a series of visualizations on space weather modeling. ||
Space Weather Event: The View from L1
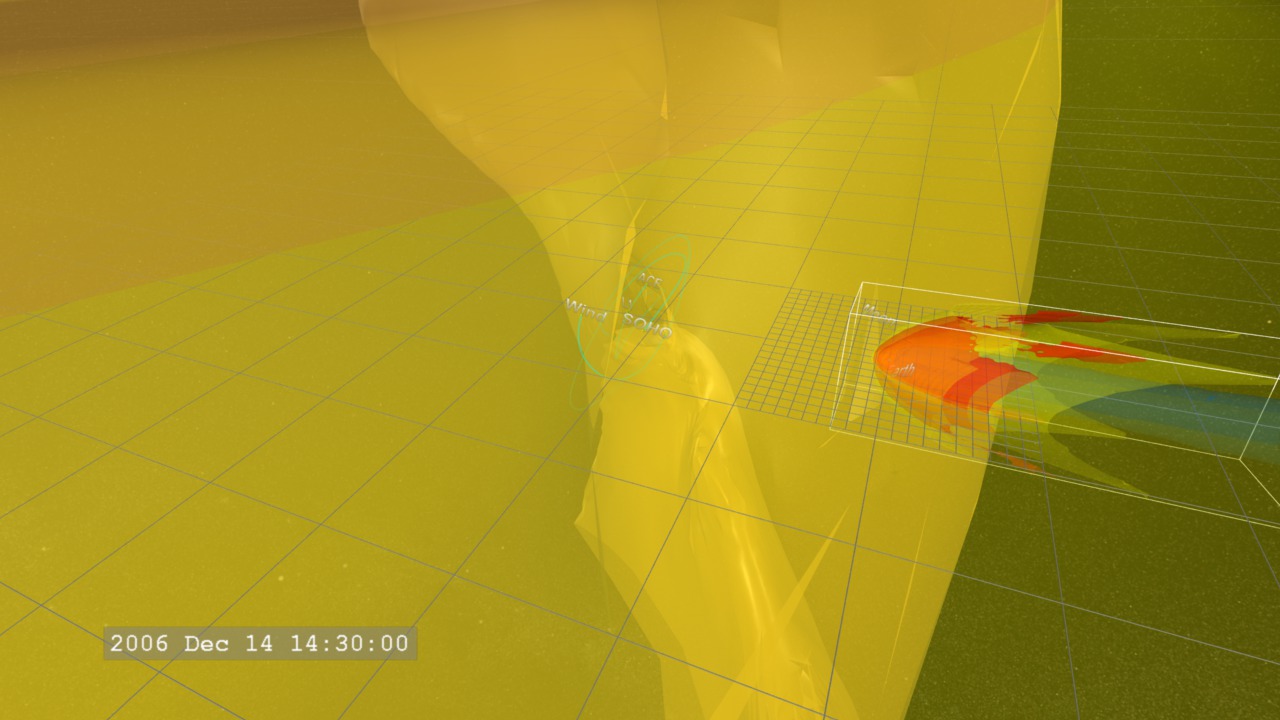
Go to this pageWe start from a position 'behind' the Earth, looking towards the Sun. From this position we see the orbit of the Moon as well as three of the heliospheric 'sentinels' (see "Sentinels of the Heliosphere"), ACE, SOHO, and Wind patrolling along 'halo orbits' (Wikipedia) around the Sun-Earth Lagrange Point, L1.The CME (orange isosurface) erupts, heading towards the Earth. The density enhancement of the CME is visible in slice of data in the Earth's orbit plane which provides a better sense of when the CME actually reaches the Earth.As the particle density enhancement from the CME strikes the Earth, we see the Earth's magnetosphere respond, with the outer, high density surface (red), 'blown away'. This surface location corresponds roughly to the location of the bow shock. The bow shock has not been eliminated, only some of its particles have been depleted, to be carried off in the CME and solar wind. As the densest material of the CME passes (orange surface), plasma from the CME continues to flow by the Earth, stretching the magnetosphere into a long, thin structure behind the Earth.The magnetosphere slowly recovers from the 'impact', and regions that can confine higher particle densities reform - the red surfaces return. But not for long as the rarefaction behind the CME reaches the Earth. This lower density region provides fewer particles to repopulate the magnetosphere and make it easier for particles confined in the magnetosphere to 'leak' out into the solar wind.For the BATS-R-US model, the isosurface colors are: red=20 AMUs per cubic centimeter, yellow=10.0 AMUs per cubic centimeter, light blue=1.0 AMUs per cubic centimeter, and blue=0.1 AMUs per cubic centimeter. An AMU corresponds to about the mass of a hydrogen atom, the dominant component of the solar wind.This visualization is part of a series of visualizations on space weather modeling. ||
Space Weather Event: Close-up on the Earth Environment
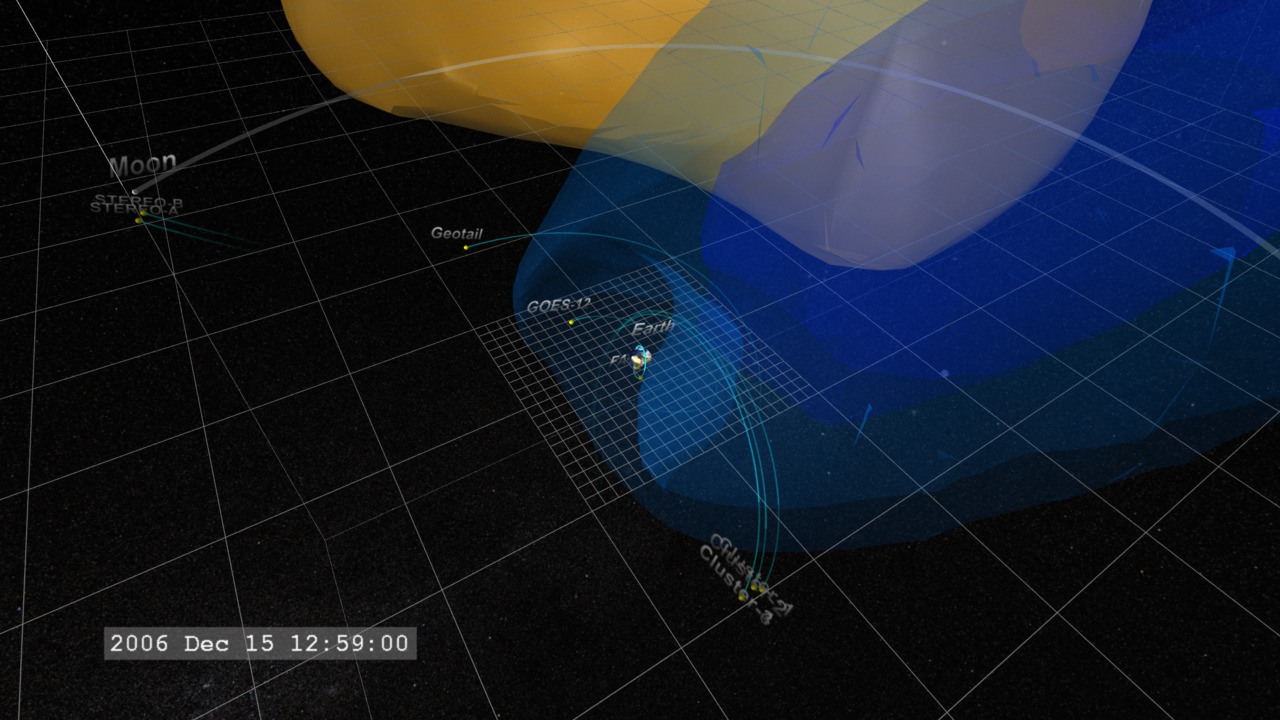
Go to this pageWe open with a view from high above the ecliptic plane, at the space between the Sun (left) and the Earth (within the small rectangular box on the right). In the plane of the Earth's orbit, we show a 'slice' of the Enlil model showing the particle density profile of the solar wind (white to yellow for decreasing particle density). The spiral 'rotating water sprinkler' pattern in the density is the Parker spiral (Wikipedia). We zoom down to the Earth as the CME (orange surface) erupts in the direction of the Earth and move into a position above the Earth's orbital plane with the Earth (geospace) environment in view.As the particle density enhancement from the CME strikes the Earth, we see the Earth's magnetosphere respond, with the outer, high density surface (red) 'blown away'. This surface location corresponds roughly to the location of the bow shock. The bow shock has not been eliminated, only some of its particles have been depleted, to be carried off in the CME and solar wind. As the densest material of the CME passes (orange surface), plasma from the CME continues to flow by the Earth, stretching the magnetosphere into a long, thin structure behind the Earth.The magnetosphere slowly recovers from the 'impact', and regions that can confine higher particle densities reform - the red surfaces return. But not for long as the rarefaction (Wikipedia) behind the CME reaches the Earth. This lower density region provides fewer particles to repopulate the magnetosphere and makes it easier for particles confined in the magnetosphere to 'leak' out into the solar wind.For the BATS-R-US model, the isosurface colors are: red=20 AMUs per cubic centimeter, yellow=10.0 AMUs per cubic centimeter, light blue=1.0 AMUs per cubic centimeter, and blue=0.1 AMUs per cubic centimeter. An AMU corresponds to about the mass of a hydrogen atom, the dominant component of the solar wind.This visualization is part of a series of visualizations on space weather modeling. ||
Space Weather Event: The View from Above
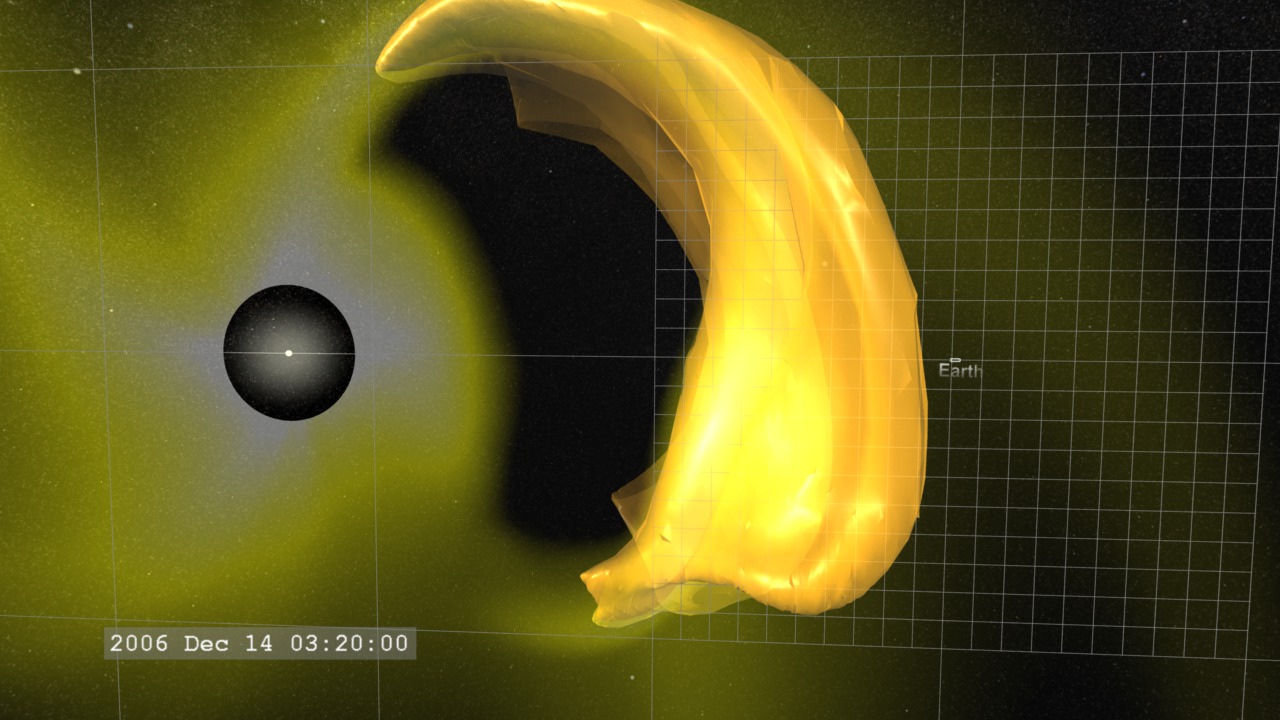
Go to this pageWe open with a view from high above the ecliptic plane, at the space between the Sun (left) and the Earth (within the small rectangular box on the right). In the plane of the Earth's orbit, we show a 'slice' of the Enlil model showing the particle density profile of the solar wind (white to yellow for decreasing particle density). The spiral 'rotating water sprinkler' pattern in the density is the Parker spiral (Wikipedia). The CME (orange surface) erupts in the direction of the Earth. The orange surface represents a boundary of common pressure differences, which better identifies sharp transitions in pressure common in shocks fronts. The CME clears out particles in the region behind it, called a rarefaction (Wikipedia), visible in the particle density.This visualization is part of a series of visualizations on space weather modeling. ||
Space Weather Event: A View from the Orbit Plane
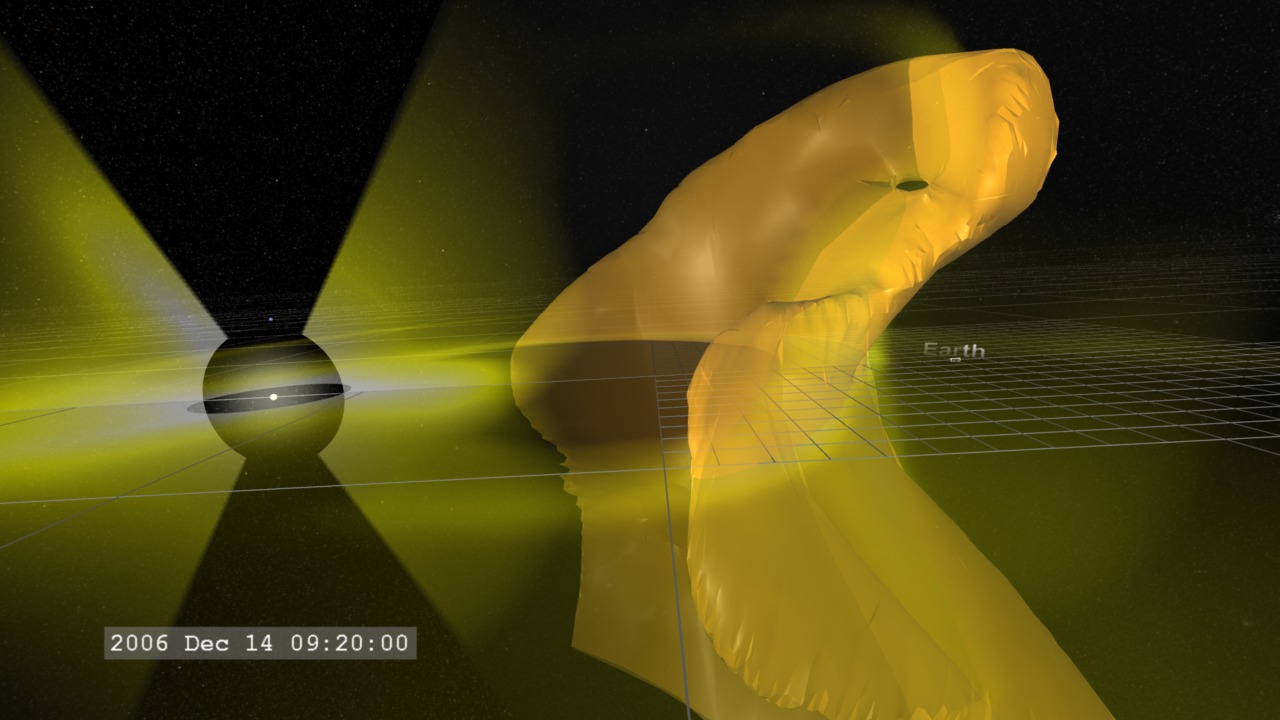
Go to this pageWe start with a view of the space between the Sun (left) and the Earth (within the small rectangular box on the right), slightly above the ecliptic plane. In the plane of the Earth's orbit, we show a 'slice' of the particle density profile of the solar wind (white to yellow for decreasing particle density). Perpendicular to this, we have another 'slice' of particle density from the Enlil model. The Enlil model extends to 60 degrees above and below the solar equator, and beyond 20 solar radii from the Sun. This gap creates the 'hourglass' empty region around the Sun.The CME (orange surface) erupts in the direction of the Earth. The orange surface represents a boundary of common pressure differences, which better identifies sharp transitions in pressure common in shocks fronts. The CME clears out particles in the region behind it, called a rarefaction (Wikipedia), visible in the particle density.This visualization is part of a series of visualizations on space weather modeling. ||
A Coronal Mass Ejection strikes the Earth!
Go to this pageEnergetic events on the Sun have impacts throughout the Solar System. This visualization, developed for the Dynamic Earth dome show, utilizes data from space weather models based on a real coronal mass ejection (CME) event from mid-December 2003. Particles are used to represent the flow of solar material from the Sun around the Earth. It is important to note that the flowing material of the CME are actually ions and electrons far too small to see. This visualization tries to represent the motions of these tiny particles in a form large enough for us to see. We open with a close-up view of the Earth, the particles representing the solar wind streaming around the Earth due to extended influence of the Earth's magnetic field. We pull out from the Earth and move so that we see the Sun in the distance. The enormous density enhancement in the solar wind is the coronal mass ejection. As the CME reaches the Earth, we see how effective the Earth's magnetic field is at diverting the solar material around the Earth. As the CME passes, we move earthward, and reveal the field lines representing the Earth's magnetic field, emanating from the magnetic poles and blown behind the Earth due to the influence of the solar wind. For simplicity, we have represented the Earth's magnetic field as unchanging, but it is actually very dynamic in its response to a CME or other change in the solar wind. ||
Notable CMEs Modeled by the CCMC
The CME Heard 'Round the Solar System
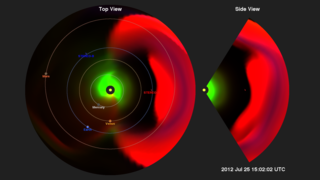
Go to this pageAs the CMEs and SIRs move through the solar system, we include graphs of particle fluxes measured at Earth, Mars, and STEREO-A. || SEPsAtMars.topfixed.UHDframes.clockSlate_HAE.UHD3840.01000_print.jpg (1024x576) [100.6 KB] || SEPsAtMars.topfixed.UHDframes.clockSlate_HAE.UHD3840.01000_thm.png (80x40) [6.5 KB] || SEPsAtMars.topfixed.UHDframes.clockSlate_HAE.UHD3840.01000_searchweb.png (320x180) [87.5 KB] || SEPsAtMars.topfixed_HAE.HD1080i_p30.mp4 (1920x1080) [19.4 MB] || 1920x1080_16x9_30p (1920x1080) [0 Item(s)] || SEPsAtMars.topfixed_HAE.HD1080i_p30.webm (1920x1080) [3.0 MB] || SEPsAtMars.topfixed_HAE_2160p30.mp4 (3840x2160) [61.6 MB] || 3840x2160_16x9_30p (3840x2160) [0 Item(s)] ||
Notable CMEs of Solar Cycle 24
Go to this pageSimulations & visualizations of some of the big solar events of Solar Cycle 24. These visualizations were developed to present a more public-friendly
view in a way that the major events of space weather, such as coronal
mass ejections (CMEs) are more obvious even to the untrained observer.
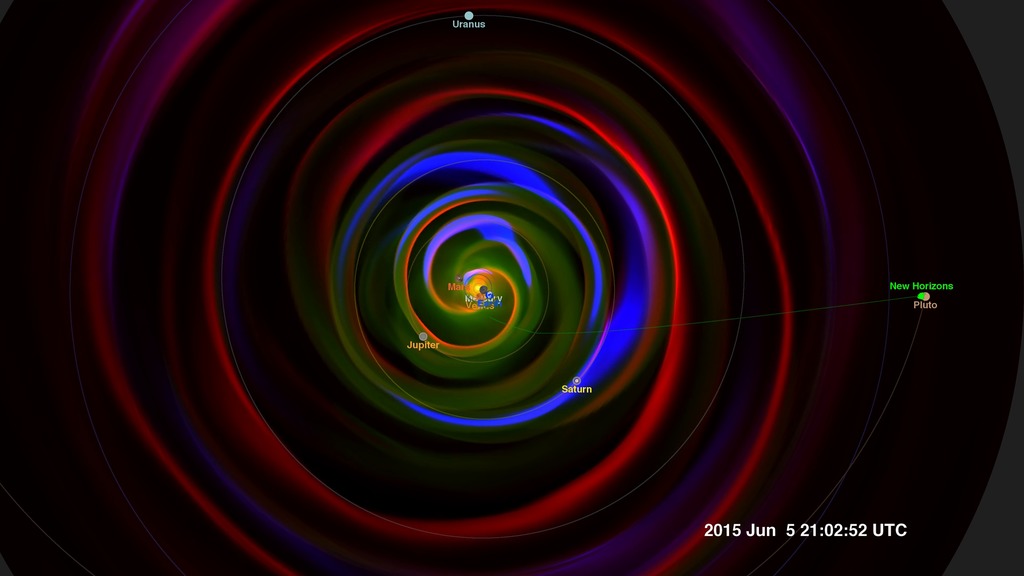
We use a fairly basic technique or 'trick' of using the three image
color channels, red, green, and blue, to present different variables
computed in the model run. The visual color-bars are also on the
animation page. In this case, red represents temperature (kind of obvious choice) so
redder is hotter plasma. Green represents density of the plasma. Blue
is a pressure gradient, or change in pressure over distance. More blue
means a stronger shock wave moving through the plasma, which is more a
characteristic of a CME. By combining the three color channels, intense
values of these variables can show up as distinct colors. For example,
a hot, dense shock combines red, green, and blue to form white. But you
could also have a lower density hot shock combining red and blue to make
magenta (or purple/violet). The major visible feature is the 'Parker spiral'. As the solar wind
flows out from the sun, the sun is rotating. Density enhancements
(green in the visualization) in the wind get propagated outward to make
this spiral shape - not too different from the spiral pattern created by
a spinning lawn sprinkler. Coronal mass ejections get imprinted on this
pattern.Space Weather to the Edge of the Solar System
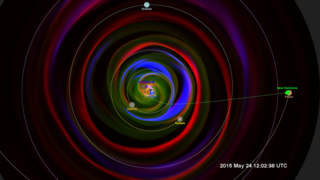
Go to this pageCropped view of the Enlil model from early 2015 to just after the New Horizons flyby of Pluto. || NewHorizons2015_40AU.NoSTEREO_1080p30.01000_print.jpg (1024x576) [72.7 KB] || NewHorizons2015_40AU.NoSTEREO_1080p30.mp4 (1920x1080) [27.9 MB] || NewHorizons2015_40AU.NoSTEREO_1080p30.webm (1920x1080) [6.6 MB] || NewHorizons2015_40AU.NoSTEREO.3840x2160_p30.mp4 (3840x2160) [82.5 MB] || 5760x3240_16x9_30p (5760x3240) [0 Item(s)] || NoSTEREO (3840x2160) [0 Item(s)] || space-weather-to-the-edge-of-the-solar-system-hd1080-movie.hwshow [336 bytes] ||
