THEMIS
Overview
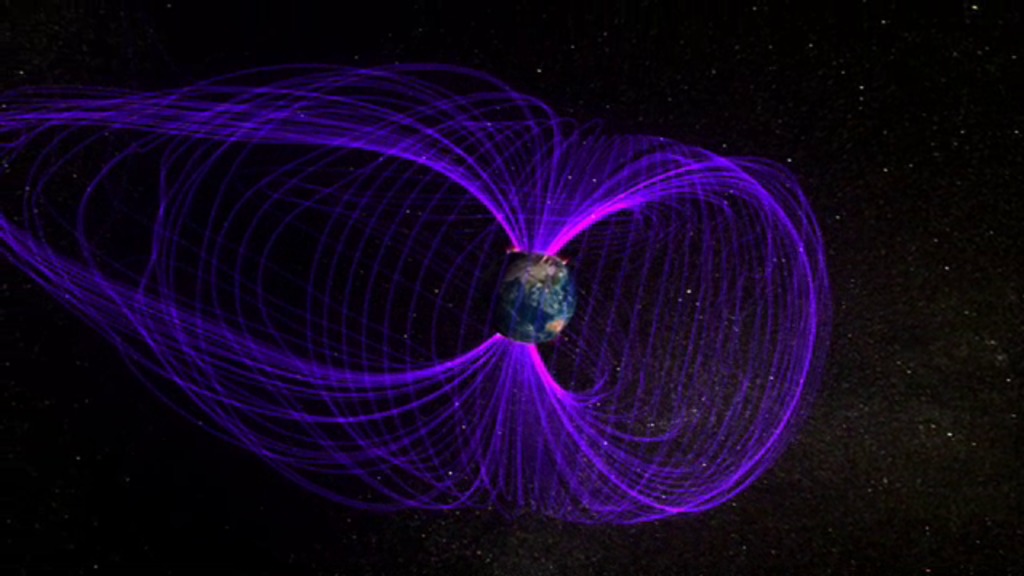
THEMIS (Time History of Events and Macroscale Interactions during Substorms) was launched in 2007 as five identical satellites for measuring the magnetic and plasma environment around Earth. After completing their prime mission, two THEMIS satellites were maneuvered into orbit around the Moon to study the lunar enviroment in a mission known as THEMIS-ARTEMIS.
THEMIS Science
Visualizations & animations related to THEMIS science results.
- Produced Video
- Produced Video
- Produced Video
- Visualization
- Visualization
- Produced Video
- Visualization
- Produced Video
- Animation
- Visualization
- Visualization
THEMIS-ARTEMIS
THEMIS-ARTEMIS visualizations
ARTEMIS Mission
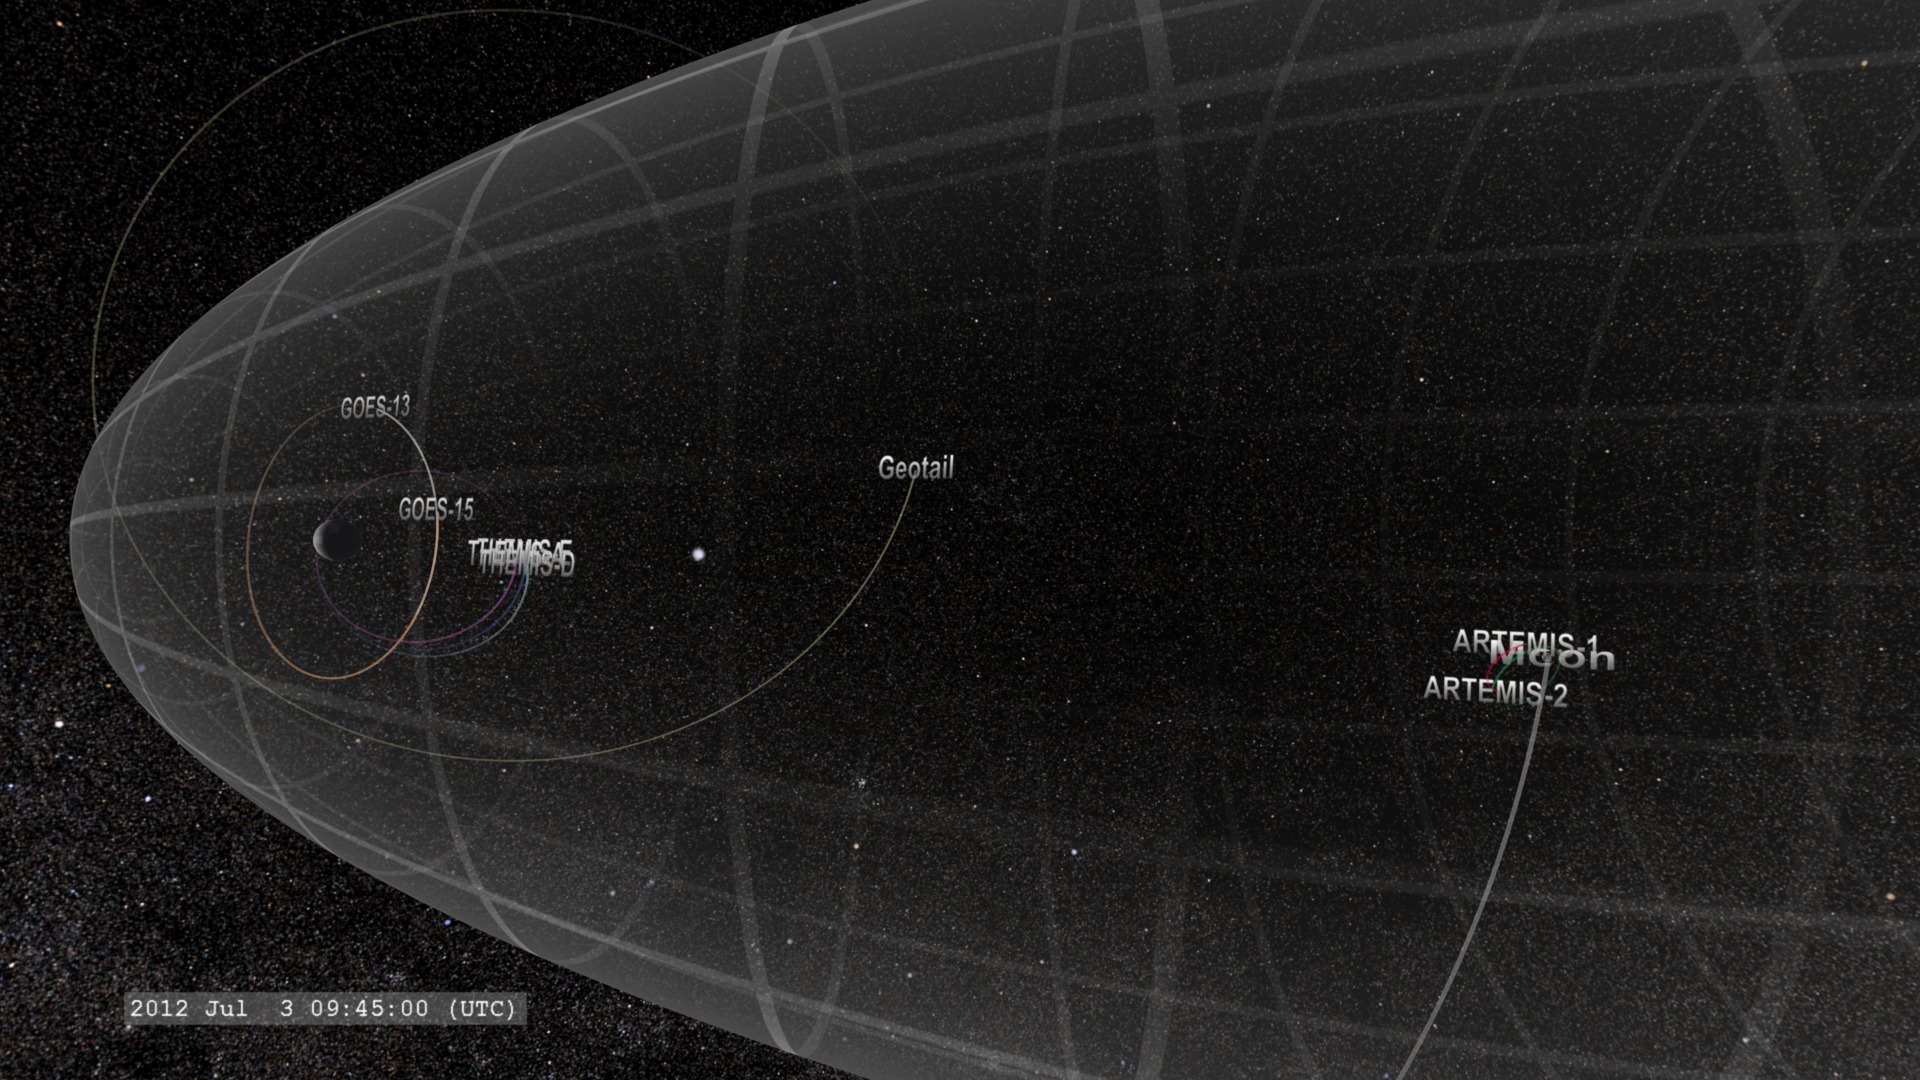
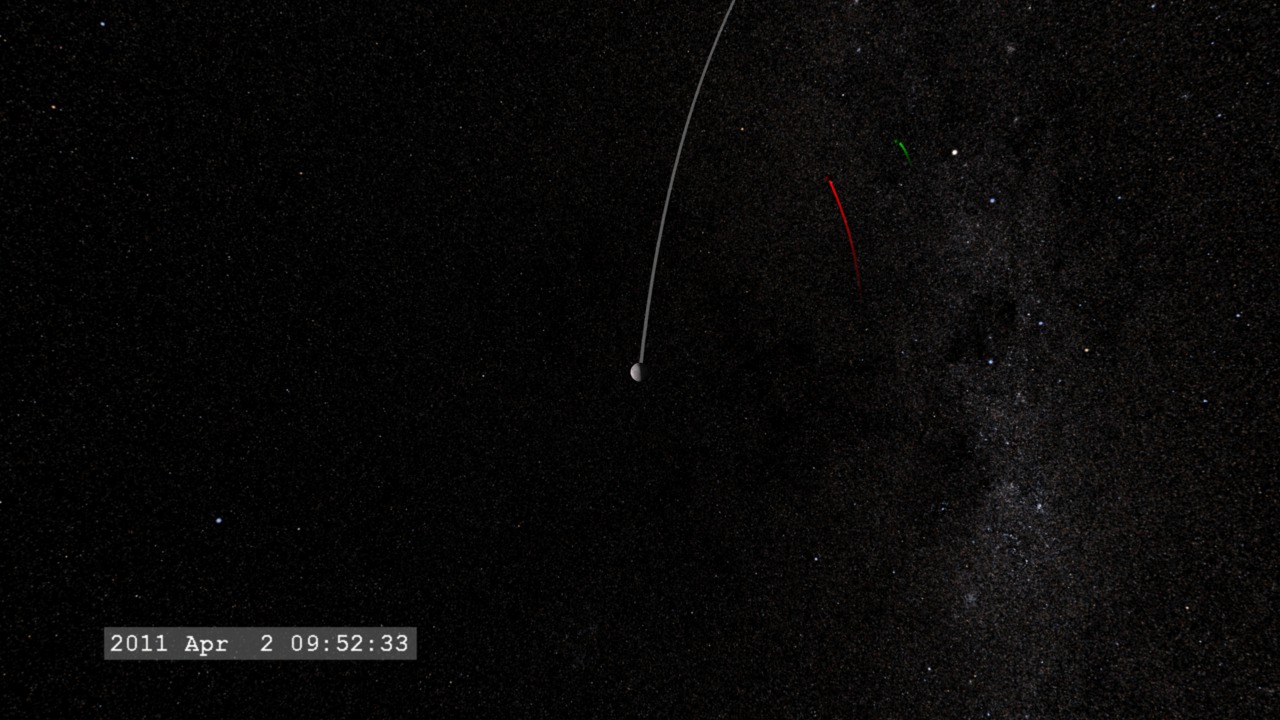
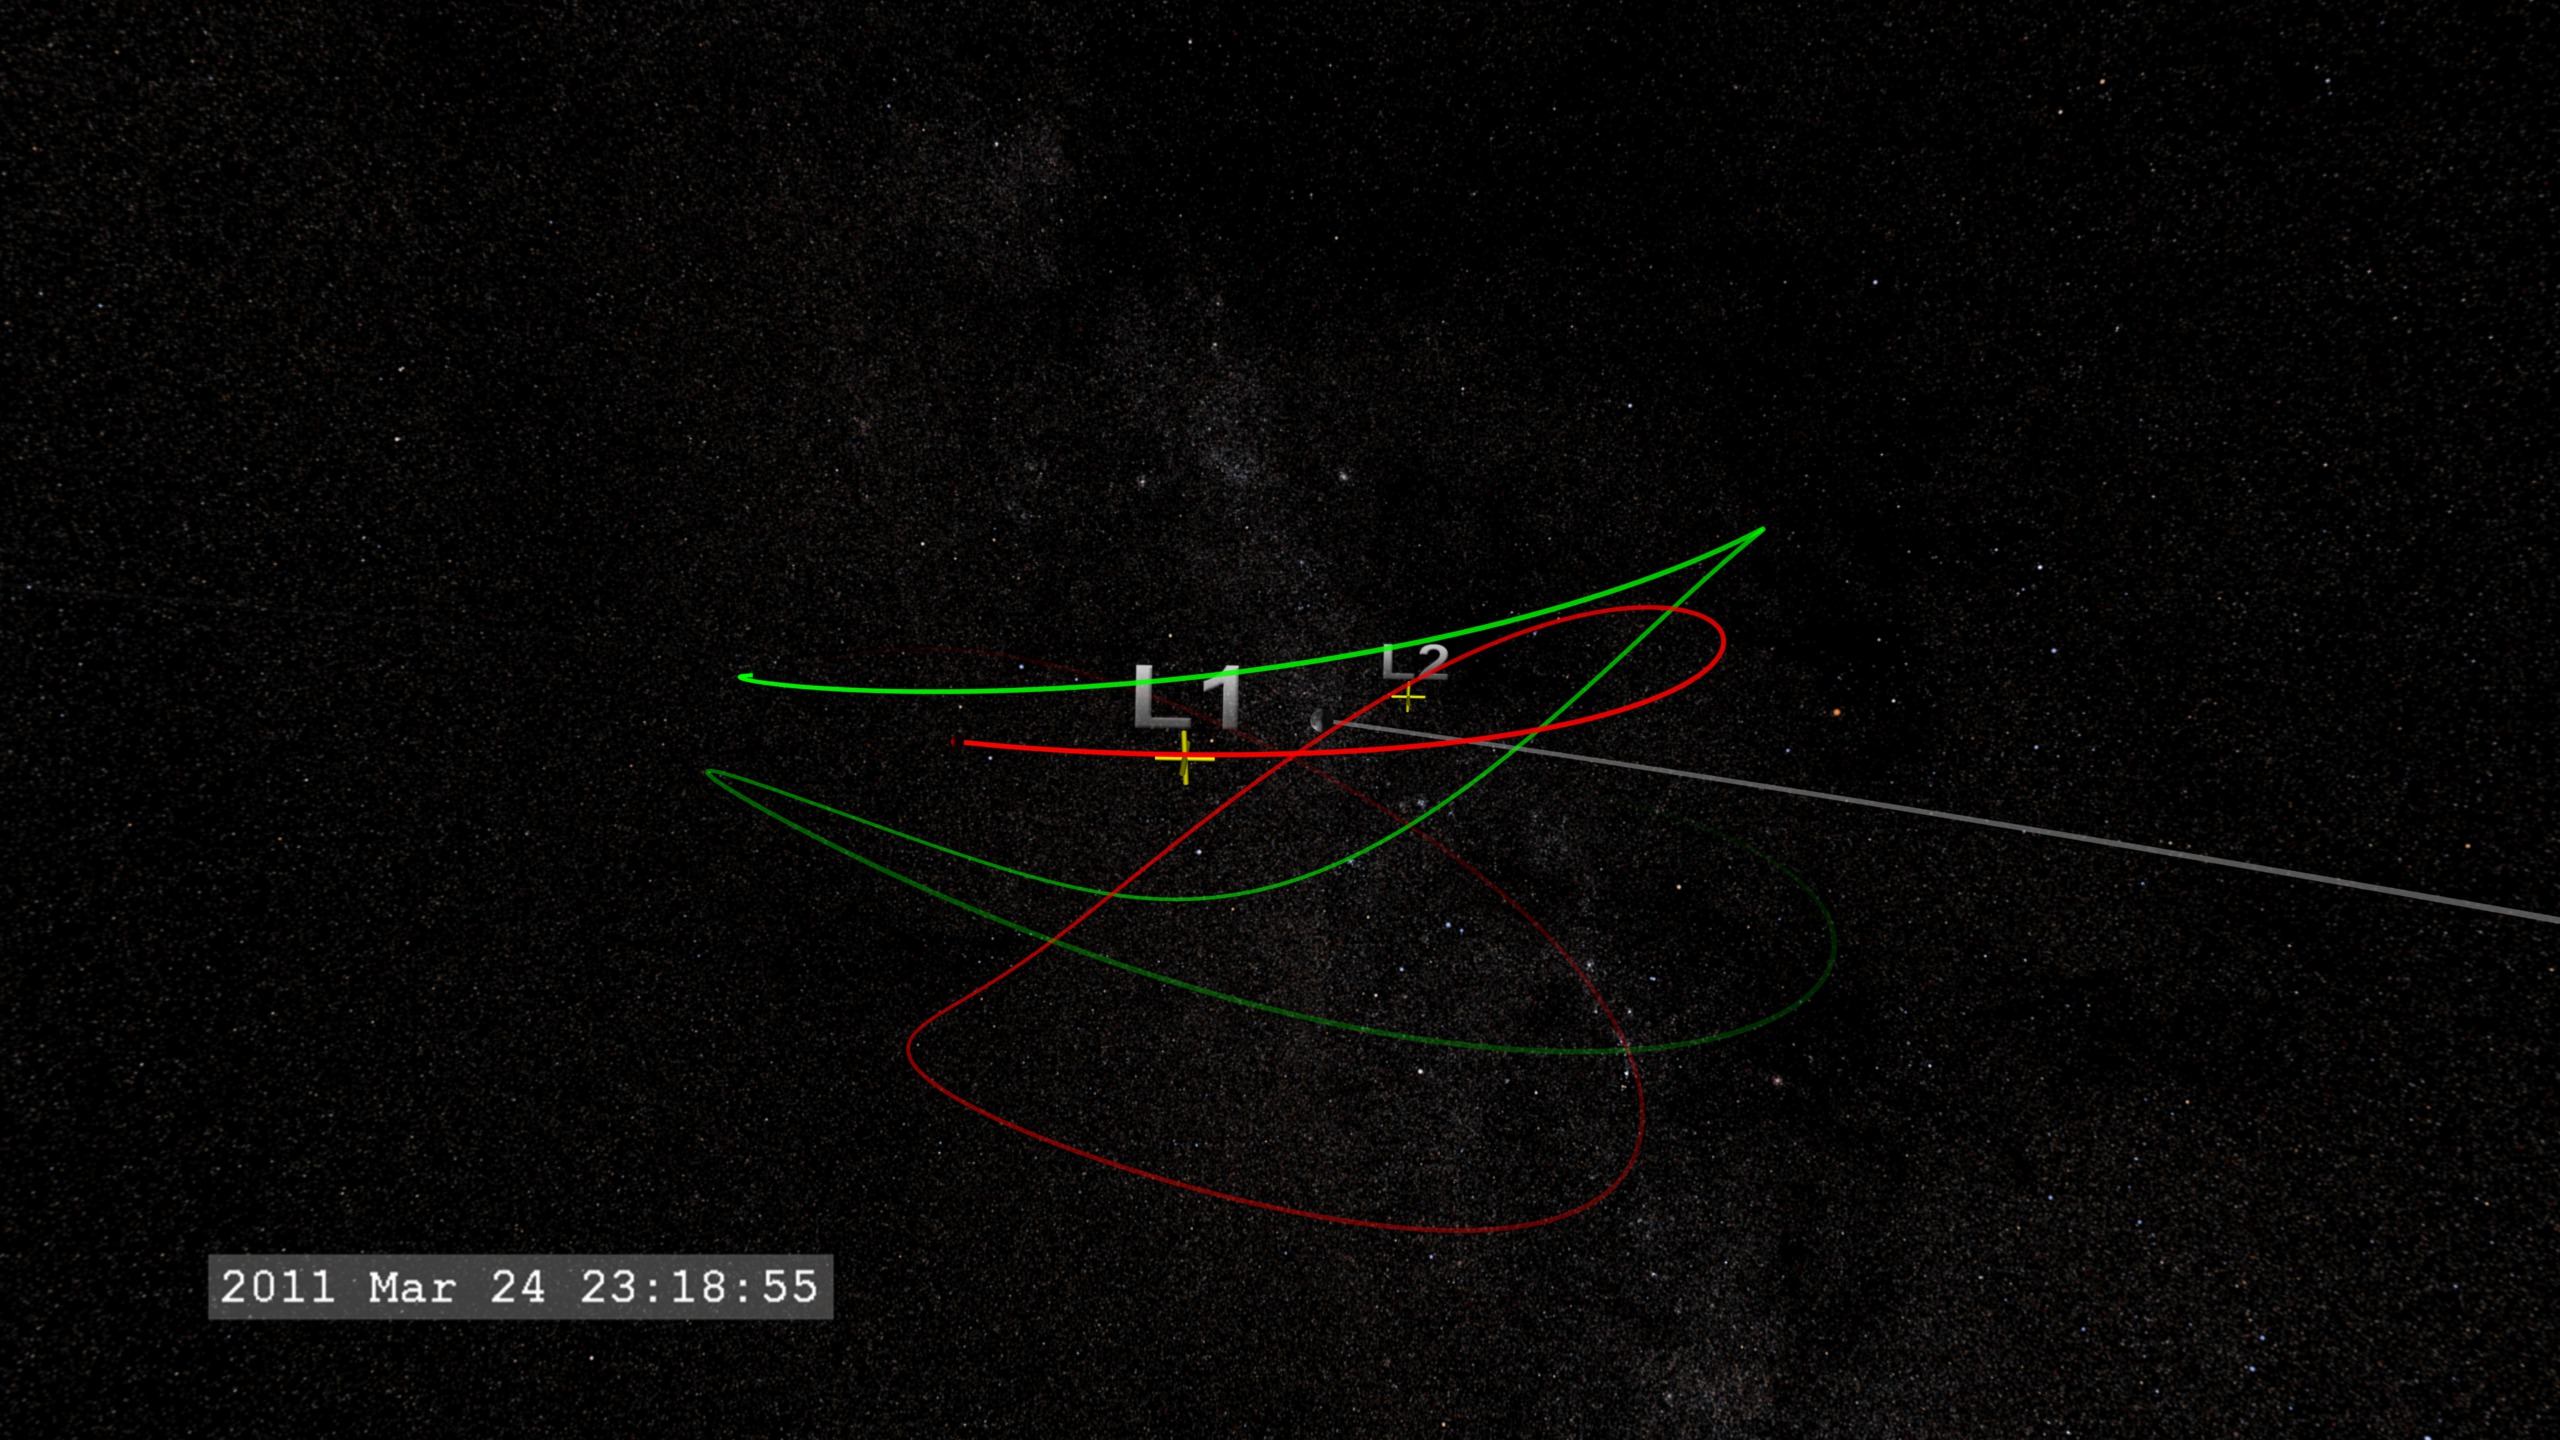
Go to this pageAn extension to the THEMIS mission is to send two of the THEMIS satellites into lunar orbit to study the magnetospheric environment near the Moon. The new mission is named ARTEMIS (Acceleration, Reconnection Turbulence, and Electrodynamics of Moon's Interaction with the Sun).The outermost two THEMIS spacecraft (Probes B and C) are on route to the Moon, where they will become the ARTEMIS mission's Probes 1 and 2 (red and green, respectively) , tasked with studying not only the tenuous cavity carved out by the Moon in the supersonic solar wind, but also reconnection, particle energization and turbulence in both the solar wind and the Earth's distant magnetotail at lunar distance. ARTEMIS stands for Acceleration, Reconnection, Turbulence, and Electrodynamics of the Moon's Interaction with the Sun.Thanks to careful planning, sufficient fuel remained on both spacecraft at the successful completion of their primary mission to raise their apogees to lunar distance, where they could receive the multiple gravitational assists needed to fling the spacecraft first beyond the Moon and then assist them in entering in orbits that parallel that of the Moon at the L1 and L2 Lagrange points. Maneuvers in April 2011 enable the spacecraft to enter into prograde and retrograde lunar orbits (the 'braided' motion).The direction of the Sun is indicated by the yellow arrow. ||
ARTEMIS at Lagrange
Go to this pageThis visualization is built from the components of ARTEMIS Mission with emphasis on the maneuvers of the two ARTEMIS spacecraft (red=ARTEMIS-1, green=ARTEMIS-2) around the lunar Lagrange Points L1 and L2.As with the ARTEMIS Mission visual, we show the Earth, the Earth's magnetosphere, the Moon and Sun, with the direction of the Sun from the Earth indicated by the yellow arrow.In this version, the satellite trails are are constructed in a lunar-centric inertial coordinate system so the trails reveal the motion of the satellites relative to the Lagrange points in INERTIAL space (fixed with the distant stars). To see another example of how coordinate systems dramatically affect the construction of trails, see LRO in Earth Centered and Moon Centered Coordinates.In this movie, the camera starts above the Moon's orbital plane and then slowly moves towards the Moon's orbital plane to get a better sense of the motion in 3-D space. For a different perspective, see ARTEMIS at Lagrange: The View from Above. ||
ARTEMIS Orbits Magnetic Moon
Go to this pageLaunched in 2007, NASA's five THEMIS spacecraft have now successfully completed their 2 year mission to determine the cause of geomagnetic substorms. Because they are continuing to work perfectly, NASA is re-directing the outermost two spacecraft to special orbits at and around the Moon. This new mission, which is called ARTEMIS, uses some very complex maneuvers over two years (2009-2010) to get both spacecraft into position. As the Moon orbits the Earth, it passes in and out of the Earth's magnetic field and the million-mile per hour stream of particles emitted by the Sun known as the solar wind. While in these regions, the two ARTEMIS spacecraft will seek evidence for turbulence, particle acceleration, and magnetic reconnection, three fundamental phenomena that control the nature of the solar wind's interaction with the Earth's magnetosphere. Employing their full complement of instruments and unique two-point vantage points, the spacecraft will study the vacuum the Moon carves out in the solar wind, and the processes that eventually fill this lunar wake. Nearer the Moon, they will observe the effects of surface electric fields, ions sputtered off the lunar surface, and determine the internal structure of the Moon from transient variations in its magnetic field induced by external changes.Also available are the complete, unedited visualization and frames. ||
Magnetic Bubbles on the Moon...
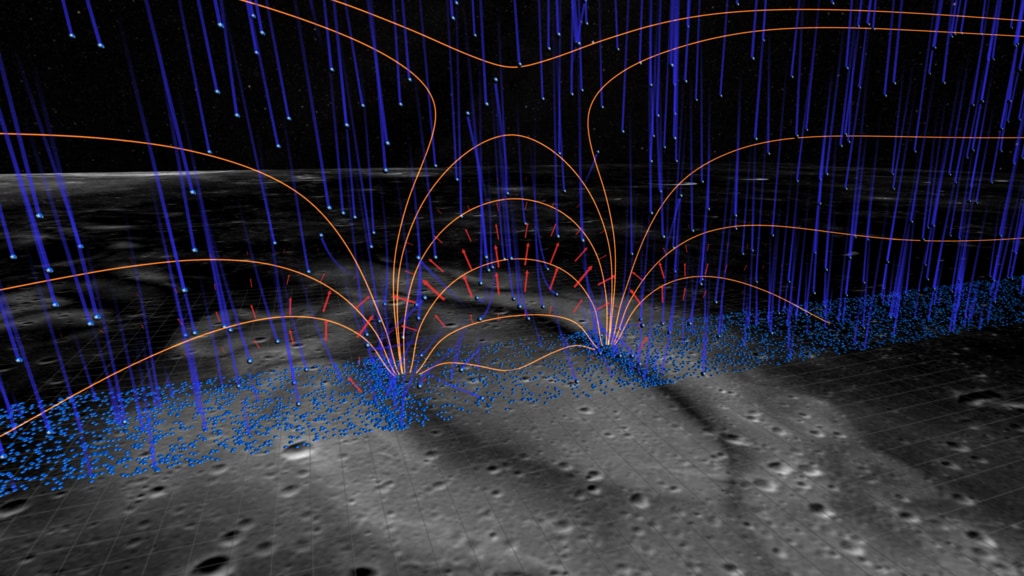
Go to this pageView of 'deluxe' model with camera in fixed position. Fades from schematic view showing underground dipole field sources (blue and yellow arrows), induced electric field (red arrows) and magnetic field (gold curves) to a view with Reiner Gamma region of moon. Solar protons (blue) rain down on lunar surface with enhanced accumulation near dipoles. || SolarWindRain.dipole.Efield_fixed_inertial.HD1080i.1000_print.jpg (1024x576) [163.4 KB] || SolarWindRain.dipole.Efield_fixed_inertial.HD1080i.1000_searchweb.png (320x180) [101.6 KB] || SolarWindRain.dipole.Efield_fixed_inertial.HD1080i.1000_thm.png (80x40) [6.9 KB] || VizEDFixedCamera (1920x1080) [0 Item(s)] || SolarWindRain.dipole.Efield_fixed.HD1080i_p30.webm (1920x1080) [7.5 MB] || SolarWindRain.dipole.Efield_fixed.HD1080i_p30.mp4 (1920x1080) [97.0 MB] || VizEDFixedCamera (3840x2160) [0 Item(s)] || SolarWindRain.dipole.Efield_fixed_2160p30.mp4 (3840x2160) [270.4 MB] || SolarWindRain.dipole.Efield_fixed.HD1080i_p30.mp4.hwshow [211 bytes] ||
Magnetic Bubbles on the Moon Reveal Evidence of "Sunburn"
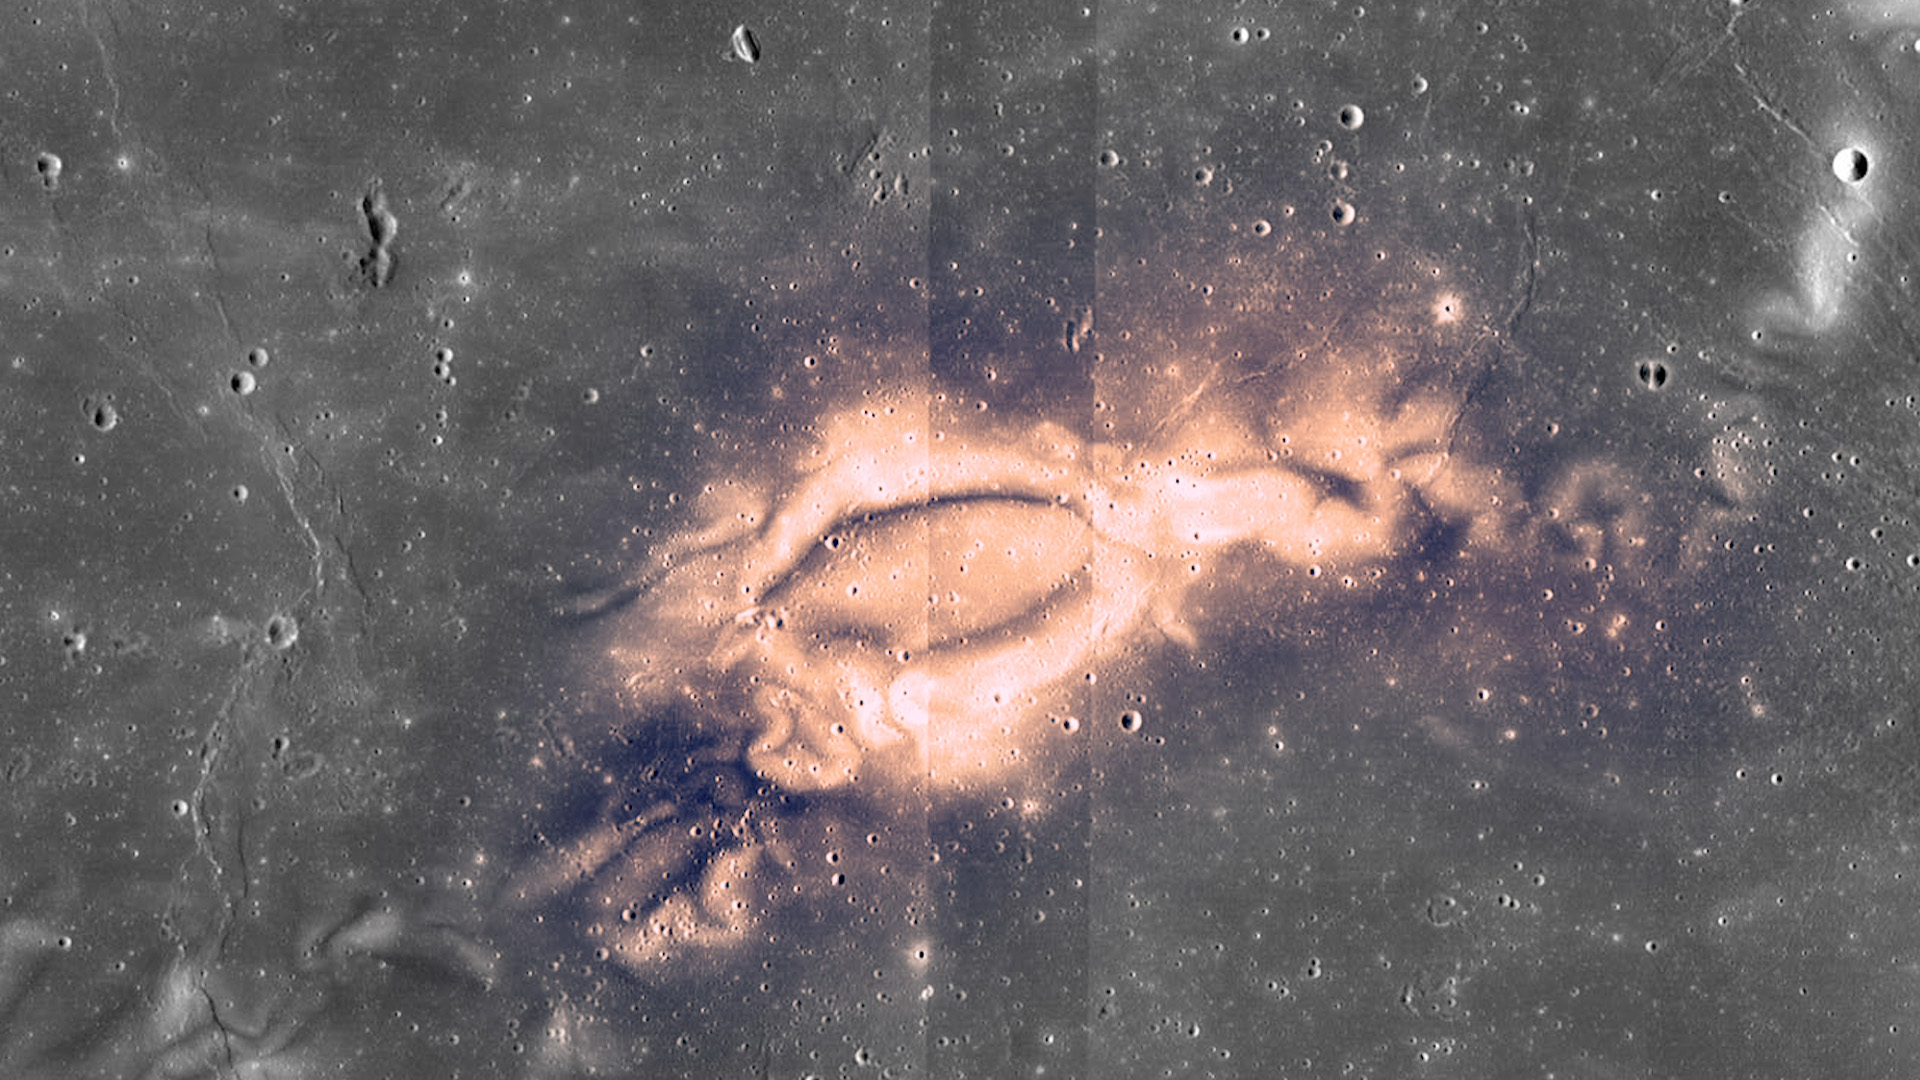
Go to this pageResearch using data from NASA's ARTEMIS mission suggests that lunar swirls, like the Reiner Gamma lunar swirl imaged here by NASA's Lunar Reconnaissance Orbiter, could be the result of solar wind interactions with the Moon's isolated pockets of magnetic field. Watch this video on the NASA Goddard YouTube channel.Complete transcript available.Music credit: Genetic Spices by Jean Christophe Lemay || swirls.jpg (1920x1080) [514.5 KB] || swirls_searchweb.png (320x180) [90.4 KB] || swirls_thm.png (80x40) [6.3 KB] || 12589_MoonBubbles_GSFC.ENDTAG.mp4 (1920x1080) [140.8 MB] || 12589_MoonBubbles_GSFC.ENDTAG.mov (1920x1080) [1.9 GB] || 12589_MoonBubbles_GSFC.ENDTAG_FB.mp4 (1920x1080) [166.4 MB] || 12589_MoonBubbles_GSFC.ENDTAG_YouTube.mp4 (1920x1080) [222.2 MB] || 12589_MoonBubbles_GSFC.ENDTAG.webm (1920x1080) [15.0 MB] || 12589_MoonBubbles_GSFC.en_US.srt [2.8 KB] || 12589_MoonBubbles_GSFC.en_US.vtt [2.8 KB] ||
THEMIS Resources
Pre-launch and miscellaneous THEMIS resources.
Substorms
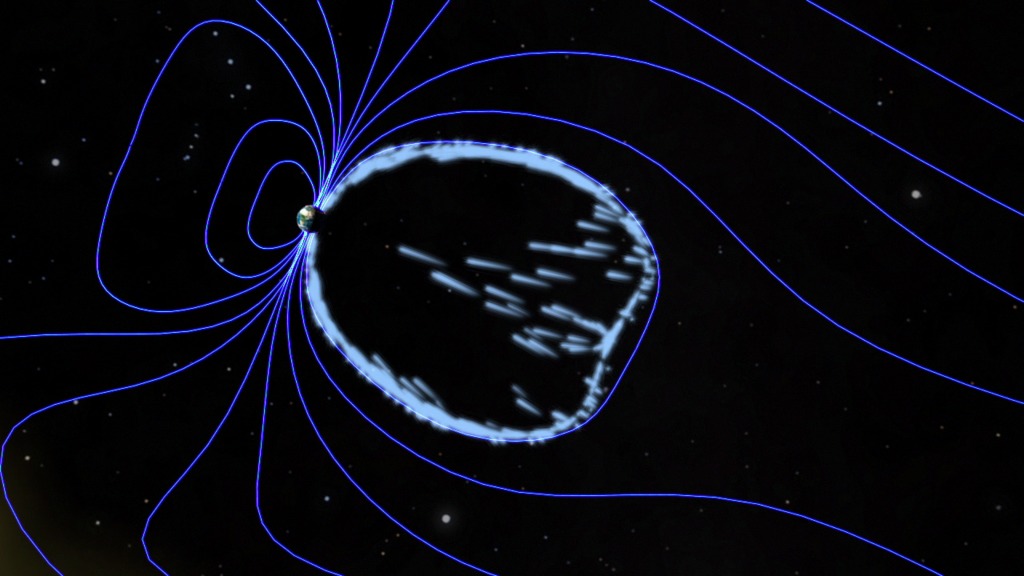
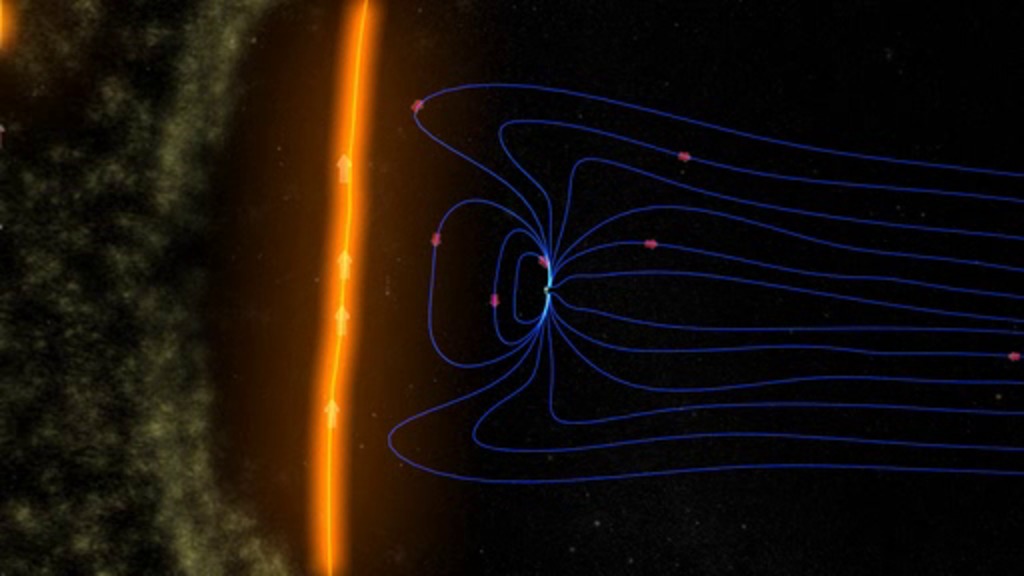
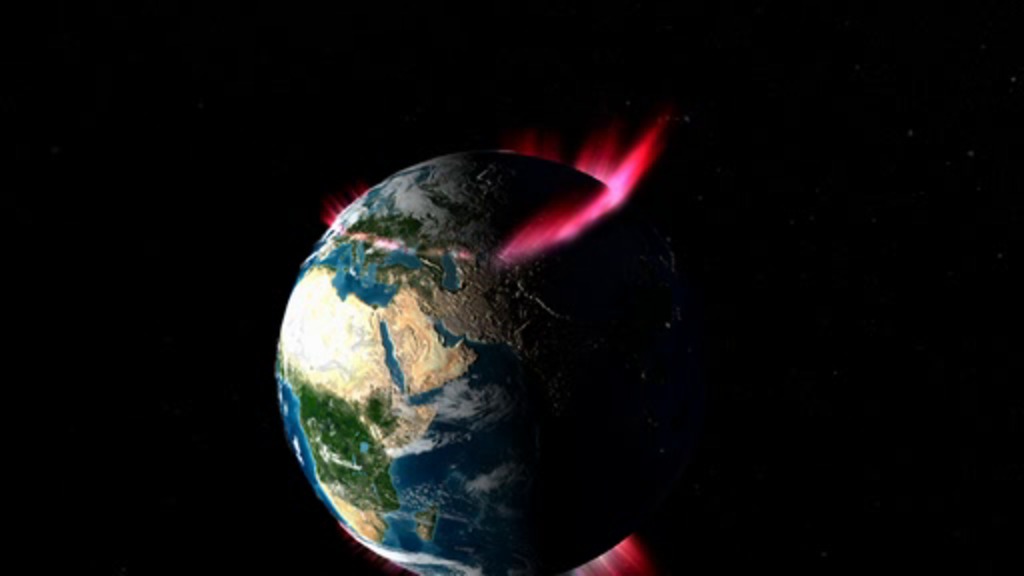
Go to this pageThis animation shows a magnetospheric substorm, during which the reconnection causes energy to be rapidly released along the field lines causing the auroras to brighten. ||
THEMIS ASI Ground Station Array
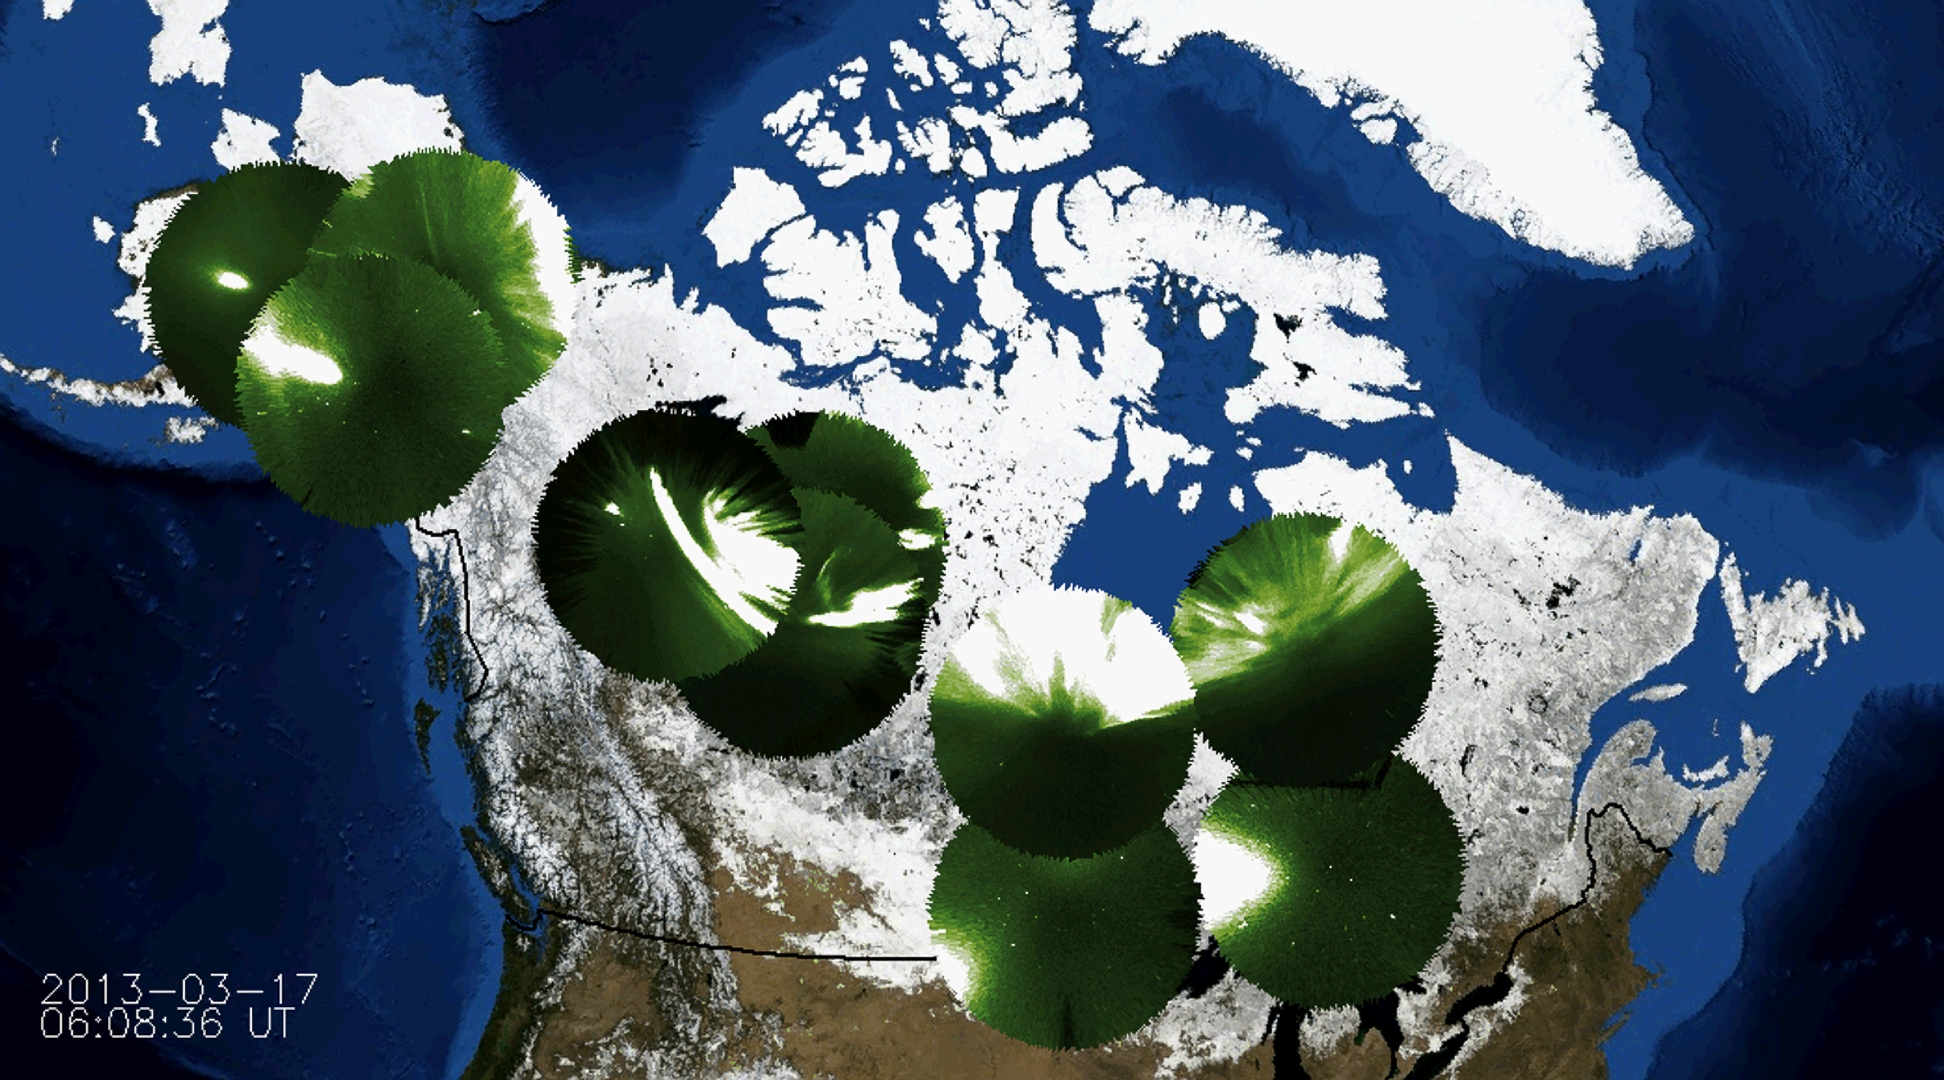
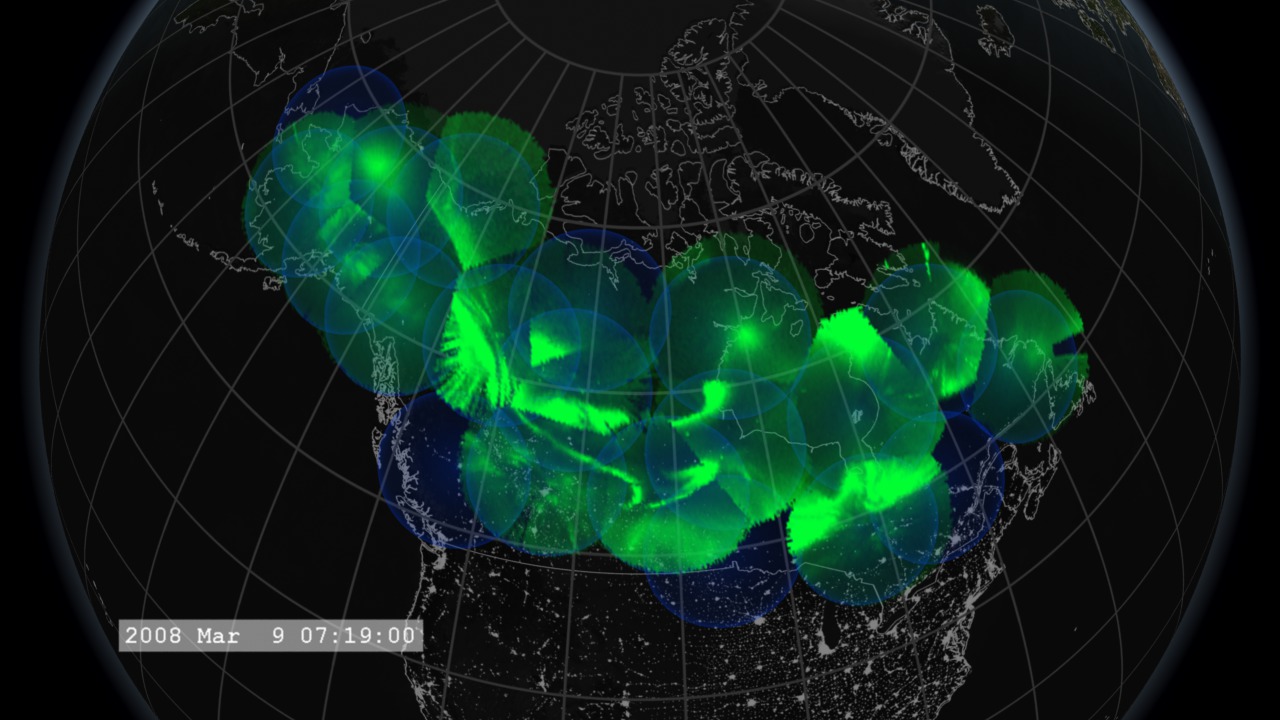
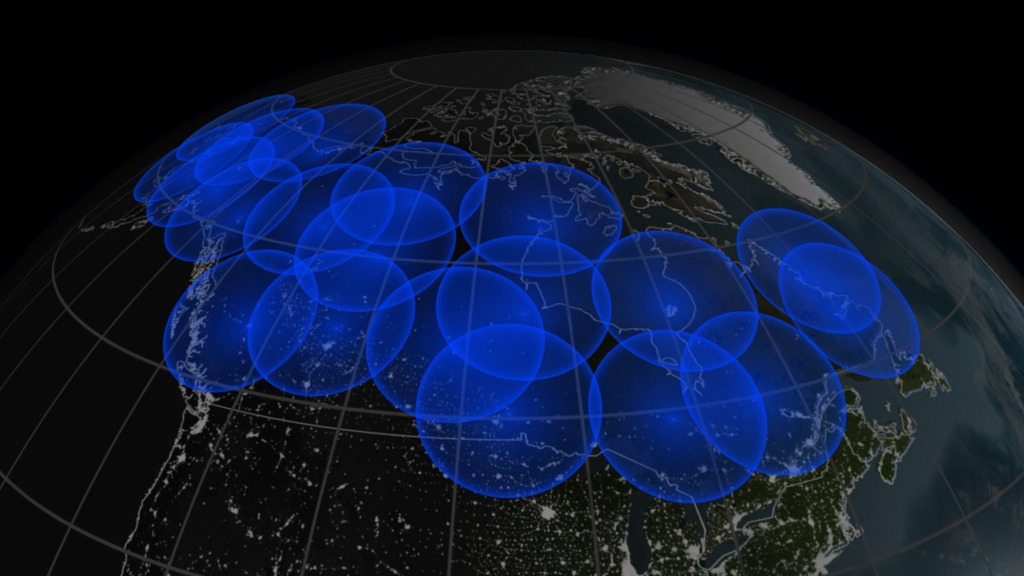
Go to this pageThis visualization shows the 20 THEMIS ASI ground station locations. These ground stations will assist the THEMIS satellite constellation in measuring the Aurora Borealis over North America. Each ground station has an all-sky imaging white-light auroral camera and a magnetometer. The ground stations' radial coverage is rendered at 540 km. An artist's conception of an aurora is added to the second part of the visualization for context. ||
THEMIS Launch and Deployment
Go to this pageTHEMIS (Time History of Events and Microscale Interactions durind Substorms) answers fundamental outstanding questions regarding the magnetospheric substorm instability, a dominant mechanism of transport and explosive release of solar wind energy within Geospace. THEMIS will elucidate which magnetotail process is responsible for substorm onset at the region where substorm auroras map (~10Re): (i) a local disruption of the plasma sheet current or (ii) that current's interaction with the rapid influx of plasma emanating from lobe flux annihilation at ~25Re. Correlative observations from long-baseline (2-25 Re) probe conjunctions, will delineate the causal relationship and macroscale interaction between the substorm components. THEMIS's five identical probes measure particles and fields on orbits which optimize tail-aligned conjunctions over North America. ||
THEMIS Orbits: Transitions
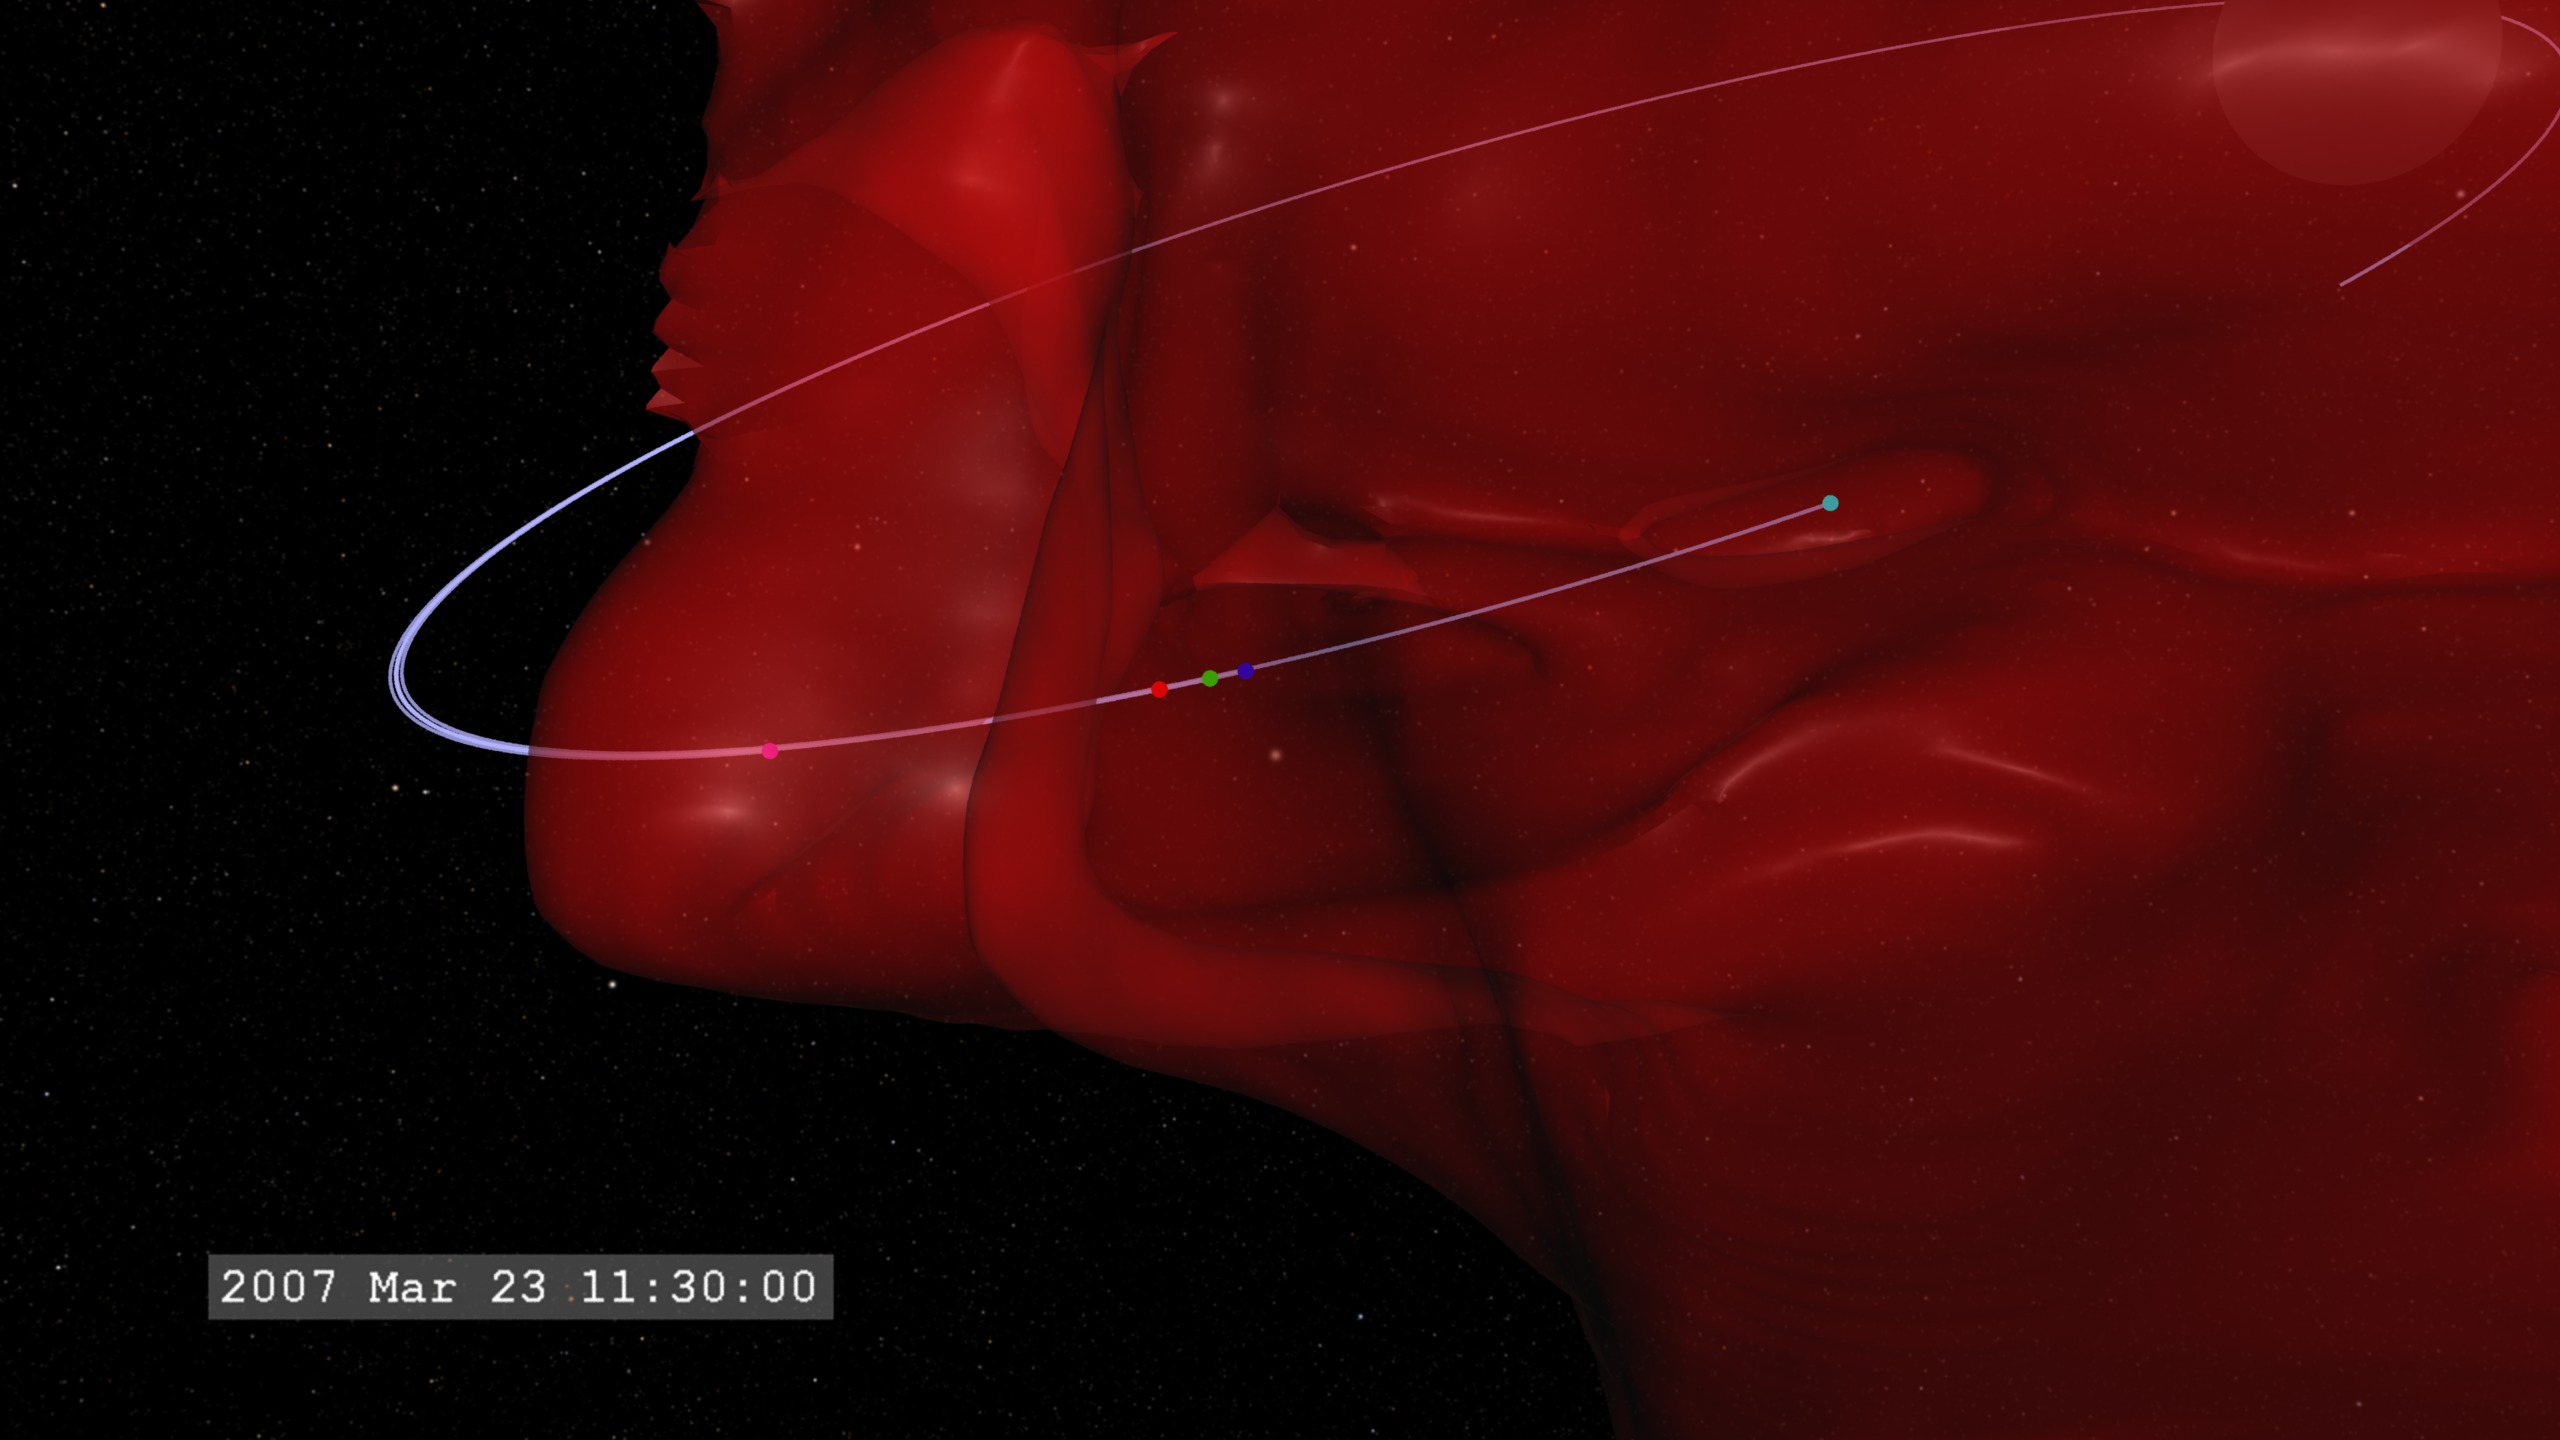
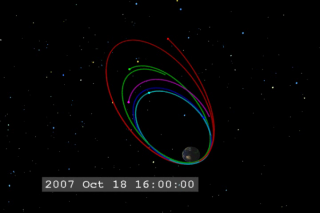
Go to this pageBetween the dayside and nightside phases of the mission, the five spacecraft will conduct orbit change maneuvers over a period of three months. During this visualization, the camera position is locked in GSE coordinates, keeping the Sun to the left. The orbital axis is actually fixed in space but appears to move due to the Earth's motion around the Sun. The dates in this visualization are based on an ephemeris assuming a launch on January 20, 2007. The satellites are represented by the colors: red=P1, green=P2, cyan=P3, blue=P4, magenta=P5. ||
THEMIS Orbits: Nightside Science Configuration
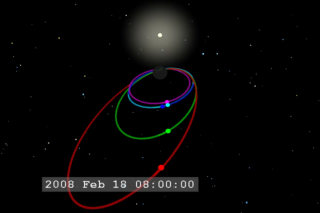
Go to this pageIn the latter phase of the mission, the five THEMIS spacecraft will travel on five co-aligned elliptical orbits with their apogee on the nightside of the Earth. From there, they will sample the particle and electromagnetic wave environment along the magnetotail. The dates in this visualization are based on an ephemeris assuming a launch date of January 20, 2007. The five satellites are represented by colors: red=P1, green=P2, cyan=P3, blue=P4, magenta=P5 ||
THEMIS Orbits: Dayside Science Configuration
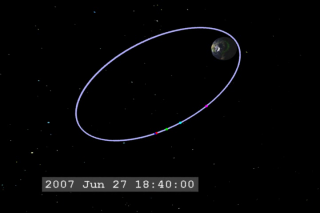
Go to this pageIn the early part of the mission, the five THEMIS satellites will follow the same orbit single-file. The apogee of the orbit will take the spacecraft just beyond the bow shock of the Earth's magnetosphere. This will enable the satellites to collect data in this region over a short range of time so that the time history can be studied. The dates in this visualization are based on an ephemeris assuming a launch on January 20, 2007. The satellite colors are: red=P1, green=P2, cyan=P3, blue=P4, magenta=P5. ||
THEMIS Beauty Pass
Go to this pageA closer look at one of the THEMIS spacecraft. || themis.000100077_print.jpg (1023x682) [86.1 KB] || themis.0001_web.png (320x216) [104.5 KB] || a010094_seq.webmhd.webm (960x540) [4.0 MB] || 720x486_4x3_29.97p (720x486) [64.0 KB] || themis_640x480.mov (640x480) [35.5 MB] || a010094_seq.mpg (720x480) [19.9 MB] || a010094_H264_640x480.mp4 (640x480) [11.5 MB] || themis_320x240.mov (360x240) [12.2 MB] ||
THEMIS Mission and Substorm Simulation
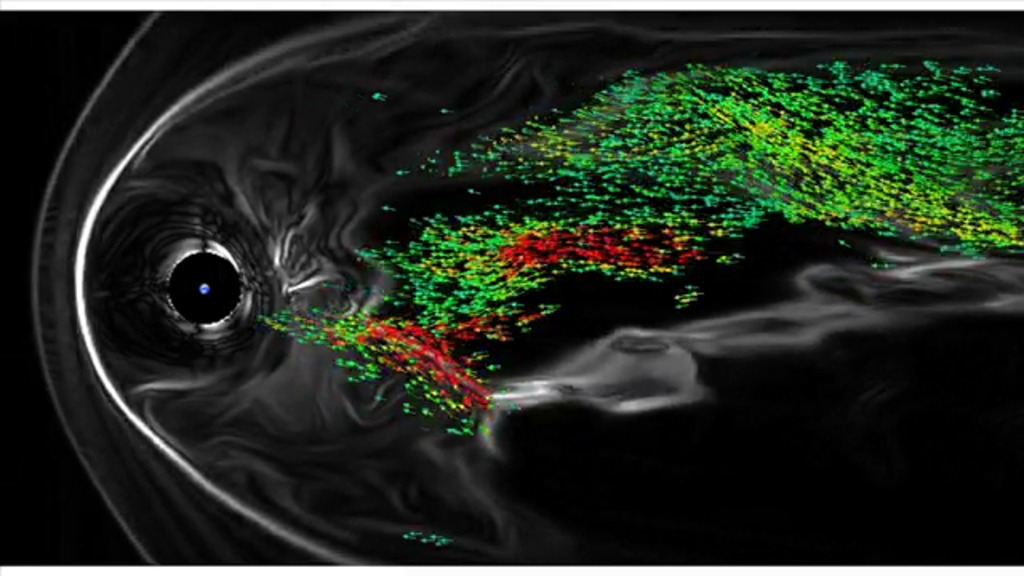
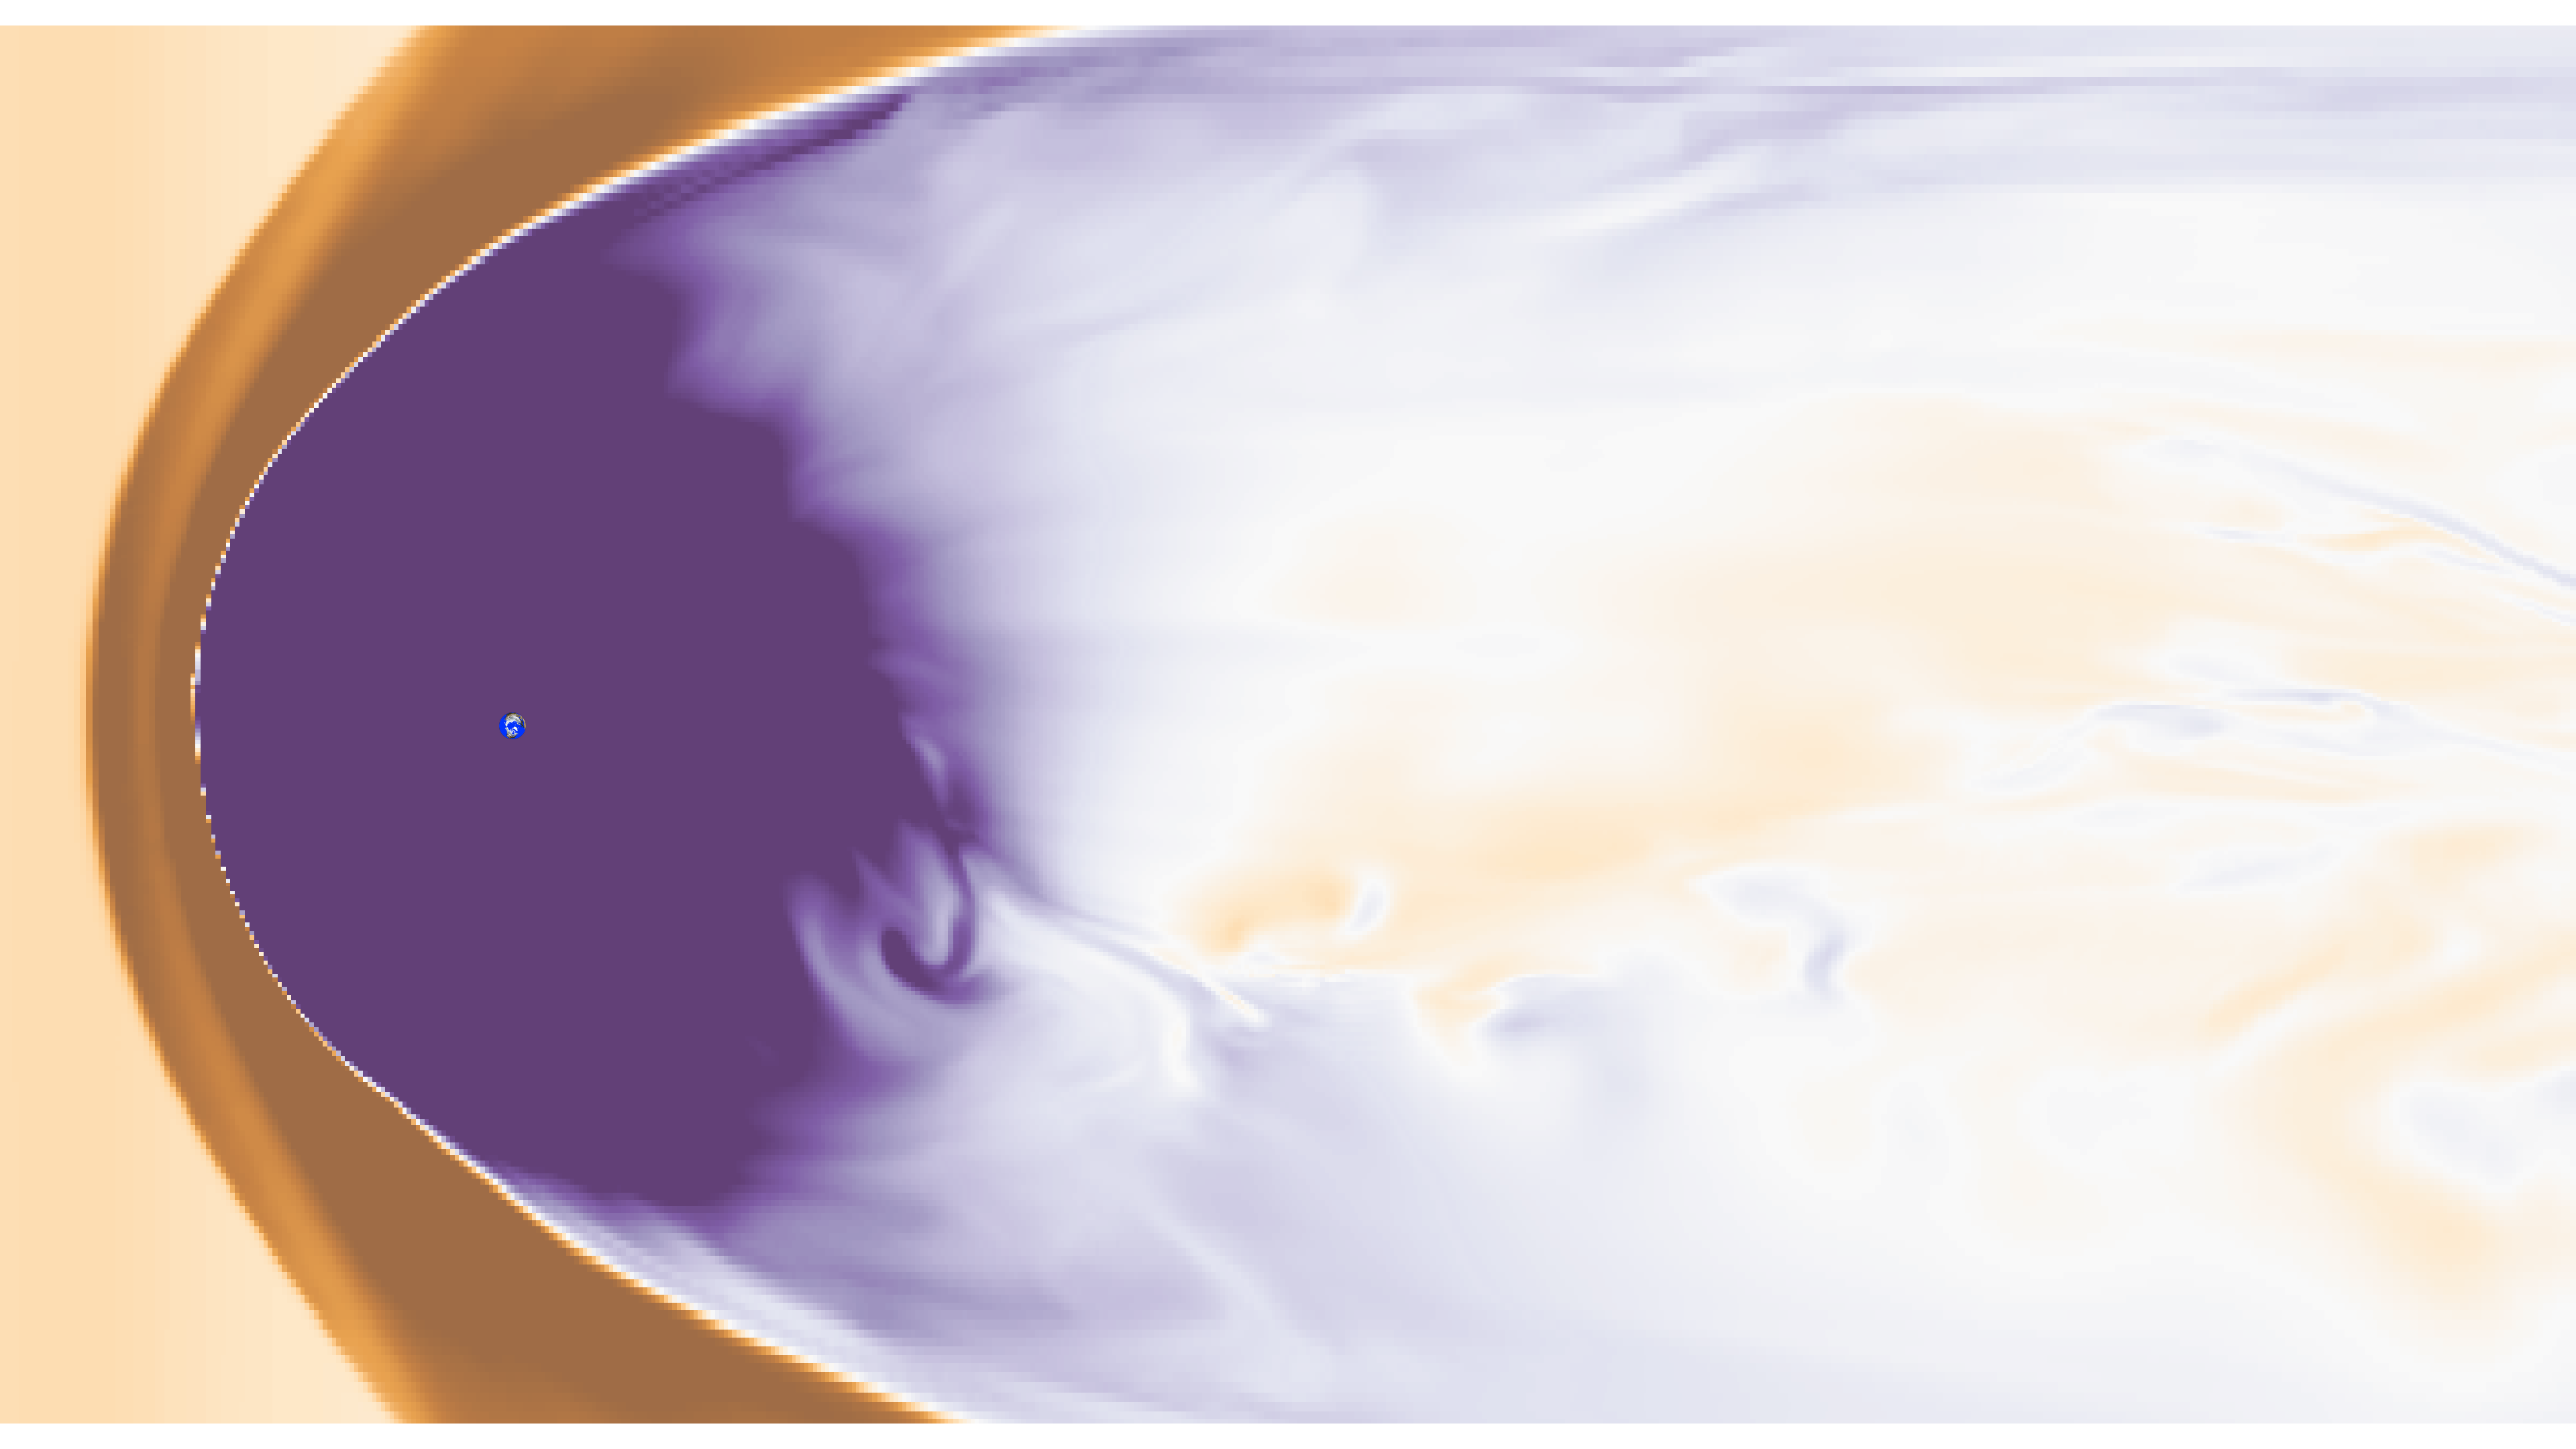
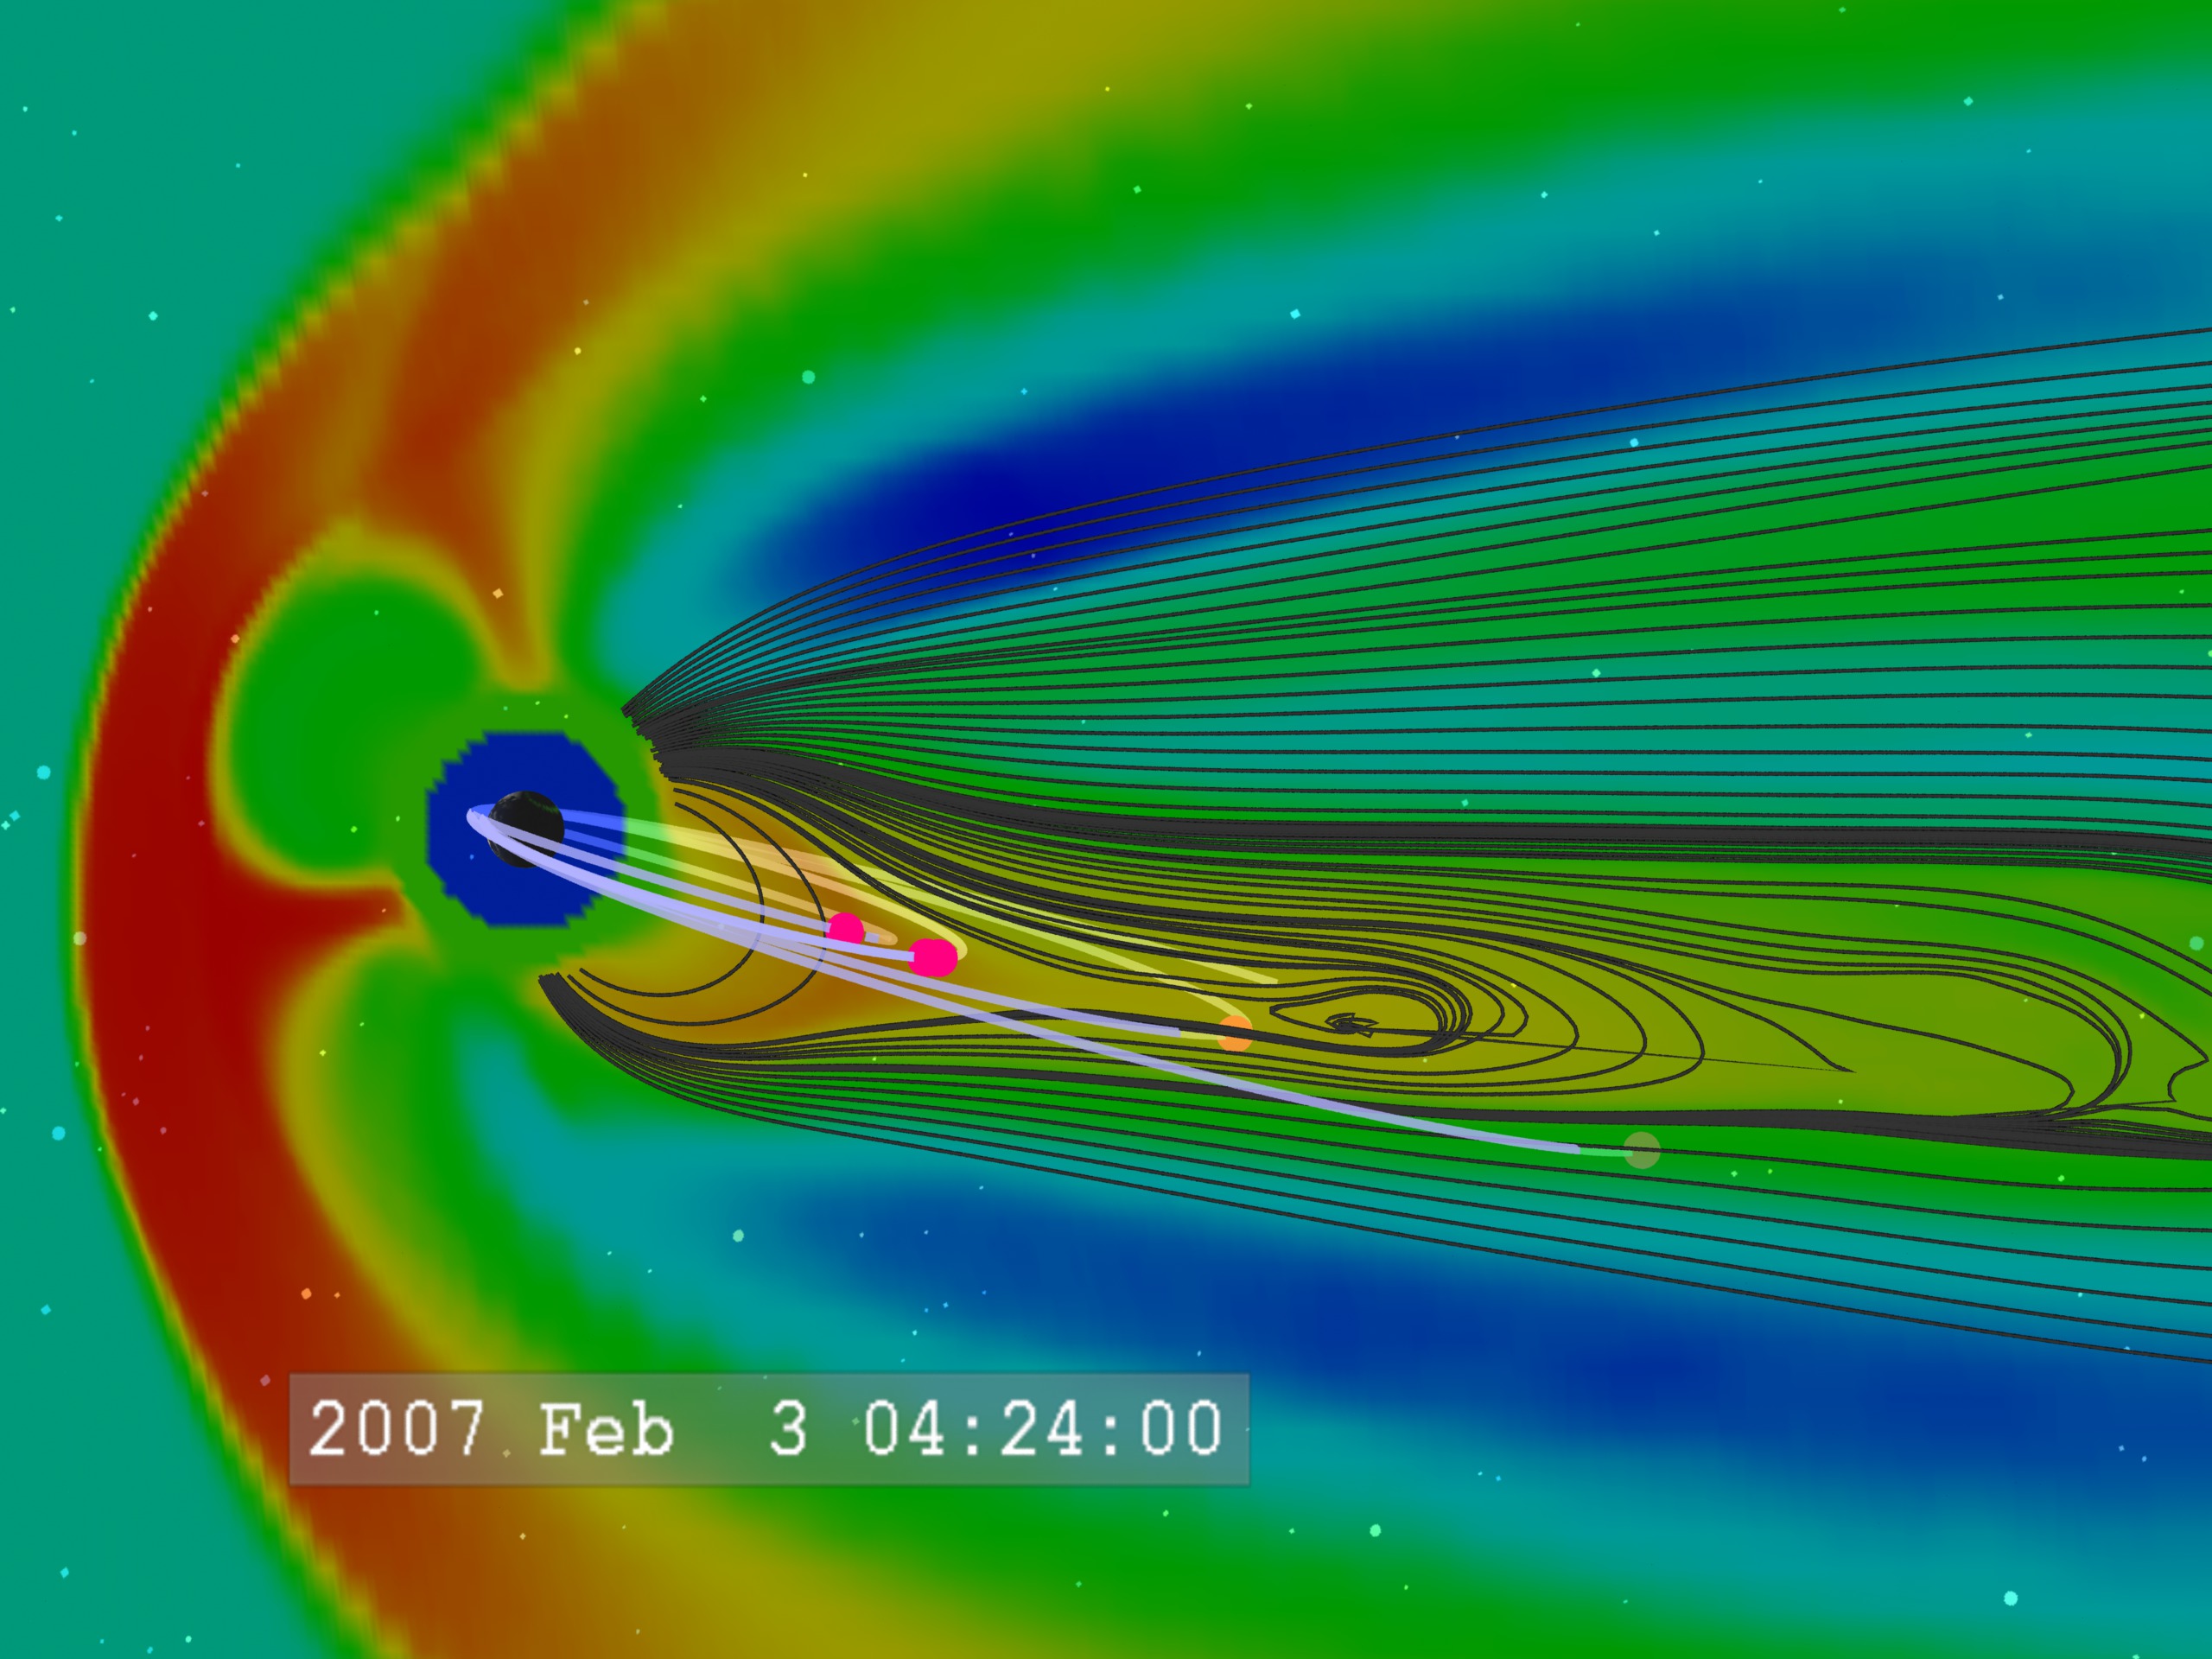
Go to this pageThis visualization combines simulations of the THEMIS (Time History of Events and Macroscale Interactions during Substorms) mission orbits with a GGCM (Geospace General Circulation Model) simulation. It illustrates how the five THEMIS satellites will work together to detect substorm events in the magnetosphere. One goal of the THEMIS mission is to test how these substorm events are related to the formation of the aurora.This mission consists of five identical spacecraft (usually designated P1, P2, P3, P4 and P5) with orbits aligned so they reach their apogee along the same line from the Earth. This alignment remains fixed in space so as the Earth moves around the Sun, the constellation of spacecraft will extend on the nightside of the Earth in winter to sample the Earth's magnetosphere, and on the dayside of the Earth in summer to sample the incoming solar wind. This way they can better map the geospace environment.Probes P1 and P2 are called the 'outer probes' and P3, 4, and 5 are the 'inner probes'. P3 and P4 share the same orbit. The outer probes will detect the onset of the substorm, while the inner probes will monitor the Earthward plasma flows from the event.For more information on the GGCM model, visit the Community Coordinated Modeling Center and OpenGGCM. ||
![Complete transcript available.Music credit: “Intrigues and Plots” and “Repetitive Motion” by Laurent Dury [SACEM] from Universal Production Music Watch this video on the NASA Goddard YouTube channel.](/vis/a010000/a013600/a013687/13687_AuroralBeads_YouTube.00320_print.jpg)
