Warming world: Snaps from space
Visuals
Flood. Drought. Heat waves. Ice melt. The impact of a warming world is being manifested in a variety of ways, and we can see it from space. Browse through our gallery of pictures taken by NASA satellites looking down at planet Earth.
- Link
Heat waves
Less than a year after a devastating 2003 heat wave killed over 37,000 people across Europe, another heat wave struck the region. On July 1, 2004, this image from NASA's Moderate Resolution Imaging Spectroradiometer (MODIS) recorded land surface temperatures of 138°F (59°C) in Spain. In this false-color image, red represents the warmest temperatures, yellow is intermediate, and light and dark blue are progressively cooler. Air temperatures in both countries soared over 104°F (40°C). Three days after this image was taken, Spain set a new air temperature record for the nation: 117°F (47°C). Climate models predict more extreme weather events, including heat waves, in the coming decades due to man-made climate change. Image taken by NASA's Moderate Resolution Imaging Spectroradiometer (MODIS) on July 1, 2004. Credit: Jacques Descloitres and Ana Pinheiro, MODIS Rapid Response Team, NASA/GSFC.
Go to this link - Link
Fresh water
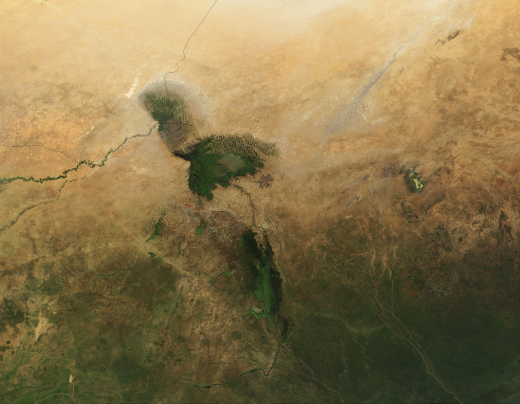
Lake Chad was once one of the African continent's largest bodies of fresh water, close in surface area to North America's Lake Erie. But today it is a ghost of its former self, reduced to only about 1/20 th its former size in just four decades, thanks to prolonged drought and human demand for water. Found at the intersection of four different countries in West Africa (Chad, Niger, Nigeria, and Cameroon), Lake Chad has been the source of water for massive irrigation projects. True-color image taken by NASA's Moderate Resolution Imaging Spectroradiometer (MODIS) on October 21, 2001. Credit: Jacques Descloitres, MODIS Land Rapid Response Team, NASA/GSFC.
Go to this link - Link
Permafrost
Arctic permafrost -- hard, permanently frozen ground -- thaws and collapses as temperatures rise, forming sinkholes that destroy homes, highways and pipelines. In low-lying areas, seawater inundates sinking areas of melted permafrost. In this Landsat image of Cape Halkett, along the north coast of Alaska, green and light blue indicate land lost to permafrost melting between 1955 and 2005. Heat-trapping greenhouse gases held within the permafrost, such as carbon dioxide and methane, are released when it melts, further contributing to atmospheric warming. Methane is 25 times more potent per molecule than carbon dioxide as a greenhouse gas. If the high northern latitudes continue warming at current rates, the region's soils will release more carbon dioxide and methane into the atmosphere, which could accelerate global warming. Image taken by the Landsat satellite. Credit: Mars/Houseknecht, USGS.
Go to this link - Link
Floods
Extreme events such as floods and storm surges are likely to increase with a warming climate, threatening low-lying areas in river floodplains and continental coasts. This March 28, 2009 image taken from space shows the swollen Red River snaking through the U.S. cities of Fargo, North Dakota and Moorhead, Minnesota. The river's usual S-shaped curves north and south of Interstate 94 had been swallowed in a bulge of water, and the flooding can be seen encroaching upon the tiny, neat squares that represent neighborhoods. Draining of wetlands and development along river margins contribute to the flooding risk by reducing the area over which water can spread without doing damage. A warming world also makes heavily populated coastal areas more vulnerable to flooding: higher global temperatures produce warmer seawater, which expands and causes a rise in sea level. Approximately 400 million people live within 20 meters (0.01 miles) of sea level and 20 km (12 miles) of a coast; modest increases in sea level could displace millions of people. Image taken by the Advanced Land Imager on NASA's EO-1 satellite on March 28, 2009. Credit: NASA image created by Jesse Allen, using EO-1 ALI data provided courtesy of the NASA EO-1 Team.
Go to this link - Link
Fire
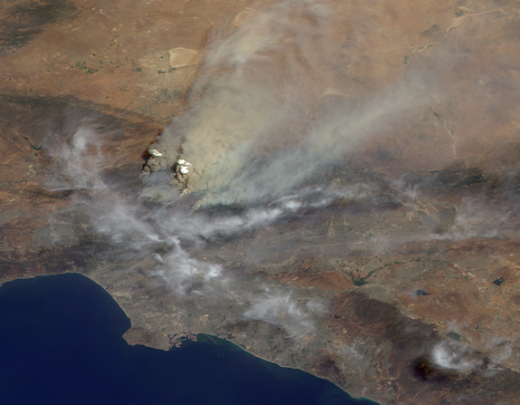
A fiery combination of heat, drought and a multi-year accumulation of dense, dry underbrush all contributed to the rapid spread of the arson-caused Station Fire, the largest fire in Los Angeles County's modern history. On August 26, 2009, the Multi-angle Imaging Spectroradiometer (MISR) instrument onboard NASA's Terra satellite captured this image, along with 3D information about the fire's smoke plume, which climbed more than 7 kilometers (4.3 miles) up into the atmosphere. The wind is blowing from the lower left toward the upper right in this image, and in addition to the whitish-brown smoke, a band of gray-white cloud appears to bend around the heat island caused by the fire. Wildfire activity in the western U.S. has increased markedly since the mid-1980s, with more frequent large fires and longer fire seasons. Climate models predict increased wildfire risk across many areas of the globe in coming decades. Image taken by the Multi-angle Imaging SpectroRadiometer (MISR) instrument on NASA's Terra satellite on August 30, 2009. Credit: NASA/GSFC/LaRC/JPL, MISR Team.
Go to this link - Link
Animals/Plants
Mountain pine beetle populations have exploded across western North America, as fewer colder nights freeze the insects and keep their numbers in check. The beetles feed and lay eggs in pine trees; eventually, a large enough infestation can kill the tree. The current infestation in British Columbia's forests, which began in the 1990s, is ten times larger than any other on record. In this 2006 false-color image, trees damaged and destroyed by beetles, shown in red, yellow and brown, cover a wide swath in the Cariboo region of British Columbia. Healthy, growing forests take up carbon dioxide (a powerful greenhouse gas) and produce oxygen. Dead forests release carbon dioxide when trees decay, and could accelerate warming. The Canadian Forest Service predicts that beetle-damaged Canadian forest tracts will release 220 megatons of carbon dioxide into the atmosphere by 2020. Image taken by the Moderate Resolution Imaging Spectroradiometer (MODIS) onboard NASA's Terra satellite in June/July 2006.
Go to this link - Link
Glaciers/Land ice
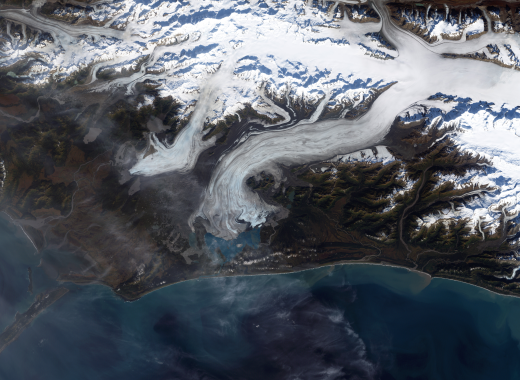
Like many glaciers around the world, the Bering glacier in Alaska is retreating. It is the largest and longest glacier in continental North America, with an area of approximately 5,200 square kilometers (2000 square miles), and comprises 6 percent of the total glacier-covered area of Alaska. Warmer temperatures and changes in precipitation over the past century have thinned the Bering Glacier by several hundred meters; since 1900 the terminus, which can be seen in the lower right of this image, has retreated as much as 12 km (7.5 miles). Melting glaciers contribute to sea level rise, could endanger freshwater supplies in countries downstream of the Himalayas and elsewhere, and can even cause earthquakes, as they have in this region. True-color image taken by the Enhanced Thematic Mapper plus (ETM+) instrument aboard the USGS/NASA Landsat-7 satellite on September 29, 2002. Credit: Landsat-7, NASA/USGS.
Go to this link - Link
Disease
Mosquitoes carry a variety of diseases including malaria, yellow fever, West Nile virus and Rift Valley Fever. Warmer temperatures and increased flooding -- both predicted by climate models in some regions -- can increase their habitat. In Yemen, an outbreak of Rift Valley Fever in 2000 was linked to widespread flooding in semi-arid areas. The Landsat satellite enabled researchers to target Rift Valley Fever hotspots by looking for potential mosquito habitat in vegetation that had cropped up after the floods. In this false-color image, heavily vegetated areas appear in red. Image taken by the Landsat 7 satellite in September 2000. Credit: NASA/USGS Landsat.
Go to this link - Link
Drought
Drought is a frequent visitor in Australia. The Australian Bureau of Meteorology describes the typical rainfall over much of the continent as "not only low, but highly erratic." As 2009 drew to a close, the southeastern states of Victoria and New South Wales were enduring their third year of drought, which has been devastating for farmers.
Go to this link
Dry, windy weather sent clouds of dust across Northern Queensland toward New Zealand on September 24, 2009. The tan dust is densely concentrated in a compact plume along the coastline, and can be seen mingling with gray smoke from wildfires in the middle-left of the image. Dry conditions kill off vegetation that normally anchors soil in place, helping create the conditions that lead to dust storms. Climate models predict agricultural and forest production will decline over much of southern and eastern Australia, and over parts of eastern New Zealand, due to increased drought and fire. Image taken by the Moderate Resolution Imaging Spectroradiometer (MODIS) onboard NASA's Terra satellite on September 24, 2009. Courtesy Jeff Schmaltz, MODIS Rapid Response Team, NASA GSFC. - Link
Ice shelves
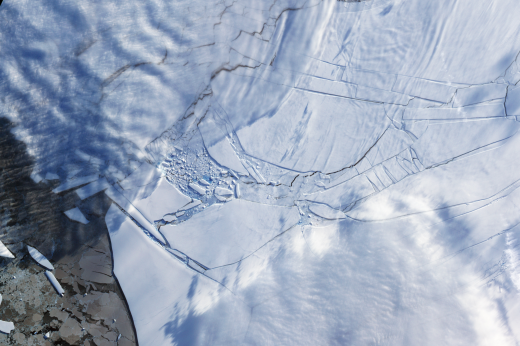
The Wilkins Ice Shelf, a thick slab of ice on the western side of the Antarctic Peninsula, underwent several breakups in 2008. The ice began to rapidly retreat in February, near the end of the Antarctic summer. In May, during the Antarctic autumn, another breakup occurred. Fresh cracks appeared on the shelf in late November 2008 and by the beginning of 2009, a narrow ice bridge was all that remained to connect the ice shelf to ice fragments fringing nearby Charcot Island. That bridge gave way in early April 2009. This image was taken days after the ice bridge rupture. Since ice reflects light from the sun, as polar ice caps melt, less sunlight gets reflected into space. It is instead absorbed by the ocean and land, increasing surface heat budgets and fueling further melting. Image taken on April 12, 2009 by the Advanced Spaceborne Thermal Emission and Reflection Radiometer (ASTER) on NASA's Terra satellite. Credit: NASA/GSFC/METI/ERSDAC/JAROS, and U.S./Japan ASTER Science Team.
Go to this link


