SDO First Light Media
A compilation of some of the videos and stills used during the SDO First Light press conference.
There are more video and stills available.
This compilation of video shows some of the first imagery and data sent back from NASA's Solar Dynamics Observatory (SDO). Most of the imagery comes from SDO's AIA instrument, and different colors are used to represent different temperatures, a common technique for observing solar features. SDO sees the entire disk of the Sun in extremely high spacial and temporal resolution and this allows scientists to zoom in on notable events like flares, waves, and sunspots.
Credit: NASA/Goddard Space Flight Center/SDO/AIA/HMI

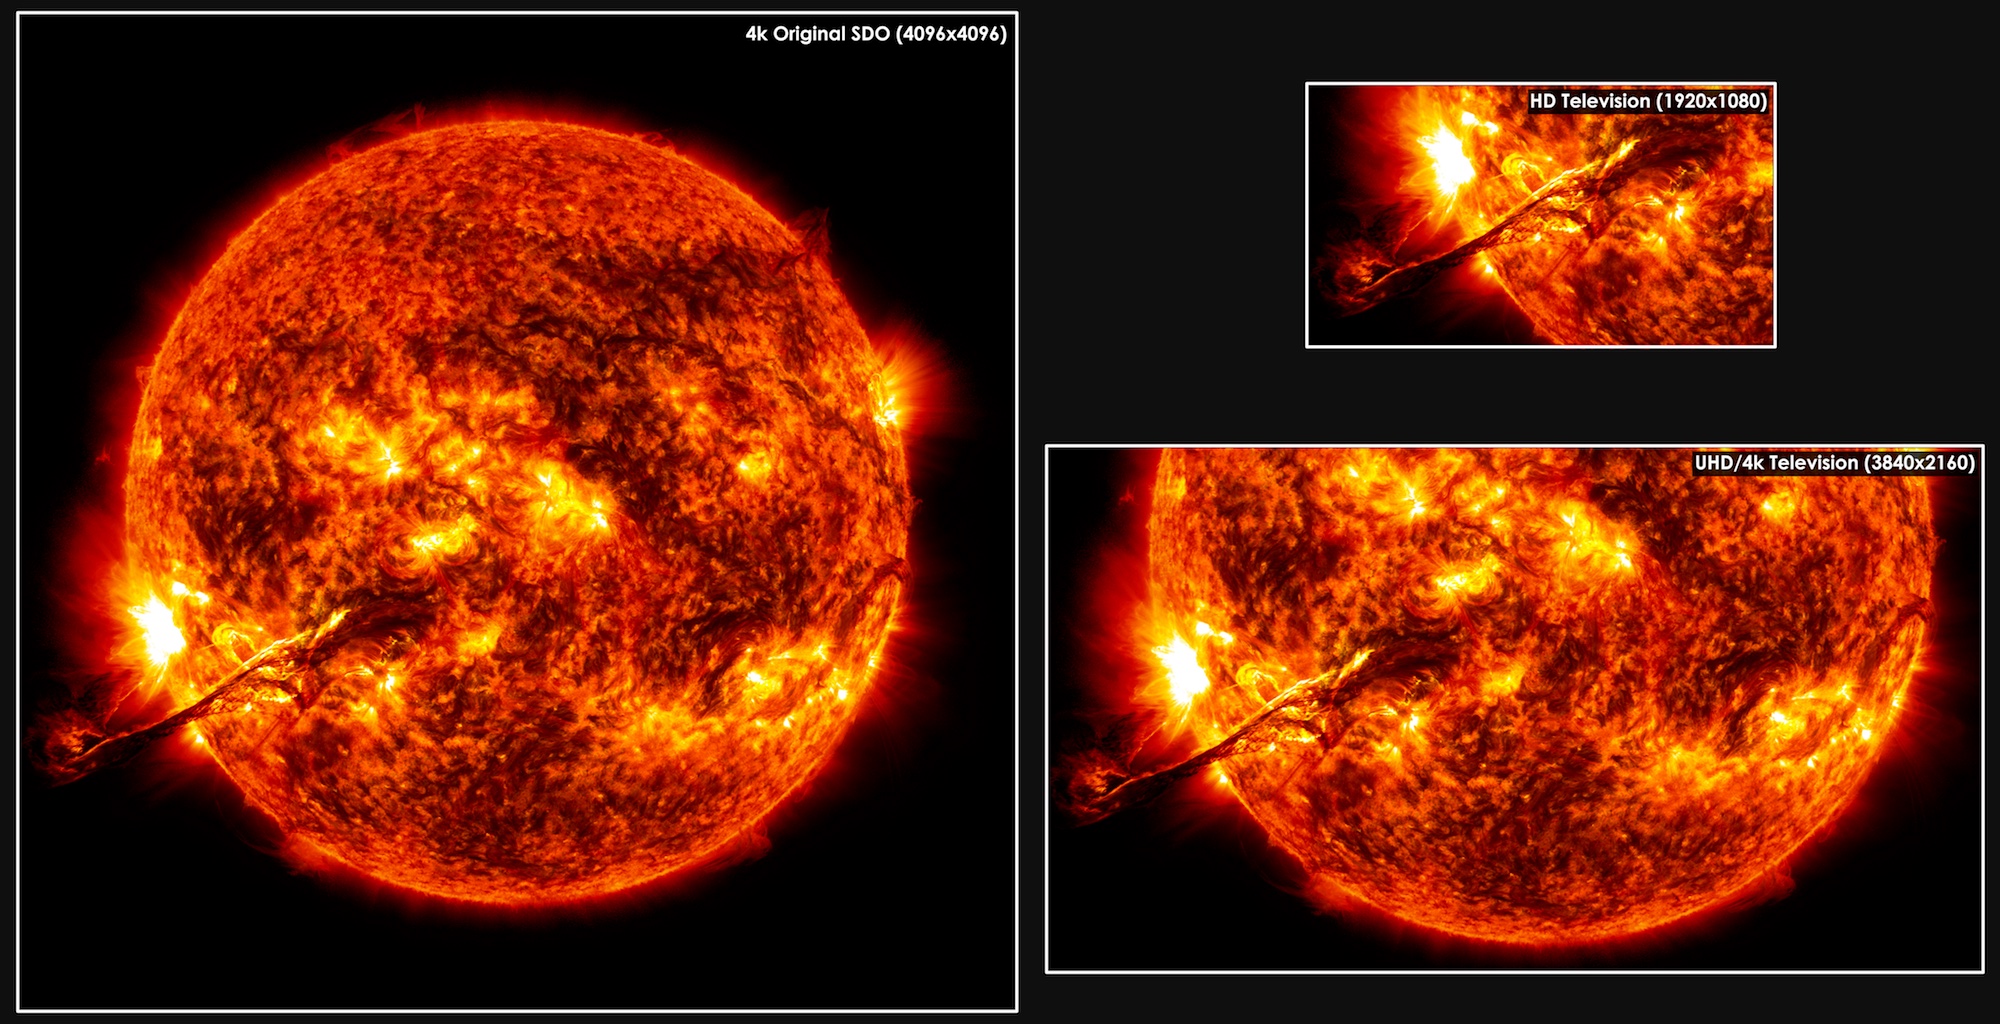
Comparison of SDO image resolution to other sun observing satellites.
Launch of SDO.

This EVE image is showing the raw spectral irradiance data. The ridges are summed to give the actual spectrum. The top part covers wavelengths from 20 to 5 nm (left to right) and the bottom from 37 to 17 nm (left to right. The overlap between 17 and 20 nm is used to better measure that part of the spectrum. In the lower left is a pinhole camera image of the Sun in X-rays with wavelengths between 0.1-7 nm. Credit: NASA/SDO/EVE
This movie shows the solar extreme ultraviolet (EUV) spectrum measured by EVE. Every peak, called an emission line, has a story to tell, and thanks to the new capability of EVE we are ready to see 100s of stories unfold during each solar storm. EVE measures this spectrum every 10 seconds - the same amount of time that the movie scrolled the EUV spectrum across the screen. Credit: LASP/CU
This movie illustrates how the solar EUV irradiance, as measured by SDO EVE, varied during the C4 flare on March 27, 2010.
Credit: LASP/CU

This slide shows the solar X-ray monitor from the NOAA GOES satellite. These X-ray measurements are used to provide flare warnings and to classify how bright each flare is. This slide indicates that there was a C4 type flare at about 18:30 on March 27, 2010 - just hours after the EVE instrument opened its doors and started to make solar observations. Credit: NOAA SWPC
Images taken immediately after the AIA CCD cameras cooled on March 30, 2010. The red images are in He II that is formed at 80,000K and in Fe IX 1,000,000K. The extent of the He II loop is equivalent to 30 Earth diameters. Credit: NASA/GSFC/SDO/AIA
Solar Wave Associated with CME. Movies in a series of temperatures of a large fraction of the on April 8,2010. They show a wave associated with a Coronal Mass Ejection. This wave travels nearly all the way across the sun.
Credit: NASA/GSFC/SDO/HMI
The Flare that Started the Wave. Movies of the small (B 3.7) flare that started the wave. In a series of temperature, the start of the wave and the heating of the flare.
Credit: NASA/GSFC/SDO/AIA
A series of movies that illustrate the power of the AIA to show regions of heating and cooling. The first movies are shown in colors from blue to red, which span temperatures from 1,000,000K to 2,600,000K. The second spans the temperatures from 2,600,000K to 10,000,000K. To convert from K to F multiply by 1.8.
Credit: NASA/GSFC/SDO/AIA
For More Information
Credits
Please give credit for this item to:
NASA/Goddard Space Flight Center. However, individual items should be credited as noted above.
-
Animators
- Walt Feimer (HTSI)
- Tom Bridgman (Global Science and Technology, Inc.)
-
Video editors
- Andrew Freeberg (NASA/GSFC)
- Scott Wiessinger (UMBC)
-
Producer
- Scott Wiessinger (UMBC)
-
Scientists
- William D. Pesnell (NASA/GSFC)
- Philip Scherrer (Stanford University)
- Tom Woods (University of Colorado)
- Alan Title (LMSAL)
Release date
This page was originally published on Thursday, March 3, 2011.
This page was last updated on Wednesday, May 3, 2023 at 1:53 PM EDT.
Missions
This page is related to the following missions:Series
This page can be found in the following series:Tapes
The media on this page originally appeared on the following tapes:-
SDO-First Light
(ID: 2010063)
Wednesday, April 21, 2010 at 4:00AM
Produced by - Robert Crippen (NASA)
