SDO Solar Comparison October 2010 to October 2012
The sun goes through a natural solar cycle approximately every 11 years. The cycle is marked by the increase and decrease of sunspots — visible as dark blemishes on the sun's surface, or photosphere. The greatest number of sunspots in any given solar cycle is designated as "solar maximum." The lowest number is "solar minimum."
The solar cycle provides more than just increased sunspots, however. In the sun's atmosphere, or corona, bright active regions appear, which are rooted in the lower sunspots. Scientists track the active regions since they are often the origin of eruptions on the sun such as solar flares or coronal mass ejections.
The most recent solar minimum occurred in 2008, and the sun began to ramp up in January 2010, with an M-class flare (a flare that is 10 times less powerful than the largest flares, labeled X-class). The sun has continued to get more active, with the next solar maximum predicted for 2013.
The journey toward solar maximum is evident in current images of the sun, showing a marked difference from those of 2010, with bright active regions dotted around the star.

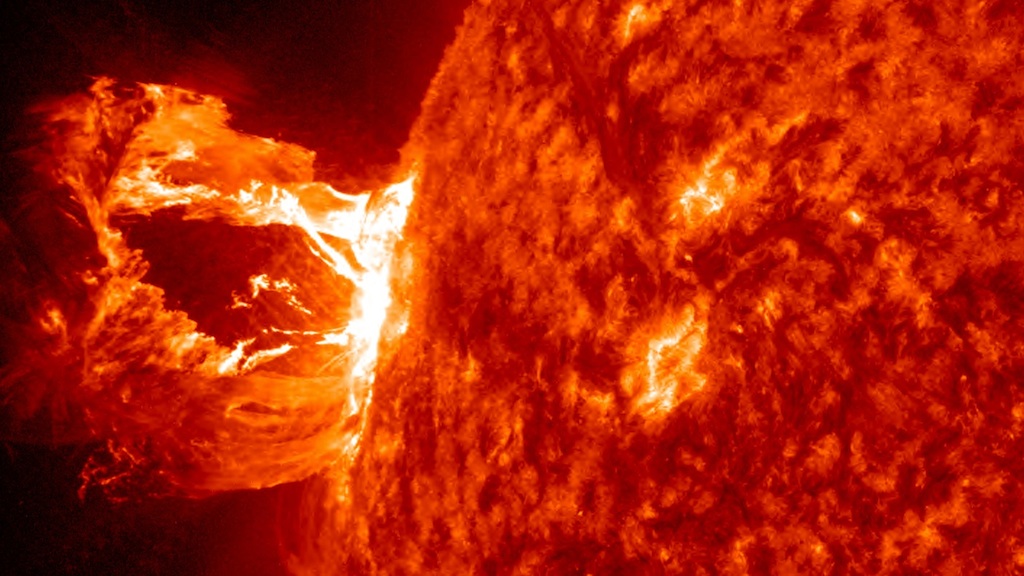
The picture on the left shows a calm sun from Oct. 2010. The right side, from Oct. 2012, shows a much more active and varied solar atmosphere as the sun moves closer to peak solar activity, or solar maximum, predicted for 2013. Both images were captured by NASA's Solar Dynamics Observatory (SDO) observing light emitted from the 1 million degree plasma, which is a good temperature for observing the quiet corona.

Comparison of solar activity as seen by the Solar Dynamics Observatory (SDO) in October 2010 and October 2012. The wavelength of these images is 171 angstroms.

The picture on the left shows a calm sun from Oct. 2010. The right side, from Oct. 2012, shows a much more active and varied solar atmosphere as the sun moves closer to peak solar activity, or solar maximum, predicted for 2013. Both images were captured by NASA's Solar Dynamics Observatory (SDO) observing light emitted from the 1 million degree plasma, which is a good temperature for observing the quiet corona. No Labels.

SDO October Comparison split image, No Labels.

SDO 171 angstrom image from Oct 6, 2010

SDO 171 angstrom image from October 20, 2012
For More Information
Credits
Please give credit for this item to:
NASA's Goddard Space Flight Center/SDO
-
Animator
- Scott Wiessinger (USRA)
-
Producer
- Scott Wiessinger (USRA)
-
Writer
- Karen Fox (ADNET Systems, Inc.)
Release date
This page was originally published on Monday, November 26, 2012.
This page was last updated on Wednesday, May 3, 2023 at 1:52 PM EDT.
Missions
This page is related to the following missions:Series
This page can be found in the following series:Datasets used
-
[SDO]
ID: 168This dataset can be found at: http://sdo.gsfc.nasa.gov/
See all pages that use this dataset -
AIA 171 (171 Filter) [SDO: AIA]
ID: 680This dataset can be found at: http://jsoc.stanford.edu/
See all pages that use this dataset
Note: While we identify the data sets used on this page, we do not store any further details, nor the data sets themselves on our site.
