OpenUniverse: Simulated Universe Views for Roman
This video begins with a tiny one-square-degree portion of the full OpenUniverse simulation area (about 70 square degrees, equivalent to an area of sky covered by more than 300 full moons). It spirals in toward a particularly galaxy-dense region, zooming by a factor of 75. This simulation showcases the cosmos as NASA’s Nancy Grace Roman Space Telescope could see it, allowing scientists to preview the next generation of cosmic discovery now. Roman’s real future surveys will enable a deep dive into the universe with highly resolved imaging, as demonstrated in this video.
Credit: NASA’s Goddard Space Flight Center and M. Troxel
Astronomers have released a set of more than a million simulated images showcasing the cosmos as NASA’s upcoming Nancy Grace Roman Space Telescope will see it. This preview will help scientists explore a myriad of Roman’s science goals.
The project, called OpenUniverse, relied on the now-retired Theta supercomputer at the DOE’s (Department of Energy’s) Argonne National Laboratory in Illinois. The supercomputer accomplished a process that would take over 6,000 years on a typical computer in just nine days.
In addition to Roman, the 400-terabyte dataset will also preview observations from the Vera C. Rubin Observatory, which is jointly funded by the National Science Foundation and the U.S. Department of Energy, and approximate simulations from ESA’s (the European Space Agency’s) Euclid mission, which has NASA contributions. The Roman data is available now here, and the Rubin and Euclid data will soon follow.
The team used the most sophisticated modeling of the universe’s underlying physics available and fed in information from existing galaxy catalogs and the performance of the telescopes’ instruments. The resulting simulated images span 70 square degrees, equivalent to an area of sky covered by more than 300 full moons. In addition to covering a broad area, it also covers a large span of time — more than 12 billion years.
This simulation showcases the dynamic universe as NASA’s Nancy Grace Roman Space Telescope could see it over the course of its five-year primary mission. The video sparkles with synthetic supernovae from observations of the OpenUniverse simulated universe taken every five days (similar to the expected cadence of Roman’s High-Latitude Time-Domain Survey, which OpenUniverse simulates in its entirety). On top of the static sky of stars in the Milky Way and other galaxies, more than a million exploding stars flare into visibility and then slowly fade away. To highlight the dynamic physics happening and for visibility at this scale, the true brightness of each transient event has been magnified by a factor of 10,000 and no background light has been added to the simulated images. The video begins with Roman’s full field of view, which represents a single pointing of Roman’s camera, and then zooms into one square.
Credit: NASA’s Goddard Space Flight Center and M. Troxel
This data sonification transforms a vast simulation of a cosmic survey from NASA’s upcoming Nancy Grace Roman Space Telescope into a symphony of stellar explosions. Each supernova’s brightness controls its volume, while its color sets its pitch –– redder, more distant supernovae correspond to deep, low tones while bluer, nearer ones correspond to higher frequencies. The sound in stereo mirrors their locations in the sky. The result sounds like celestial wind chimes, offering a way to “listen” to cosmic fireworks.
Credit: NASA’s Goddard Space Flight Center, M. Troxel, SYSTEM Sounds (M. Russo, A. Santaguida)
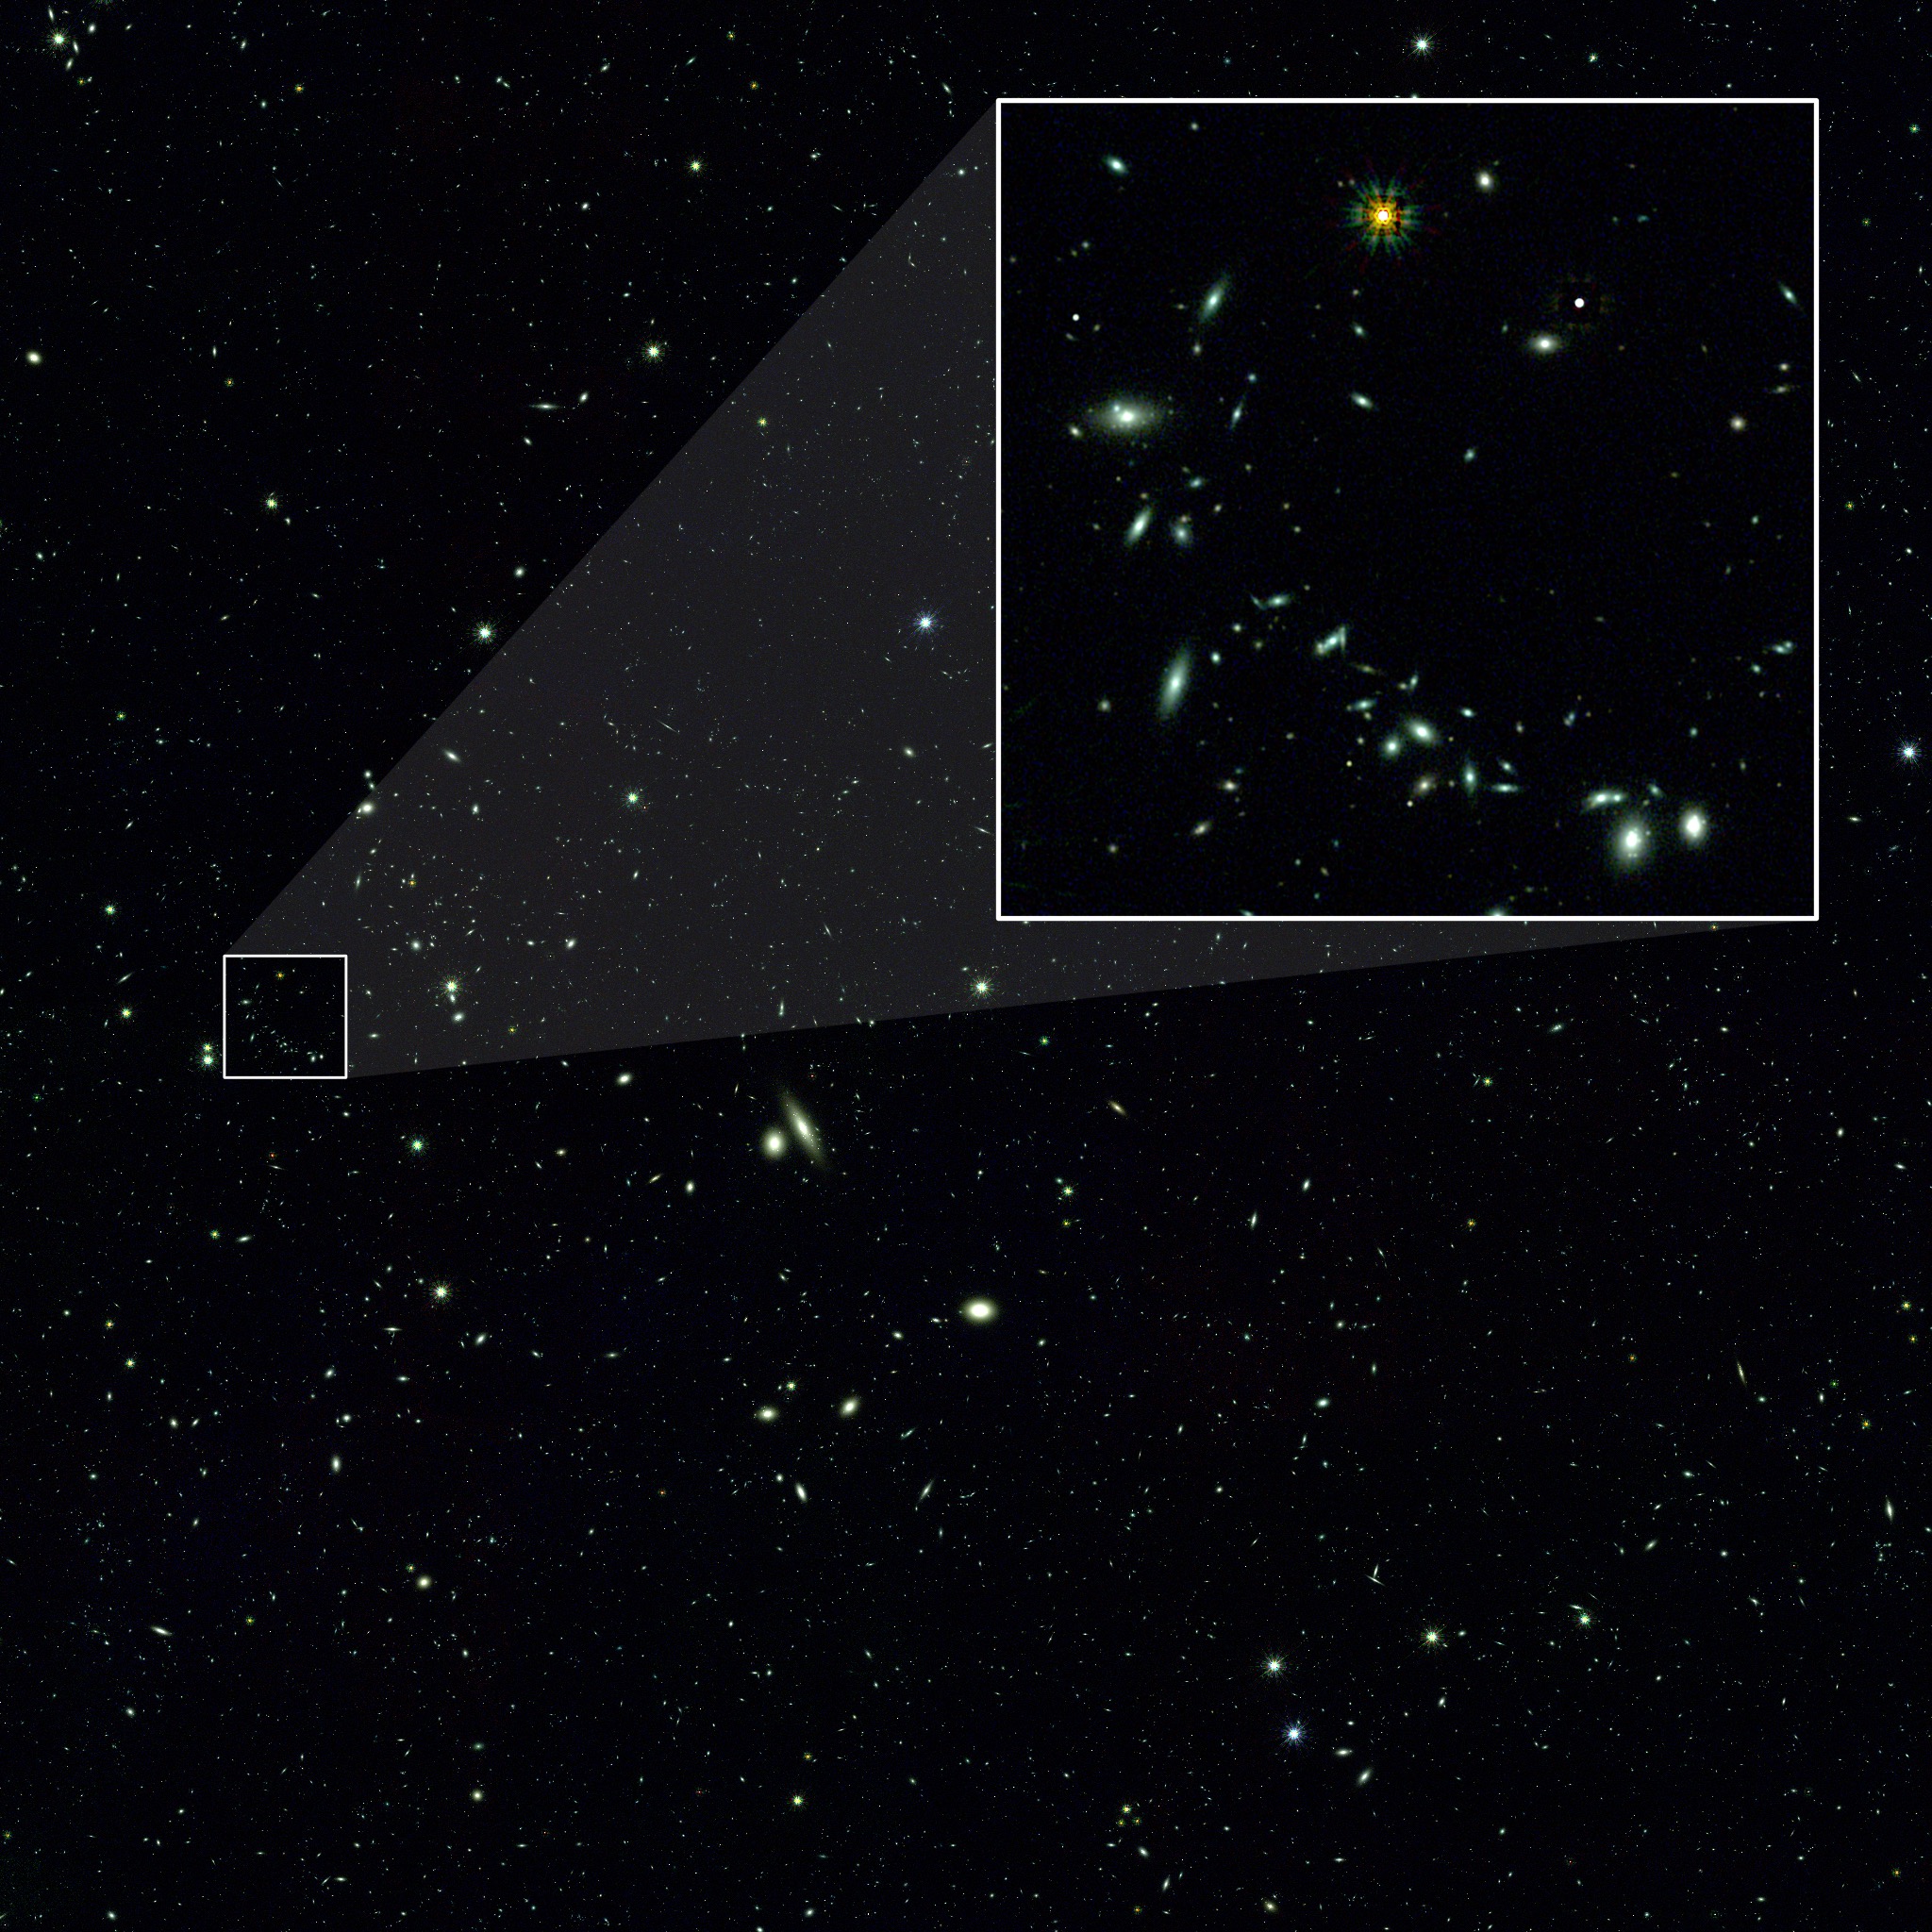
, while the inset at right is a close-up of an area 75 times smaller (1/600th the size of the full area). This simulation showcases the cosmos as NASA’s Nancy Grace Roman Space Telescope could see it. Roman will expand on the largest space-based galaxy survey like it – the Hubble Space Telescope’s COSMOS survey – which imaged two square degrees of sky over the course of 42 days. In only 250 days, Roman will view more than a thousand times more of the sky with the same resolution.Credit: NASA's Goddard Space Flight Center and M. Troxel")
Each tiny dot in the image at left is a galaxy simulated by the OpenUniverse campaign. The one-square-degree image offers a small window into the full simulation area, which is about 70 square degrees (equivalent to an area of sky covered by more than 300 full moons), while the inset at right is a close-up of an area 75 times smaller (1/600th the size of the full area). This simulation showcases the cosmos as NASA’s Nancy Grace Roman Space Telescope could see it. Roman will expand on the largest space-based galaxy survey like it – the Hubble Space Telescope’s COSMOS survey – which imaged two square degrees of sky over the course of 42 days. In only 250 days, Roman will view more than a thousand times more of the sky with the same resolution.
Credit: NASA's Goddard Space Flight Center and M. Troxel
Frame sequence of single Roman detector. The video sparkles with synthetic supernovae from observations of the OpenUniverse simulated universe taken every five days (similar to the expected cadence of Roman’s High-Latitude Time-Domain Survey, which OpenUniverse simulates in its entirety). To highlight the dynamic physics happening and for visibility at this scale, the true brightness of each transient event has been magnified by a factor of 10,000 and no background light has been added to the simulated images.
NASA’s Goddard Space Flight Center and M. Troxel
Frame sequence of full Roman field of view. The video sparkles with synthetic supernovae from observations of the OpenUniverse simulated universe taken every five days (similar to the expected cadence of Roman’s High-Latitude Time-Domain Survey, which OpenUniverse simulates in its entirety). To highlight the dynamic physics happening and for visibility at this scale, the true brightness of each transient event has been magnified by a factor of 10,000 and no background light has been added to the simulated images.
NASA’s Goddard Space Flight Center and M. Troxel
Set of images used to construct the zoom-in video. The first is a one-square-degree portion of the OpenUniverse simulation and they progressively narrow to a final image that approximates Roman's resolution.
Credit: NASA's Goddard Space Flight Center and M. Troxel
For More Information
Credits
Please give credit for this item to:
NASA's Goddard Space Flight Center. However, individual items should be credited as indicated above.
-
Producer
- Scott Wiessinger (eMITS)
-
Visualizer
- Michael Troxel (Duke University)
-
Science writer
- Ashley Balzer (ADNET Systems, Inc.)
Release date
This page was originally published on Tuesday, January 14, 2025.
This page was last updated on Tuesday, March 11, 2025 at 10:53 AM EDT.
Missions
This page is related to the following missions:Series
This page can be found in the following series:Related
- ID: 14604
- ID: 14301
