Earth: A System of Systems
Slices of Earth observational and modeling data
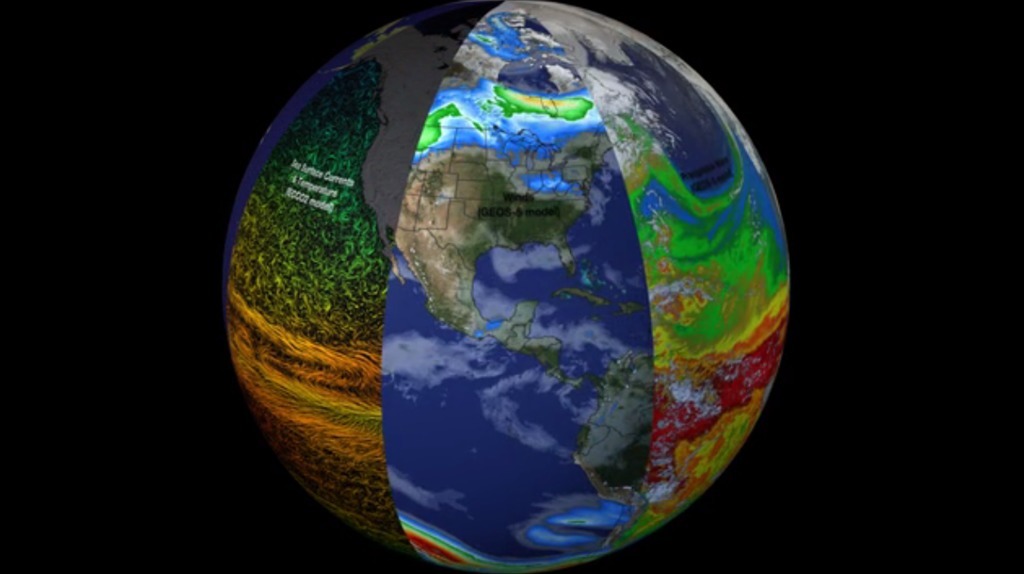
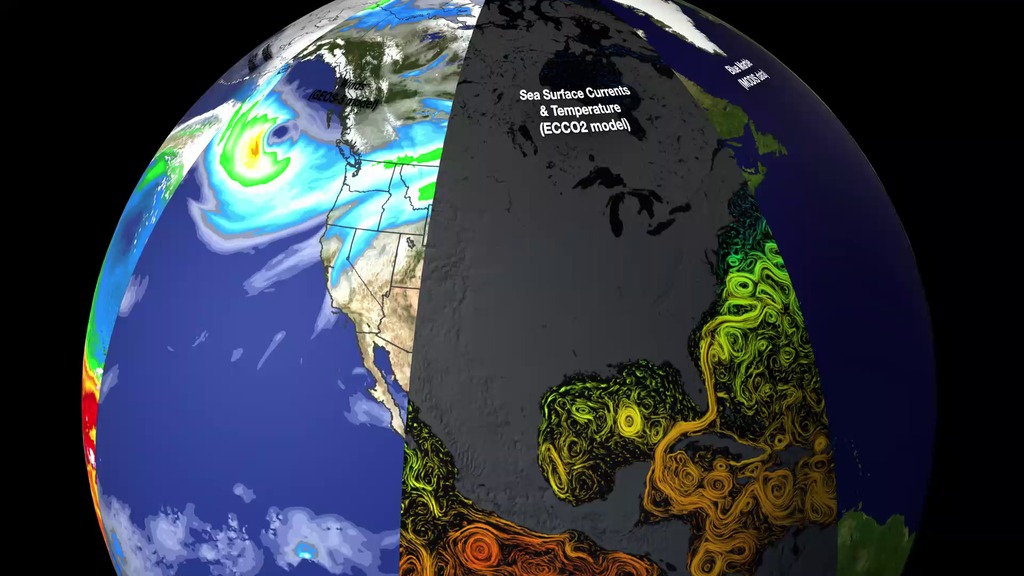
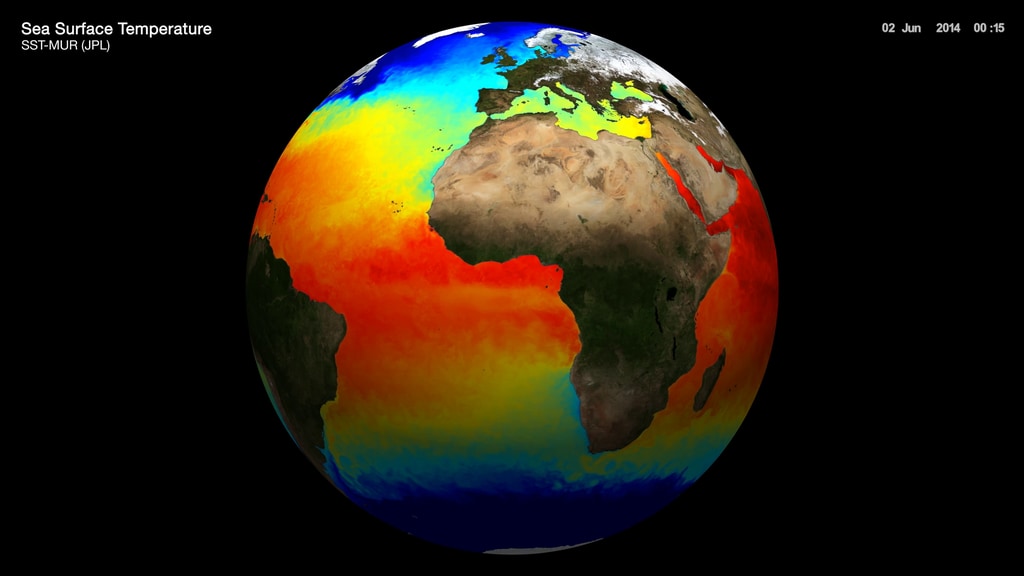
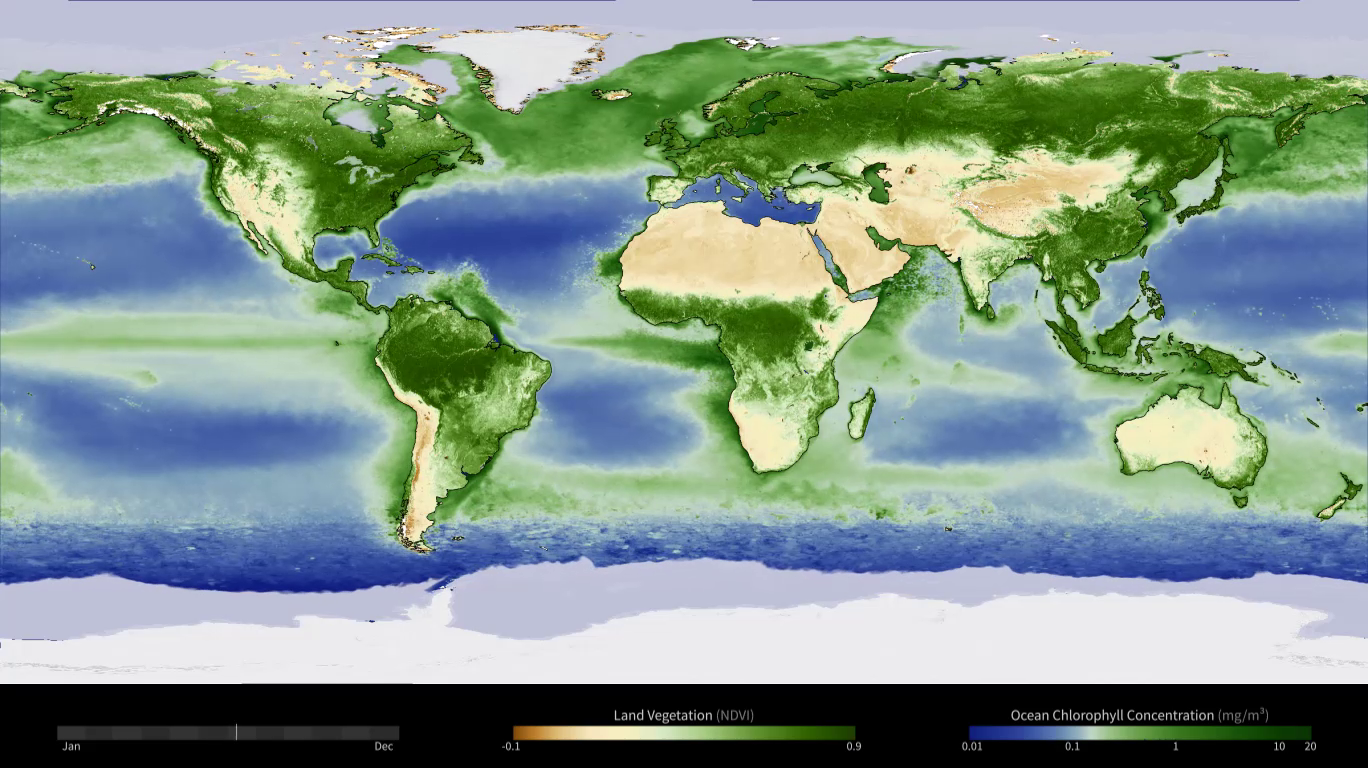
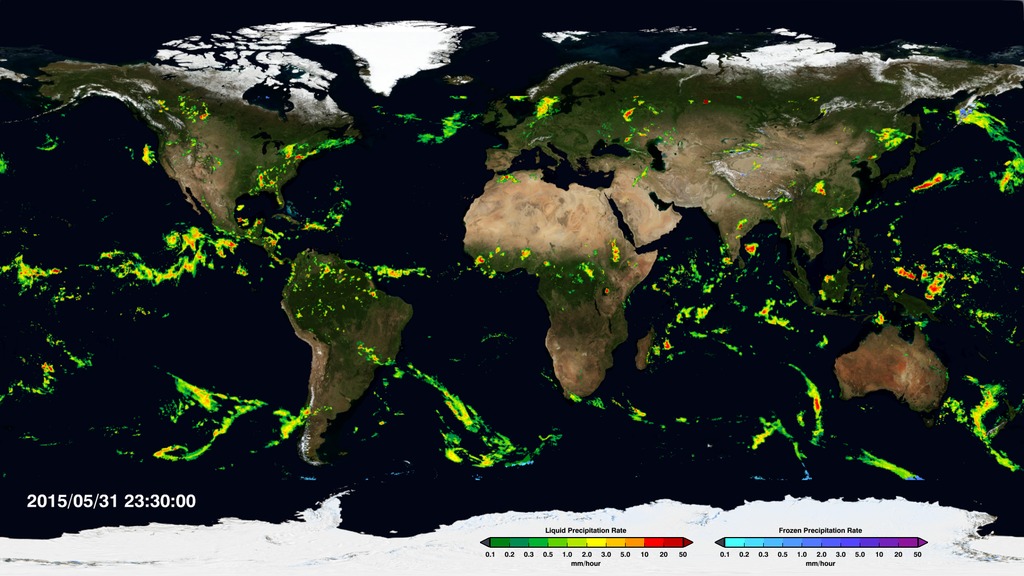
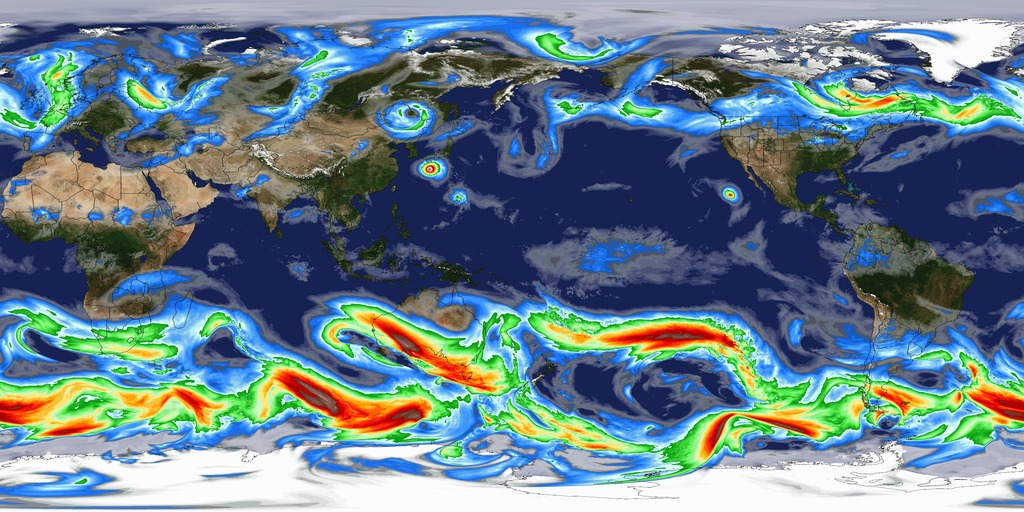
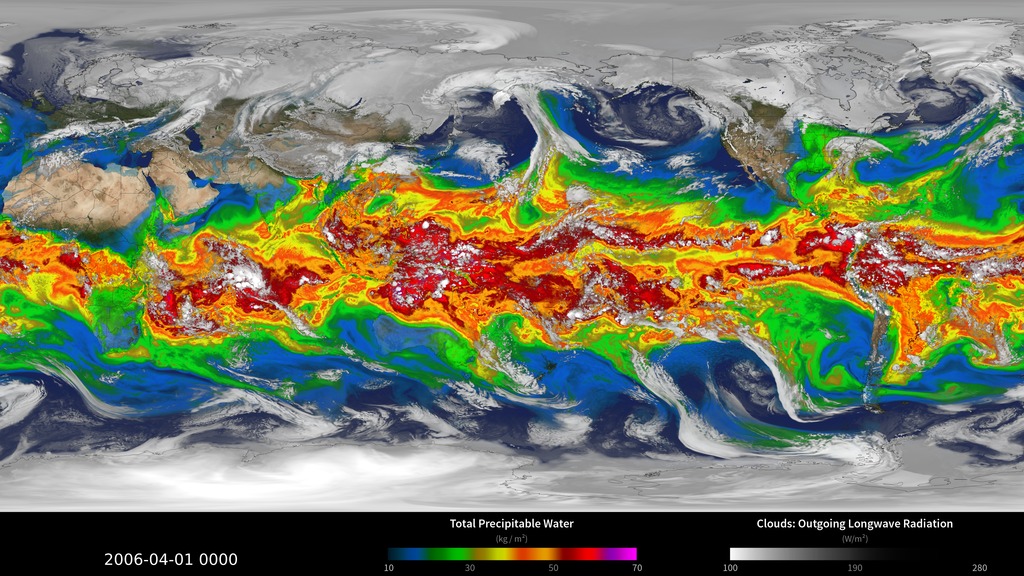
This visualization reveals that the Earth system, like the human body, comprises diverse components that interact in complex ways. Heat absorbed by the ocean is transported by ocean currents—shown here as ECCO2 model output. This energy is constantly released into Earth’s atmosphere. Heat and moisture from the ocean and land influence Earth’s weather patterns—represented here as 500 mb wind speeds from GEOS-5. Moisture in the atmosphere—represented as precipitable water from the GEOS-5 model—forms clouds and precipitation—shown here using the GPM IMERG product. Precipitation significantly impacts water availability, which influences soil moisture and ocean salinity—shown here as data from SMAP. Lastly, data from multiple satellites show the density of plant growth on land and chlorophyll concentrations in the ocean. While scientists learn a great deal from studying each of these components individually, improved observational and computational capabilities increasingly allow them to study the interactions between these interrelated geophysical and biological parameters, leading to unprecedented insight into how the Earth system works—and how it might change in the future.
List of visualizations used:
Slice 1: Sea Surface Currents & Temperature (ECCO2 model)
Slice 2: Winds (GEOS-5 model)
Slice 3: Precipitable Water (GEOS-5 model)
Slice 4: Clouds (GEOS-5 model)
Slice 5: Precipitation (IMERG data)
Slice 6: Soil Moisture (SMAP data)
Slice 7: Biosphere (Multiple satellite datasets)
Slice 8: Blue Marble (MODIS data)
Credits
Please give credit for this item to:
NASA's Goddard Space Flight Center
-
Animator
- Amy Moran (Global Science and Technology, Inc.)
-
Visualizer
Release date
This page was originally published on Monday, February 8, 2016.
This page was last updated on Monday, March 3, 2025 at 12:10 AM EST.


