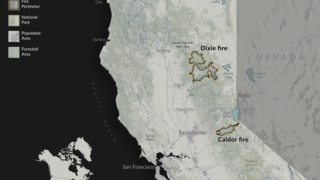
NASA’s New Scientific Breakdown of Dramatic Caldor and Dixie Fires
Complete transcript available.
This visualization shows the spread of the Caldor fire between August 15 and October 6, 2021, and the Dixie fire between July 14 and October 22, 2021, updated every 12 hours from a new fire detection and tracking approach based on near-real time active fire detections from the VIIRS sensor on the Suomi-NPP satellite. The yellow outlines track the position of the active fire lines for the last 60 hours, with the latest location of the fire front in the brightest shade of yellow. The red points show the location of active fire detections, while the grey region shows the estimated total area burned. The graph shows the cumulative burned area in square kilometers.
Credits
Please give credit for this item to:
NASA's Scientific Visualization Studio
-
Animator
- Cindy Starr (Global Science and Technology, Inc.)
-
Producer
- Kathleen Gaeta (Advocates in Manpower Management, Inc.)
-
Scientist
- Doug C. Morton (NASA/GSFC)
-
Visualizers
- Horace Mitchell (NASA/GSFC)
- Michala Garrison (SSAI)
- Andrew J Christensen (SSAI)
- Greg Shirah (NASA/GSFC)
- Kel Elkins (USRA)
- Alex Kekesi (Global Science and Technology, Inc.)
-
Technical support
- Laurence Schuler (ADNET Systems, Inc.)
- Ian Jones (ADNET Systems, Inc.)
Release date
This page was originally published on Monday, May 30, 2022.
This page was last updated on Tuesday, January 14, 2025 at 2:37 PM EST.


