A newer version of this visualization is available.
Ozone Minimum Concentrations, 1979-2023
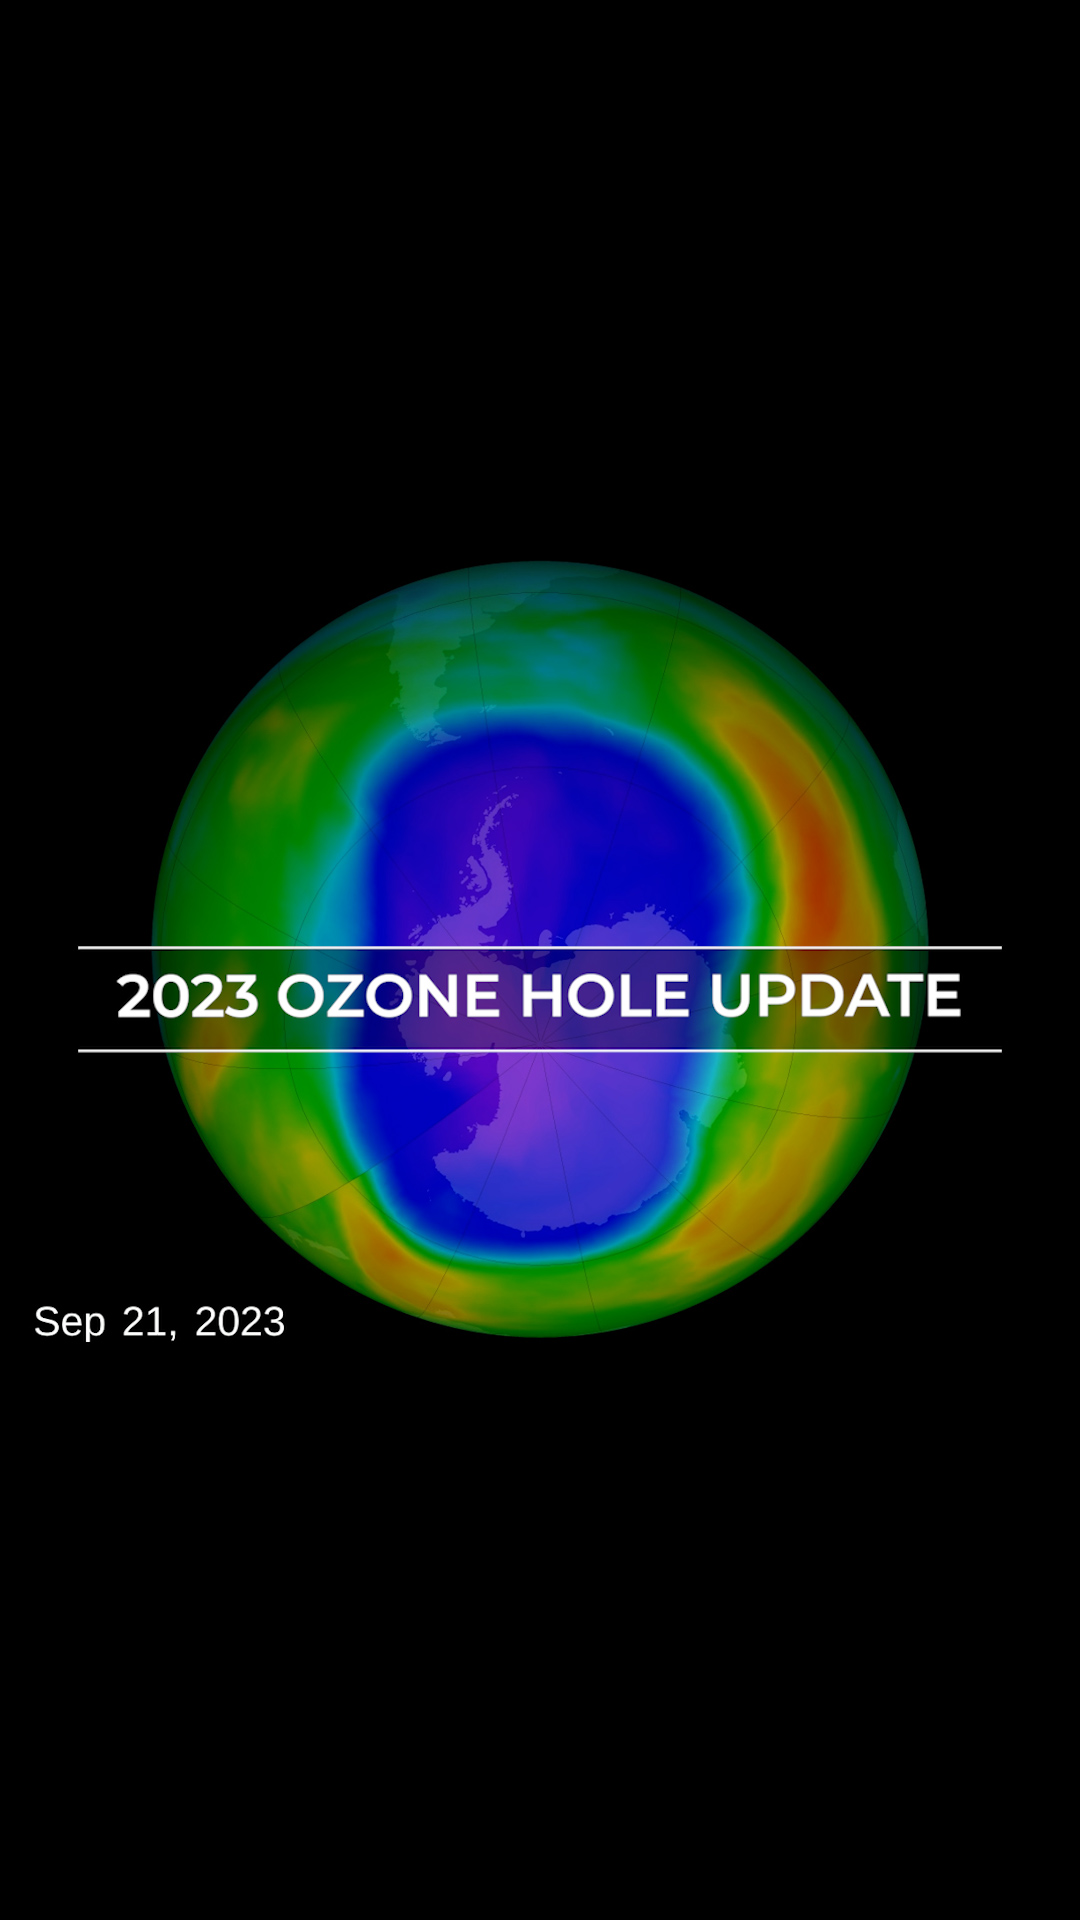
Here, the globes show ozone data on the day that the minimum ozone concentration was reached over Antarctica, each year from 1979 and 2023.
Ozone is Earth’s natural sunscreen, shielding life from dangerous solar ultraviolet radiation. Human-produced chemicals in our atmosphere—such as chlorofluorocarbons (CFCs), used for many years as refrigerants and in aerosol spray cans—have depleted the Earth’s ozone layer. Scientists first recognized the potential for harmful effects of CFCs on ozone in the early 1970s. In the 1980s, governments around the world woke up to the destruction of the ozone layer and in 1987 negotiated the Montreal Protocol—an international treaty designed to protect the ozone layer by banning CFCs and similar ozone-depleting chemicals.
Since the mid-1990s, global ozone levels have become relatively stable. In fact, because of the Montreal Protocol, model simulations suggest the size of the hole should return to its pre-1980 levels by about 2075. Here, the globes show ozone data on the day that the minimum ozone concentration was reached over Antarctica, each year from 1979 and 2023.
Data are from ozonewatch.gsfc.nasa.gov
Here, the globes show ozone data on the day that the minimum ozone concentration was reached over Antarctica, each year from 1979 and 2023, without the colorbar.
Here, the globes show ozone data on the day that the minimum ozone concentration was reached over Antarctica, each year from 1979 and 2023, without the colorbar or graph overlay.
Here, the globes show ozone data on the day that the minimum ozone concentration was reached over Antarctica, each year from 1979 and 2023, interpolated and without the colorbar or graph overlay.

False-color color table for total ozone over the Antarctic pole. The purple and blue colors are where there is the least ozone, and the yellows and reds are where there is more ozone.

False-color color table for total ozone over the Antarctic pole. The purple and blue colors are where there is the least ozone, and the yellows and reds are where there is more ozone.
For More Information
Credits
Please give credit for this item to:
NASA's Goddard Space Flight Center
-
Animator
- Amy Moran (Global Science and Technology, Inc.)
Release date
This page was originally published on Wednesday, October 18, 2023.
This page was last updated on Sunday, November 24, 2024 at 11:50 PM EST.


