A newer version of this visualization is available.
Major Hurricane Drought: Nine Years Without a Major Hurricane Making US Landfall
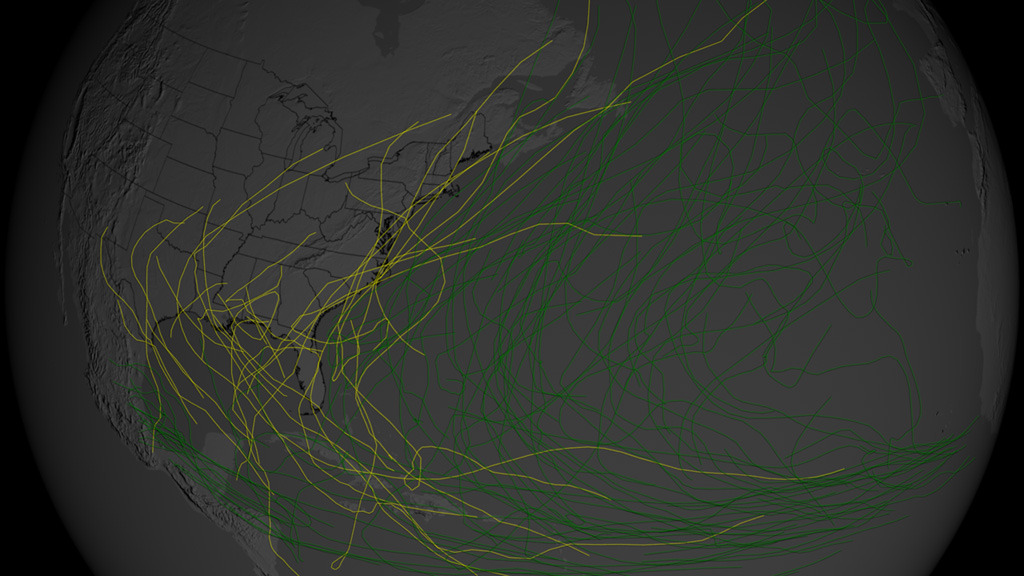
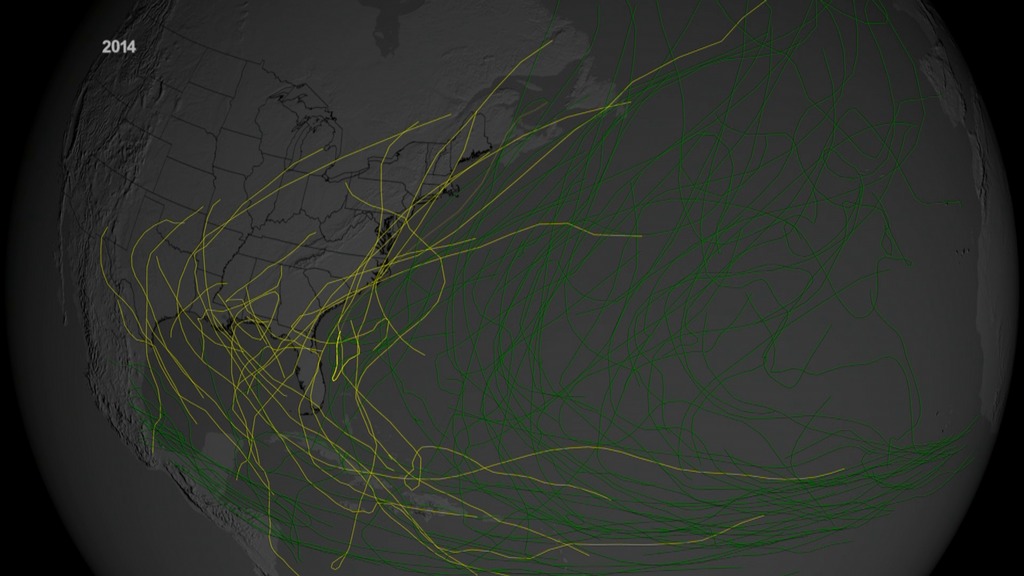
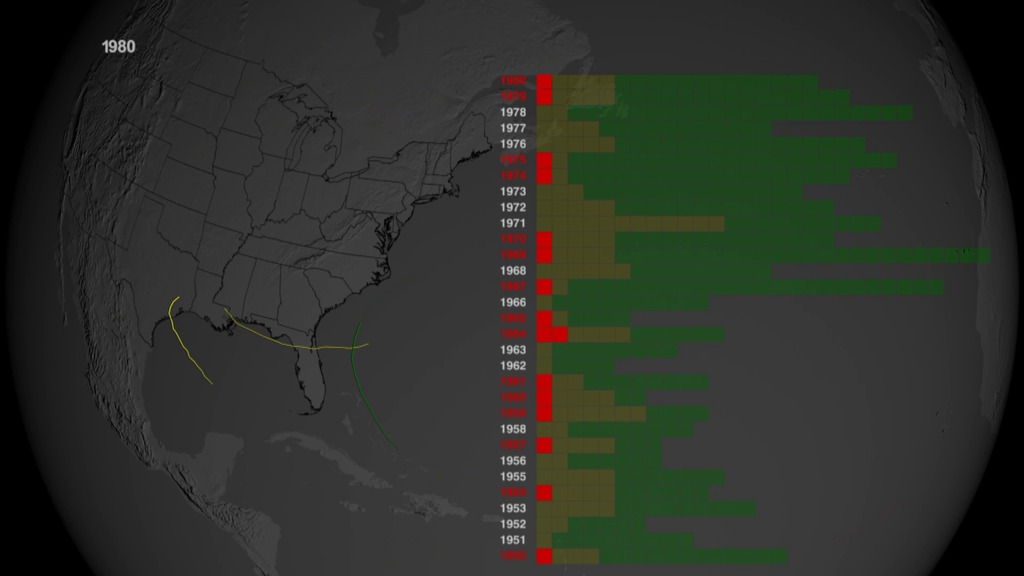
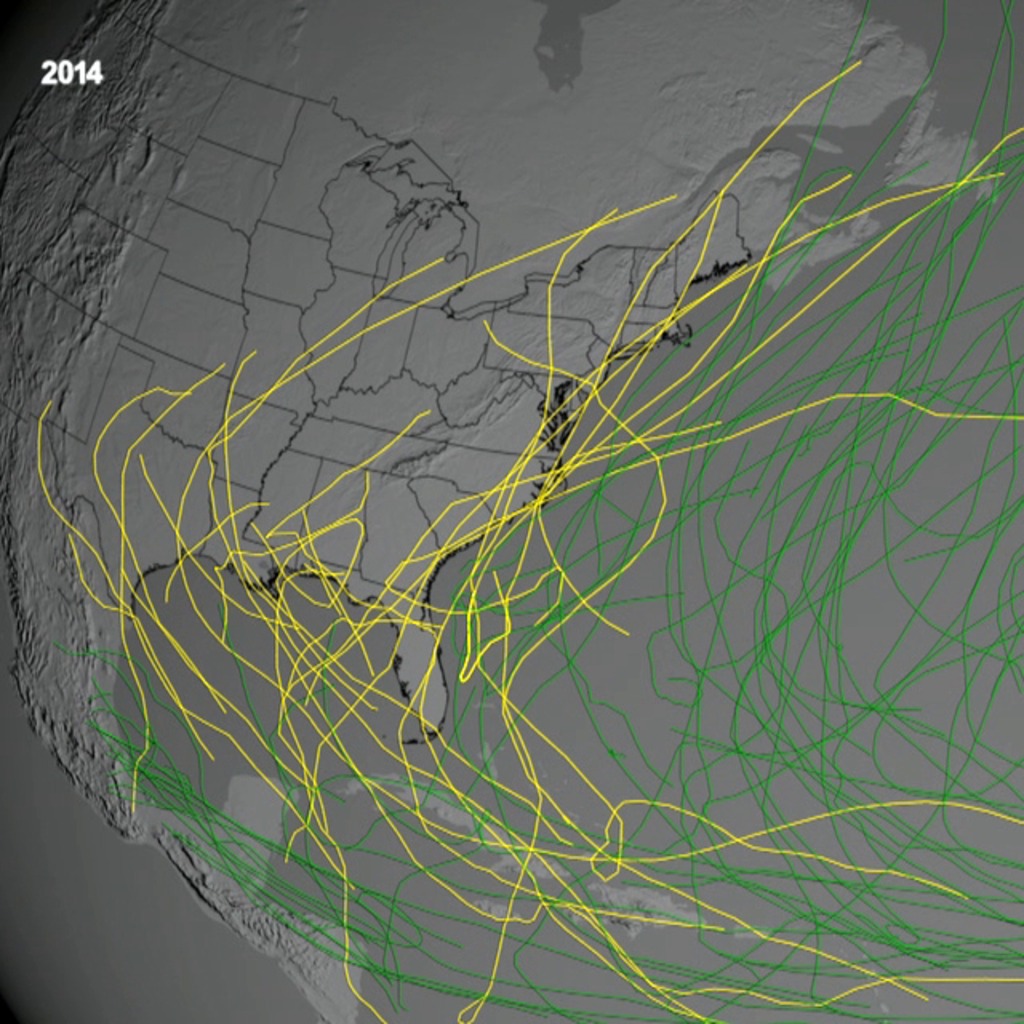
Hurricane tracks from 1980 through 2014. Green tracks did not make landfall in US; yellow tracks made landfall but were not major hurricanes at the time; red tracks made landfall and were major hurricanes.
This video is also available on our YouTube channel.
Statistacal analyses from hurricane track data back to 1850 indicate that for any particular Atlantic Hurricane season, there is approximately a 40% chance that a major hurricane (categrory 3 or higher) will make landfall in the continental United States. However, during the 9-year period from 2006 to 2014, no major hurricanes have made landfall.
These visualizations show hurricane tracks from 1980 through 2014. Green tracks are storms that did not make landfall in the continental US; yellow tracks are storms made landfall but were not category 3 or higher when they made landfall; and, red tracks are storms that made landfall and where category 3 or higher. A corresponding chart on the right accumulates the number and types of storms for each year. Notice the large gap in any red blocks between 2006 and 2014.

Background Earth layer
Tracks layer with alpha
Dates layer with alpha
Table layer with alpha
Storm tracks are shown from 2006 through 2014. During this period, no storms made landfall in the continental US that were category 3 or up.
Accumulated tracks (2006 through 2014) with alpha

Print resolution still of 2005 season

Print resolution still from 2006 through 2014, the major hurricane drought period

Print resolution still of 2014 season

Print resolution still of Atlantic hurricane categories table. Green blocks indicate storms that missed CONUS. Yellow blocks indicate storms that made landfall in CONUS, but were not category 3+. Red blocks indicate storms that made landfall in CONUS and where category 3+ at the time of landfall.

States that are hit by a hurricane that's category 3 or higher with alpha
Credits
Please give credit for this item to:
NASA's Scientific Visualization Studio
-
Animator
- Greg Shirah (NASA/GSFC)
-
Producers
- Jefferson Beck (USRA)
- Joy Ng (USRA)
-
Scientist
- Timothy Hall (NASA/GSFC GISS)
Release date
This page was originally published on Wednesday, May 13, 2015.
This page was last updated on Wednesday, May 3, 2023 at 1:49 PM EDT.
Series
This page can be found in the following series:Datasets used
-
ETOPO2 (2-minute Gridded Global Relief Data)
ID: 651 -
HURDAT2
ID: 879
Note: While we identify the data sets used on this page, we do not store any further details, nor the data sets themselves on our site.


