California Gets Slammed Again
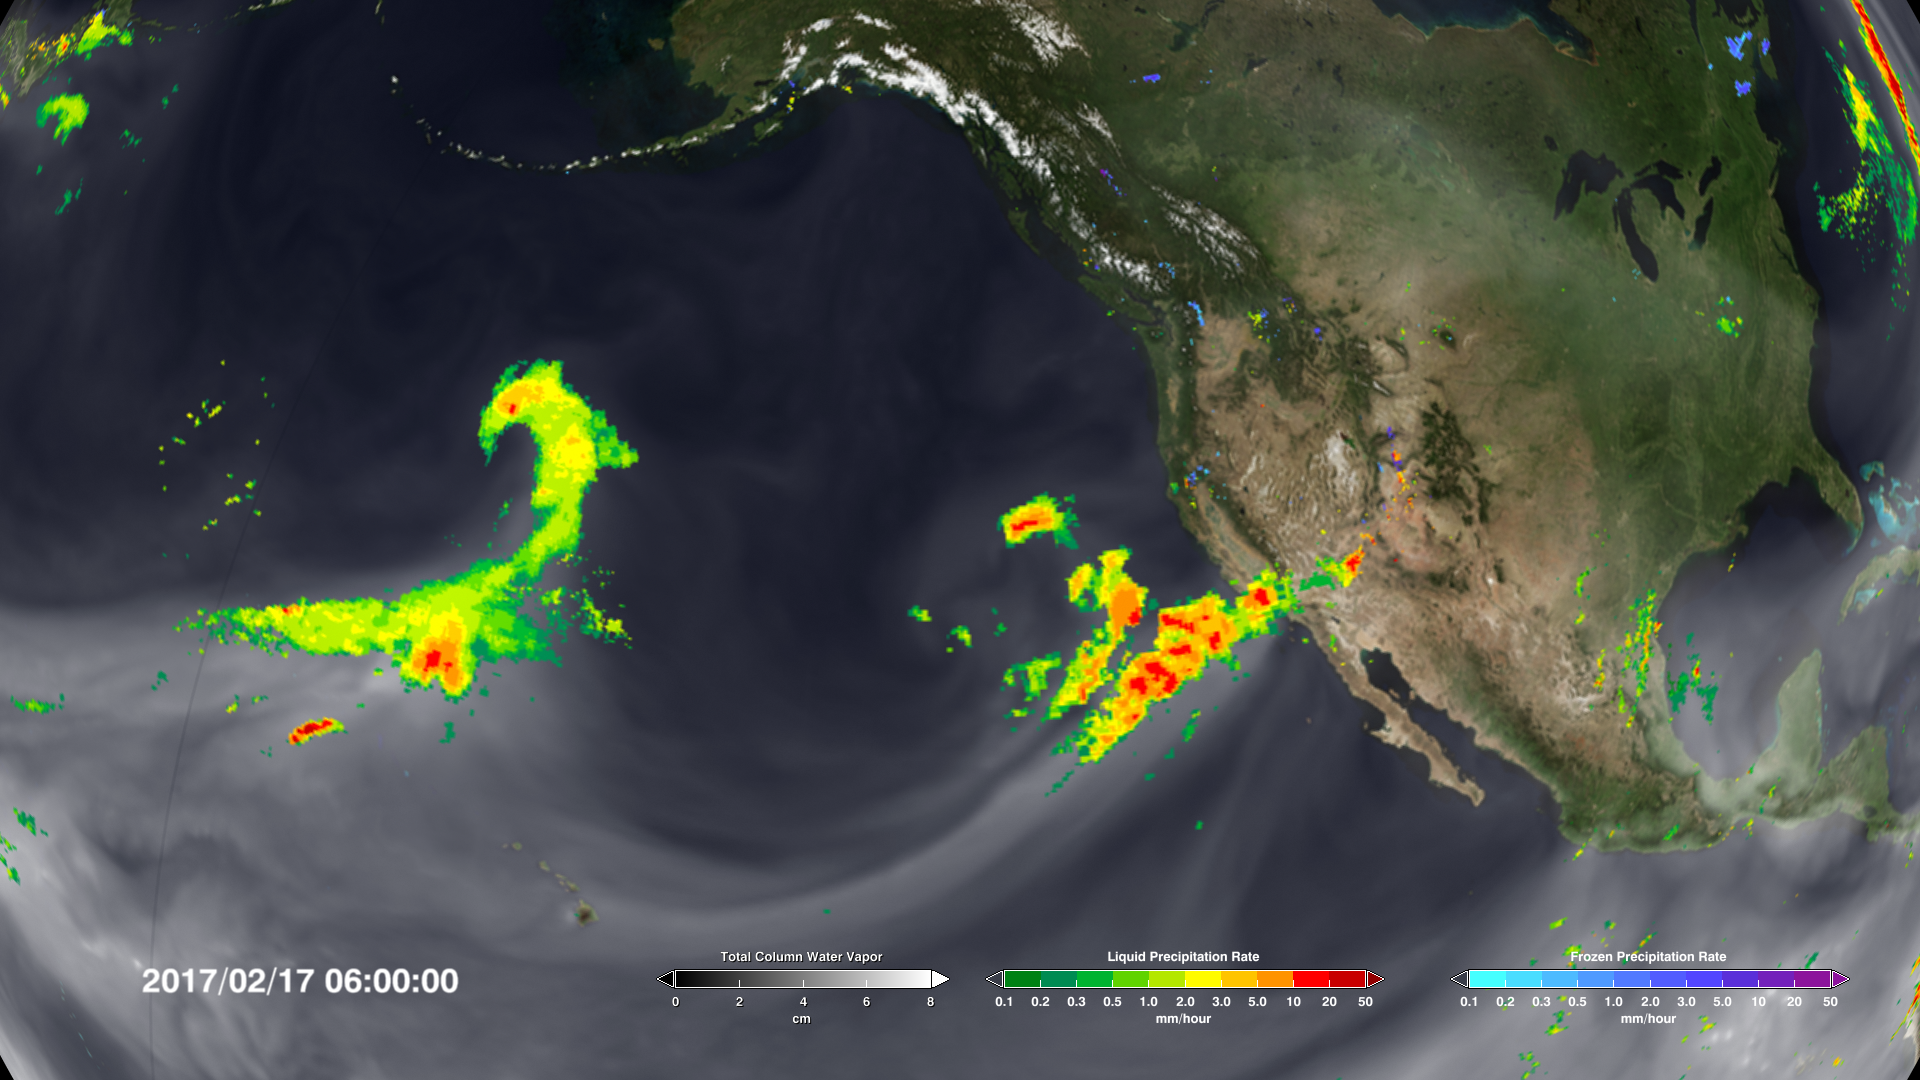
California has been experiencing a drought since 2012, but the first months of 2017 have brought some relief in the form of torrential rains. These rains have been brought to California in a series of atmospheric rivers, long narrow channels of water vapor in the atmosphere that reach from tropical latitudes to the coast of California. These channels bring rainfall to the state when they are disrupted by atmospheric conditions over California's eastern mountains. This visualization of atmospheric water vapor and precipitation during the first three weeks of February clearly show the successive atmospheric rivers and the resulting rainfall.
This visualization combines precipitation data from the Global Precipitation Measurement (GPM) mission's Integrated Multi-satellitE Retrievals (IMERG) and water vapor data from the Goddard Earth Observing System Model (GEOS). These datasets show the extreme rainfall that occurred in California during the first three weeks of February 2017 and the atmospheric rivers that transported the rain to the area.
This video is also available on our YouTube channel.
A global view of the IMERG precipitation and GEOS water vapor during the first three weeks of February 2017.
A north pole view of the IMERG precipitation and GEOS water vapor during the first three weeks of February 2017.

This is the color table for water vapor.

This is the color table for liquid precipitation.

This is the color table for frozen precipitation.

Triple color table for water vapor, liquid precipitation and solid precipitation
Credits
Please give credit for this item to:
NASA's Scientific Visualization Studio
-
Visualizer
- Horace Mitchell (NASA/GSFC)
-
Scientist
- Duane Waliser (NASA/JPL CalTech)
Release date
This page was originally published on Thursday, February 23, 2017.
This page was last updated on Sunday, February 2, 2025 at 10:32 PM EST.
Series
This page can be found in the following series:Datasets used
-
GEOS Atmospheric Model
ID: 665 -
IMERG
ID: 863This dataset can be found at: http://pmm.nasa.gov/sites/default/files/document_files/IMERG_ATBD_V4.4.pdf
See all pages that use this dataset
Note: While we identify the data sets used on this page, we do not store any further details, nor the data sets themselves on our site.
