Deep Star Maps 2020

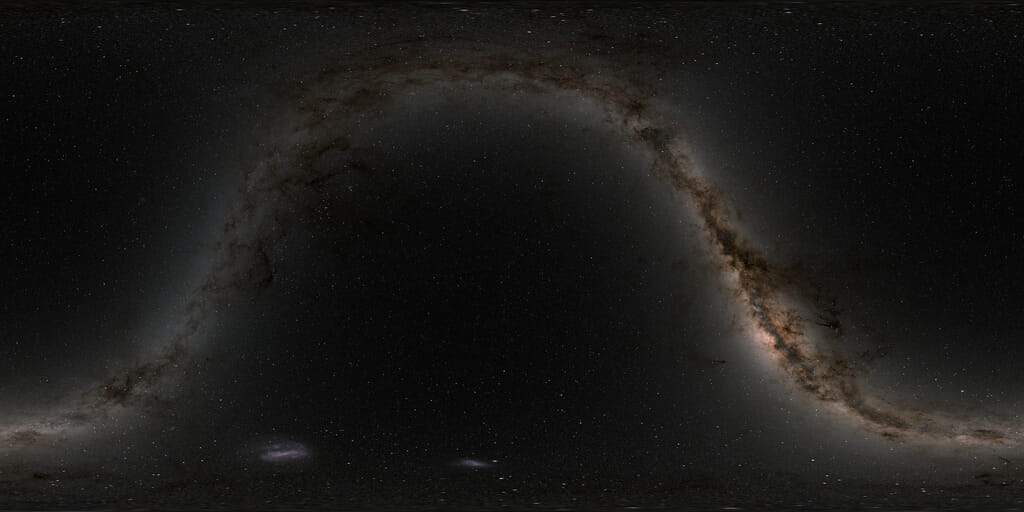
The star map in celestial coordinates, at five different resolutions. The map is centered at 0h right ascension, and r.a. increases to the left.
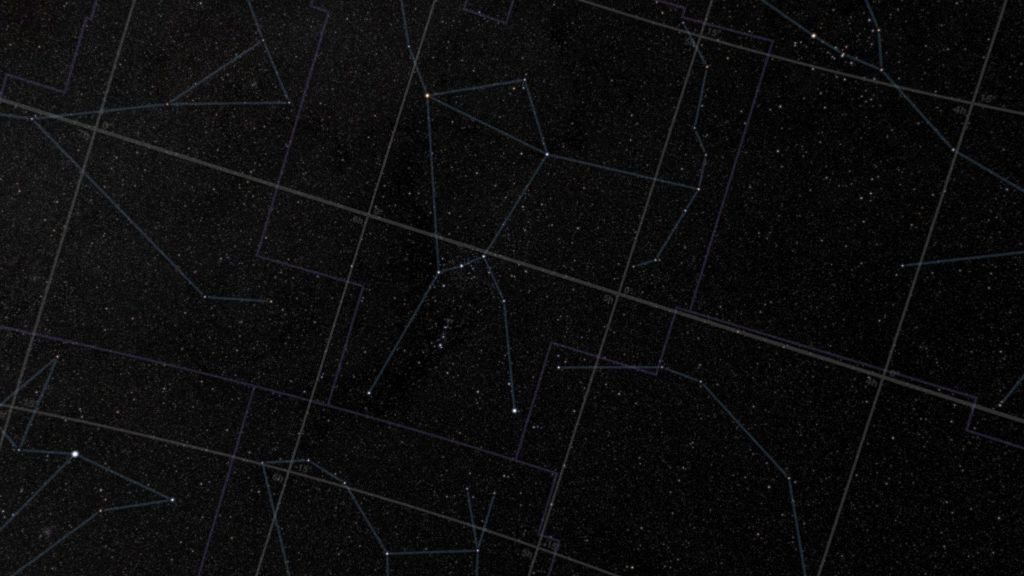
This set of star maps was created by plotting the position, brightness, and color of 1.7 billion stars from the Hipparcos-2, Tycho-2, and Gaia Data Release 2 star catalogs, with help from the Yale Bright Star Catalog, UCAC3, and the XHIP Hipparcos cross-reference. The constellation boundaries are those established by the International Astronomical Union in 1930. The constellation figures also come from the IAU, although they're not official.
The maps are presented in plate carrée projections using either celestial (ICRF/J2000 geocentric right ascension and declination) or galactic coordinates. They are designed for spherical mapping in animation software. The oval shapes near the top and bottom of the star maps are not galaxies. The distortion of the stars in those parts of the map is just an effect of the projection.
The celestial coordinate mapping will be the more useful one for 3D animation, since camera rotations in the software will correspond in a straightforward way to the right ascension and declination in astronomy references. The galactic coordinate mapping is probably better for 2D animation and compositing. It also works as a standalone image showing the edge-on view of our home galaxy, from the inside. Update: The galactic images were replaced on January 4, 2021. The original images used ICRF/J2000 coordinates in a galactic coordinate transformation meant for B1950. The new images use the transformation described in the Hipparcos and Gaia documentation.
The boundary, figure, and grid images are conventional grayscale TIFF files. The star maps are in OpenEXR's half-float format, which provides higher dynamic range in a linear colorspace while easily accommodating very large files. Most 3D animation and HDR image processing software can read OpenEXR.
Catalog Completeness
Hipparcos-2 provided the data for stars brighter than magnitude 8.0. To check HIP2's completeness, it was compared with the Yale Bright Star Catalog by matching positions, by using the XHIP cross-reference catalog, and by consulting the SIMBAD database.Of the 9096 stars in Yale, about one hundred have no matching Henry Draper ID in HIP2. Most of these are the second members of double or multiple stars that are represented in HIP2 as a single entry, and their omission has no visible effect on the star map. Another few are highly variable stars listed in Yale at their brightest magnitude, even though this magnitude is atypical. An example is T Coronae Borealis, the Blaze Star, which reached the magnitude listed in Yale only in 1866 and 1946; it normally hovers around magnitude 10.
The remaining 18 stars can be considered genuinely missing:
| HR | Mag | Comment |
|---|---|---|
| 4210 | 4.30 | Eta Car |
| 4375 | 4.41 | Xi UMa A |
| 4374 | 4.87 | Xi UMa B |
| 5978 | 4.77 | Xi Sco A |
| 5977 | 5.07 | Xi Sco B |
| 4729 | 4.86 | 256 Cru, 90" from Acrux (Alp Cru) |
| 2322 | 5.98 | |
| 5343 | 5.98 | CN Boo, 17' from Arcturus (Alp Boo) |
| 2950 | 6.02 | 12' from Procyon (Alp CMi) |
| 1982 | 6.15 | AK Lep, 97" from Gam Lep |
| 5034 | 6.18 | 61" from J Cen |
| 2366 | 6.20 | HIP 31067, omitted from HIP2 |
| 4619 | 6.37 | 3.6' from Del Cen |
| 1704 | 6.37 | 15' from Rigel (Bet Ori) |
| 6660 | 6.38 | part of M7 in Sco |
| 6263 | 6.45 | part of NGC 6231 in Sco |
| 2341 | 6.51 | 10' from Canopus (Alp Car) |
| 6848 | 6.84 | part of M24 in Sgr |
These were added to the star maps. Some are relatively near very bright stars that may have made the measurement of their dimmer neighbor by Hipparcos problematic. The magnitude of Eta Carina is an estimate based on the AAVSO Light Curve Generator as of July 2020. All other data was taken from Yale.
Missing stars at fainter magnitudes are in general much less visually apparent. The completeness of Tycho-2, used for stars with visual magnitudes between 8.0 and 11.5, was assumed. And since data in the Hipparcos and Tycho catalogs share the same provenance, there's less concern about drawing stars twice or losing them in the cracks at the crossover magnitude. Gaia DR2, however, has two obvious data holes centered at r.a. 97.9°, dec. 57.5° and 34.2°, 22.1°. These were filled in using stars from UCAC3.
Star Colors
The colors of the stars from both Hipparcos-2 and Tycho-2 were based on the B-V color index. This requires a mapping from B-V to effective temperature, Teff. In previous versions of this product, the mapping used a high-degree polynomial fit, but it was found that this fit was calculated using a relatively narrow range of B-V. Outside this range, the fit behaved poorly, producing a number of unrealistically red stars. For this version, the mapping was a slightly modified version of a function ascribed to F. Ballesteros.The spectrum of light emitted by a blackbody with a temperature Teff can in turn be mapped to an RGB triple, yielding the star color. See Mitchell Charity's What color is a blackbody?, which was used for the present work. In common with Charity, the modest goal here was
not-completely-boguscolors.
The colors of Gaia DR2 stars were taken from the fields called G, GRP, GBP, scaled by
color balancefactors estimated by eye. See this article from the Gaia team for more information about the passbands for these three measurements. Roughly a quarter of the DR2 stars lack GRP, GBP values, and those are set to white.
Tour
The animation demonstrates the use of the maps in a tour of the sky. The tour starts at W-shaped Cassiopeia, then heads south through Perseus to the winter constellation of Orion the Hunter and the Hyades and Pleiades star clusters in Taurus. It moves southeast past Orion's canine companion and its star, Sirius, brightest in the sky, eventually pausing at the rich southern hemisphere portion of the Milky Way in Carina and Crux, the Southern Cross.East of the Cross, in Centaurus, is the binary star Alpha Centauri, at 4.4 light-years the naked-eye star system nearest to the Sun. Also visible as a fuzzy spot near the top of the frame is the globular cluster Omega Centauri. The number of stars used to draw the star maps is large enough to reveal many globular and open star clusters as well as the Large and Small Magellanic Clouds.
After passing near the celestial south pole, the tour moves north along the Milky Way to the center of our galaxy near the teapot in Sagittarius. The tour veers northwest from there, finally stopping at the familiar Big Dipper or Plough asterism in Ursa Major.
This is an update to entry 3895.

A celestial coordinate grid.

Official IAU constellation bounds in celestial coordinates.

Constellation figures in celestial coordinates.

The Milky Way background in celestial coordinates. This is a version of the star map that omits the bright (Hipparcos and Tycho) stars.

The bright star (Hipparcos and Tycho) foreground in celestial coordinates.

The star map in galactic coordinates. The map is centered at 0° longitude, and longitude increases to the left. Images updated 4 Jan 2021 to correct a coordinate transformation error.

Official IAU constellation boundaries in galactic coordinates. Images updated 4 Jan 2021 to correct a coordinate transformation error.

Constellation figures in galactic coordinates. Images updated 4 Jan 2021 to correct a coordinate transformation error.

The Milky Way background in galactic coordinates. This is a version of the star map that omits the bright (Hipparcos and Tycho) stars.

The bright star (Hipparcos and Tycho) foreground in galactic coordinates.
A short tour of the sky demonstrating the use of the star maps.
Credits
Please give credit for this item to:
NASA/Goddard Space Flight Center Scientific Visualization Studio. Gaia DR2: ESA/Gaia/DPAC. Constellation figures based on those developed for the IAU by Alan MacRobert of Sky and Telescope magazine (Roger Sinnott and Rick Fienberg).
-
Animator
- Ernie Wright (USRA)
-
Technical support
- Laurence Schuler (ADNET Systems, Inc.)
- Ian Jones (ADNET Systems, Inc.)
Release date
This page was originally published on Wednesday, September 9, 2020.
This page was last updated on Monday, January 6, 2025 at 12:18 AM EST.
Datasets used
-
Hipparcos Catalogue [Hipparcos: Telescope]
ID: 549This dataset can be found at: http://www.rssd.esa.int/index.php?project=HIPPARCOS
See all pages that use this dataset -
Tycho Catalogue (Tycho 2 Catalogue) [Hipparcos: Telescope]
ID: 550This dataset can be found at: http://archive.eso.org/ASTROM/
See all pages that use this dataset -
UCAC3 (Catalog) [U.S. Naval Observatory: Third CCD Astrograph]
ID: 724 -
Gaia DR2 (Data Release 2) [Gaia]
ID: 1090Catalog of 1.7 billion stars brighter than magnitude 21.
Credit: Gaia team/ESA
See all pages that use this dataset
Note: While we identify the data sets used on this page, we do not store any further details, nor the data sets themselves on our site.

