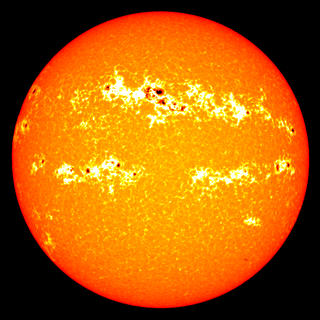
Faculae and Sunspots at Solar Maximum and Solar Minimum
Movie of SDO/AIA 1700 angstrom imagery, collected near solar maximum (April 2014). Note the small dark regions (sunspots) and the brighter speckled regions (faculae) around them.
The solar 'constant', the amount of energy received from the Sun during the course of the 11 year solar cycle, is not strictly constant. There is small variation during the course of the cycle due to the change in solar activity.
Sunspots form in regions with stronger magnetic fields on the photosphere and appear dark against the hotter solar surface, even though they are still quite hot. Faculae are extended regions that tend to form around sunspots and are hotter, and brighter, than the photosphere. Faculae are barely visible in solar imagery taken in visible light, but are more obvious in specific wavelengths (such as 1700 Angstroms used here) as the brighter speckled regions around many of the sunspots.
The hotter and more extended area of the faculae add more to the solar energy output than is taken away by the cooler and smaller sunspots, yielding a slight net increase in the solar luminosity around solar maximum.
Movie of SDO/HMI imagery, collected near solar maximum (April 2014). The small dark regions (sunspots) are readily visible, but the brighter faculae are generally only visible near the solar limb where 'limb darkening' provides sufficient constrast for them to stand out.
Movie of SDO/AIA 1700 angstrom imagery, collected near solar minimum (April 2019). Even near solar minimum, sunspots can still form. Brighter speckled faculae surround it.
Movie of SDO/HMI imagery, collected near solar minimum (April 2019). Even near solar minimum, sunspots can still form. Brighter speckled faculae are barely visible around it.
4Kx4K image sequence of SDO/AIA 1700 angstroms near solar maximum, April 2014.
4Kx4K image sequence of SDO/HMI Intensity near solar maximum, April 2014.
4Kx4K image sequence of SDO/AIA 1700 angstroms near solar minimum, April 2019.
4Kx4K image sequence of SDO/HMI Intensity near solar minimum, April 2019.
Credits
Please give credit for this item to:
NASA's Scientific Visualization Studio
-
Visualizer
- Tom Bridgman (Global Science and Technology, Inc.)
-
Producer
- Joy Ng (USRA)
-
Technical support
- Laurence Schuler (ADNET Systems, Inc.)
- Ian Jones (ADNET Systems, Inc.)
Release date
This page was originally published on Tuesday, January 18, 2022.
This page was last updated on Monday, January 6, 2025 at 12:18 AM EST.
Missions
This page is related to the following missions:Datasets used
-
SDO Continuum (Continuum) [SDO: HMI]
ID: 674 -
AIA 1700 (1700 Filter) [SDO: AIA]
ID: 710This dataset can be found at: http://jsoc.stanford.edu/
See all pages that use this dataset
Note: While we identify the data sets used on this page, we do not store any further details, nor the data sets themselves on our site.
