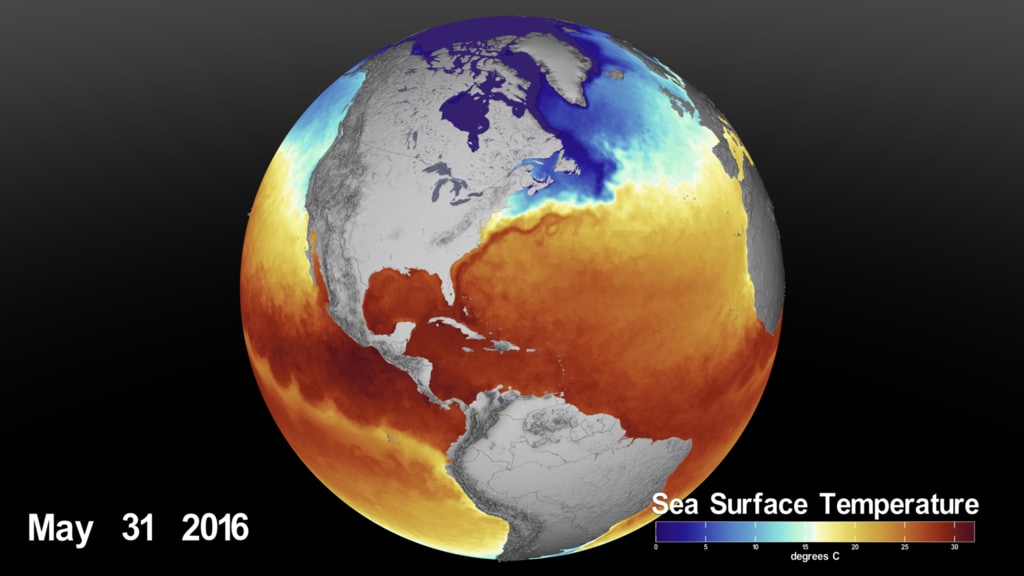
Sea Surface Temperature (SST) - Near Real Time
An equirectangular view of sea surface temperature (SST) data for the past two and half years, updated daily to include the latest available data.
This visualization shows Sea Surface Temperature (SST) data from the Jet Propulsion Laboratory (JPL) Multi-scale Ultra-high Resolution (MUR) Sea Surface Temperature Analysis. The analysis data is near-real-time (one day latency) and the visualization is updated daily to include the latest available data.
Data available here: https://podaac.jpl.nasa.gov/dataset/MUR-JPL-L4-GLOB-v4.1

An equirectangular view of the most recent sea surface temperature (SST) data available (still image).
An equirectangular view of sea surface temperature (SST) data for the past two and half years, updated daily to include the latest available data. This version has no datestamp.

An equirectangular view of the most recent sea surface temperature (SST) data available (still image). This version has no datestamp.
A view of sea surface temperature (SST) data for the past two and half years, updated daily to include the latest available data. This version is a robinson projection.

A view of the most recent sea surface temperature (SST) data available (still image). This version is a robinson projection.
A view of sea surface temperature (SST) data for the past two and a half years, updated daily with the latest available data. This version uses a Robinson projection and includes a diagonal line pattern marking regions where the temperature is above 82°F. Meteorologists generally agree that SSTs above 82°F (27.8°C) intensify and sustain hurricanes, cyclones, and typhoons.

A view of the most recent sea surface temperature (SST) data available. This version uses a Robinson projection. It also includes a diagonal line pattern marking regions where the temperature is above 82°F. Meteorologists generally agree that SSTs above 82°F (27.8°C) intensify and sustain hurricanes, cyclones, and typhoons. (Still image)

A view of the most recent sea surface temperature (SST) data available. This version uses a Robinson projection. It also includes a diagonal line pattern marking regions where the temperature is above 82°F. Meteorologists generally agree that SSTs above 82°F (27.8°C) intensify and sustain hurricanes, cyclones, and typhoons. (Still image). This version includes a color bar legend.

Sea Surface Temperature color bar. Color range is light blue - white - orange - red. -5 to 35 degrees Celsius

Sea Surface Temperature color bar. Color range is light blue - white - orange - red. 23 to 95 degrees Fahrenheit.

Sea Surface Temperature color bar. Color range is light blue - white - orange - red. -5 to 35 degrees Celsius. Spanish version.
Credits
Please give credit for this item to:
NASA's Scientific Visualization Studio
-
Visualizers
- Kel Elkins (USRA)
- Greg Shirah (NASA/GSFC)
-
Technical support
- Laurence Schuler (ADNET Systems, Inc.)
- Ian Jones (ADNET Systems, Inc.)
Release date
This page was originally published on Monday, May 8, 2023.
This page was last updated on Friday, April 25, 2025 at 7:30 PM EDT.
Series
This page can be found in the following series:Datasets used
-
MUR SST (Multi-scale Ultra-high Resolution (MUR) Sea Surface Temperature (SST) Analysis)
ID: 845
Note: While we identify the data sets used on this page, we do not store any further details, nor the data sets themselves on our site.
