NASA’s TEMPO Instrument Air Quality Data Now Publicly Available
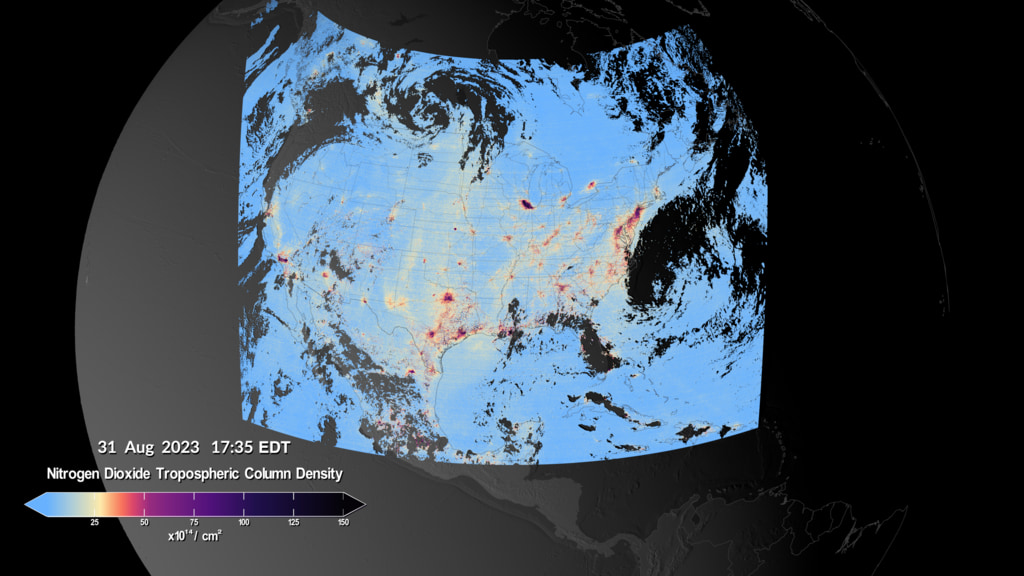
The TEMPO instrument measured elevated levels of nitrogen dioxide (NO2) from a number of different areas and emission sources throughout the daytime on March 28, 2024. Yellow, red, purple, and black clusters represent increased levels of pollutants from TEMPO’s data and show drift over time.
Air pollution data on a neighborhood scale are now available in near real-time from NASA's Atmospheric Science Data Center (ASDC) at Langley Research Center in Hampton, Virginia. The data come from NASA’s TEMPO instrument (Tropospheric Emissions: Monitoring of Pollution), which gathers hourly daytime scans of the atmosphere over North America from the Atlantic Ocean to the Pacific Coast and from roughly Mexico City to central Canada. The instrument is an advanced spectrometer that detects pollution by observing how sunlight is absorbed and scattered by gases and particles in the troposphere, the lowest layer of Earth’s atmosphere.
Measurements by TEMPO include air pollutants such as nitrogen dioxide, formaldehyde, and ground-level ozone.
Determining sources of air pollution can be difficult as smoke from wildfires or pollutants from industry and traffic congestion drift on winds. TEMPO should make it easier to trace the origin of some pollutants.
TEMPO was built by BAE Systems, Inc., Space & Mission Systems (formerly Ball Aerospace) and flies aboard the Intelsat 40e satellite built by Maxar Technologies. The TEMPO Ground System, including the Instrument Operations Center and the Science Data Processing Center, are operated by the Smithsonian Astrophysical Organization (SAO), part of the Center for Astrophysics | Harvard & Smithsonian in Cambridge, Massachusetts.
NO2 levels are elevated along major traffic corridors including I-35 in Texas and I-10 in Arizona with the highest levels between 9:00 a.m. and 12:00 p.m. Elevated NO2 levels are shown across cities including Houston, Dallas, San Antonio, El Paso, and Memphis, with the highest levels persisting across Houston from morning to evening.
High NO2 levels associated with prescribed burns are seen popping up across East Texas, Oklahoma, Louisiana, Arkansas, and Mississippi, beginning around 1:00 p.m. and extending into the evening.
TEMPO observes the northerly transport of NO2 from the Permian basin, a large oil and natural gas producing area spanning parts of West Texas and southeastern New Mexico, with the highest levels measured during the morning over the basin. NO2 plumes from coal-fired power plants are visible in the rural areas far west and northwest of Houston and far east of Dallas between 8:00 a.m. and 2:00 p.m.
Credits
Please give credit for this item to:
NASA's Scientific Visualization Studio
Data provided by the Smithsonian Astrophysical Observatory at the Center for Astrophysics | Harvard & Smithsonian.
-
Visualizers
- Trent L. Schindler (USRA)
- Kel Elkins (USRA)
- Cindy Starr (Global Science and Technology, Inc.)
-
Technical support
- Laurence Schuler (ADNET Systems, Inc.)
- Ian Jones (ADNET Systems, Inc.)
-
Scientists
- Caroline Nowlan (Center for Astrophysics | Harvard & Smithsonian)
- Xiong Liu (Center for Astrophysics | Harvard & Smithsonian)
- Aaron Naeger (NASA/MSFC)
Release date
This page was originally published on Thursday, May 30, 2024.
This page was last updated on Friday, April 11, 2025 at 10:51 AM EDT.
Datasets used
-
Nitrogen Dioxide [TEMPO]
ID: 1188Credit: Data provided by the Smithsonian Astrophysical Observatory at the Center for Astrophysics | Harvard & Smithsonian.
This dataset can be found at: https://tempo.si.edu/
See all pages that use this dataset
Note: While we identify the data sets used on this page, we do not store any further details, nor the data sets themselves on our site.
