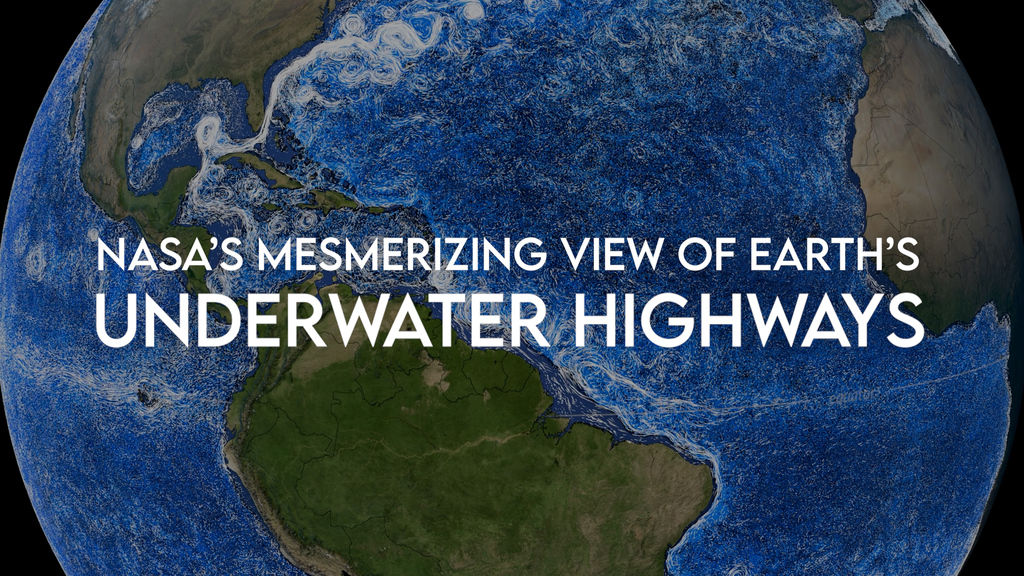
Perpetual Ocean 2: Western Boundary Currents
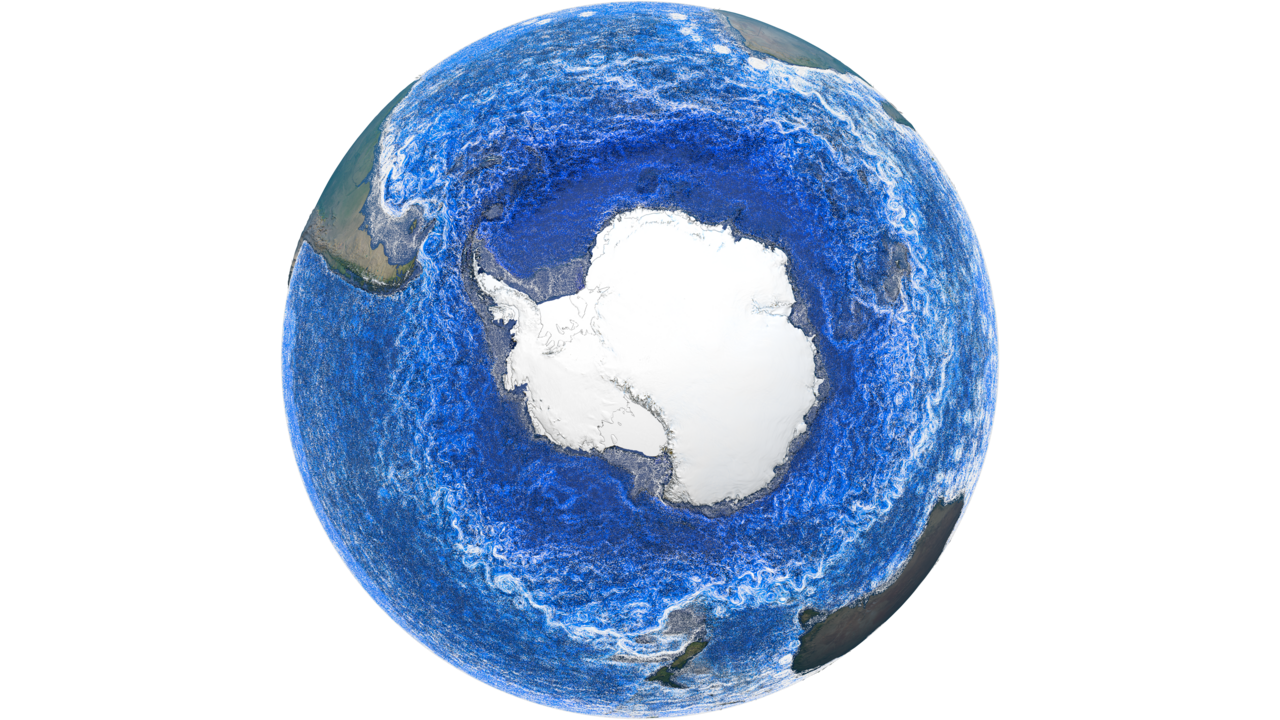
This is the 'beauty shot version' of Perpetual Ocean 2: Western Boundary Currents. The visualization starts with a rotating globe showing ocean currents. The camera then zooms into the Kuroshio current, moves over the Indian Ocean to the Agulhas Current, then over to the Gulf Stream.
The colors used to color the flow in this version where chosen to provide a pleasing look. The flows from the surface down to 600 meters deep are all white. Flows below 600 meters depth use the blue-cyan-white color table below.
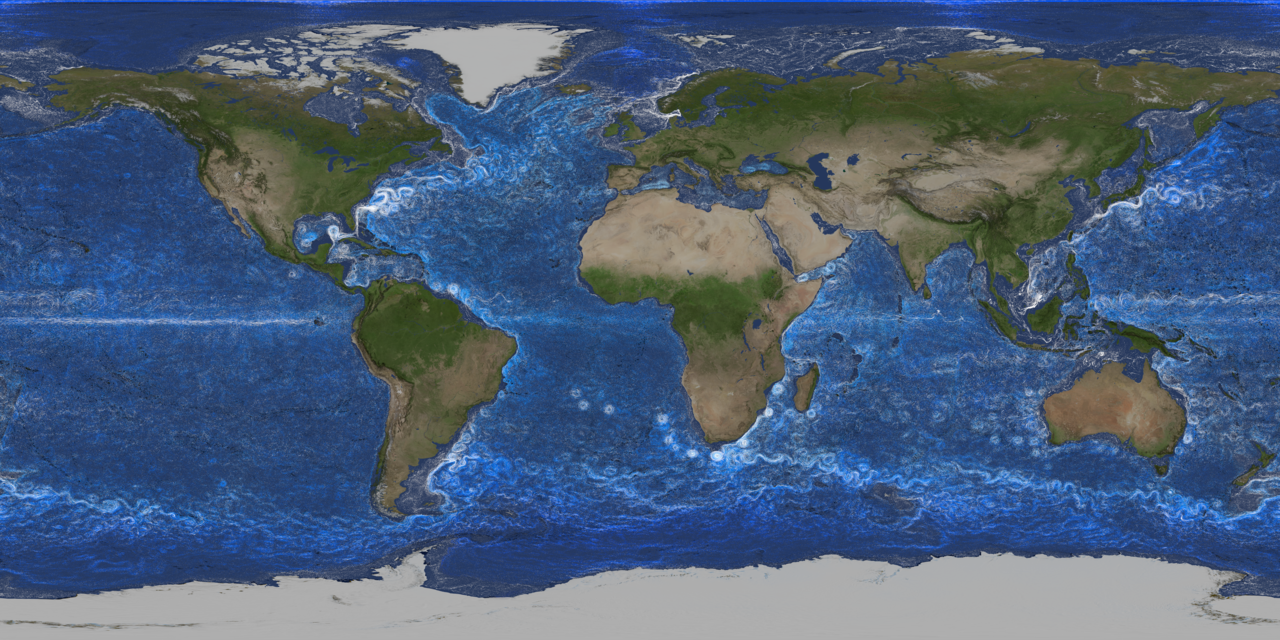
This is a visualization of ocean currents around the world. NASA’s ocean model, Estimating the Circulation and Climate of the Ocean (ECCO)), is used to visualize the currents. The ECCO ocean circulation model incorporates observations from spacecraft, buoys, and other in situ measurements to keep the model accurate. ECCO is a joint project between NASA/JPL, MIT, and UT Austin. The model output used here is from ECCO-2 and covers the years 2021-2023.
In 2011, we used ECCO2 to create a visualization called Perpetual Ocean. Perpetual Ocean continues to be extremely popular, but it only shows ocean currents on the surface. In this new visualization, we use the ocean’s 3D velocity field to visualize some of the strongest ocean currents. We release virtual particles in the ocean and allow them to move with the ocean’s three dimensional velocity field. Each particle has a trail to better see its direction of movement. The particles initialized above 600 meters in depth have a trail length of 3 days, those initialized deeper than 600 meters have a trail length of 6 days. The particle trails help identify the strongest currents in the world that are squeezed in narrow belts on the western side of each ocean basin. These are called western boundary currents. The looping meanders in the boundary currents sometimes form turbulent rings (eddies) that can trap cold or warm waters in their centers and then separate from the main flow (see 2:30 of temperature version for an example for trapped warm water). In general, the western boundary currents are warm and salty.
The visualization starts from a global rotating view before slowing down to see the Western Boundary Current along the western edge of the Pacific Ocean along the coasts of Australia, and Asia. We zoom in to show the Kuroshio Current off the coast of Japan. Along the Japanese coast, the current exhibits large meanders that can persist for many months in more or less the same location. The Kuroshio current has a temperature range of 20 to 25 °C. Its salinity can change seasonally with an average value of 34.5.
We then zoom out and move over the Indian Ocean The Indian Ocean exhibits large variations in salinity. The western Indian Ocean is quite salty (>36) due to overflow inputs from marginal Seas (e.g. Persian Gulf and Red Sea). The East Indian Ocean is fresher (~35) due to river inputs from India. The Indonesian Throughflow is quite fresh (33-34) and carries freshwater from the Pacific. We then zoom into the southern tip of Africa. The exchange of water from the Indian Ocean to the South Atlantic occurs here. The Agulhas Current is another Western Boundary current following the slope of the continental shelf closely. The continental shelf along the east coast of southern Africa is quite narrow and steep. This sloping topography stabilizes the Agulhas Current so that it shows no wide meanderings of the type familiar in other boundary currents such as the Kuroshio. The Agulhas Current overshoots the African continent, moving into the South Atlantic. Then retroflects back to the Indian Ocean. At the retroflection, shedding of warm (20 to 25 °C ) and salty (~35.5) rings happens. The eddies detached from the current have a lifetime of more than 2 years traveling across the south Atlantic ocean. These eddies are referred to as Agulhas Rings.
Another Western Boundary Current, called the Gulf Stream comes into view along the east coast of North America. The Gulf Stream forms at the Florida Straits. It’s one of the fastest currents on Earth with surface speed of up to 2.5 meters per second. In the Gulf stream, cold cores (mostly anticyclonic ones) form when the Gulf Stream meanders eastward leaving the coast of North America (off Cape Hatteras in North Carolina). The eddy diameters can be as large as 1000 km. Zooming into the Gulf Stream, we can see that the warm surface water (>25°C) moves poleward (white particle trails). The Gulf Stream is generally the warmest and saltiest western boundary current. There’s a return current underneath at depth below 500m (the blue particle trails) moving southward carrying cold waters from the pole.
The loop currents in the Gulf of Mexico are very large eddies persisting in the Gulf. They bring the warm and highly saline Caribbean water into the Gulf. As we zoom out from the Gulf Stream, the salinity version shows that the Atlantic is generally much more salty than the Pacific.
Models like ECCO-2 help scientists to understand the characteristics of these currents better and ultimately understand how heat is transported globally in the Ocean.
This is the 'temperature version' of Perpetual Ocean 2: Western Boundary Currents. The visualization starts with a rotating globe showing ocean currents. The camera then zooms into the Kuroshio current, moves over the Indian Ocean to the Agulhas Current, then over to the Gulf Stream.
The colors used to color the flow in this version vary from dark blue to purple to orange to yellow. See the colorbar below specified for the 'temperature version'.
This is the 'salinity version' of Perpetual Ocean 2: Western Boundary Currents. See the colorbar below specified for the 'salinity version'.
This is the '600 meter and deeper beauty version' showing only ocean currents below 600 meters in the Gulf Stream region. This is intended for fading in post production to better see the counter current. This uses the same color table as the 'beauty shot version'.
This is an overlay layer of the equator line and label to enable the enhancement of the equator in post production. It is rendered with a hold-out matte for the earth.
Optional sea ice only layer.
Layer with land only
Land mask layer. This is intended to be used with the land layer which has changing snow.
This is a dates only layer that corresponds to the 'beauty shot version' and 'temperature version' on this page. Dates range from 15 Jan 2021 to 25 Dec 2023.

This color bar is applied to the 'salinity version' of the ocean currents. The colors range from greenish-cyan to gray to orange to red. Values range from 33 to 36 salinity units.
This is the color bar applied to the 'beauty shot version' and the '600 meters and deeper version' of the ocean currents. In the 'beauty shot version', all currents above 600 meters depth are white. All currents at 600 meters and below use this blue-cyan-white colorbar below with value ranging from -3 to 22 celcius.
Color bar applied to the 'temperature version' of the ocean currents. Colors range from blue to purple to yellow in degrees Celcius from 0 to 25.
Credits
Please give credit for this item to:
NASA's Scientific Visualization Studio
-
Visualizers
- Greg Shirah (NASA/GSFC)
- Horace Mitchell (NASA/GSFC)
-
Technical support
- Laurence Schuler (ADNET Systems, Inc.)
- Ian Jones (ADNET Systems, Inc.)
-
Scientists
- Atousa Saberi (NASA/GSFC)
- Josh Willis (JPL)
-
Producer
- Kathleen Gaeta (Advocates in Manpower Management, Inc.)
Release date
This page was originally published on Thursday, February 27, 2025.
This page was last updated on Wednesday, April 23, 2025 at 10:38 AM EDT.
Series
This page can be found in the following series:Datasets used
-
BMNG (Blue Marble: Next Generation) [Terra and Aqua: MODIS]
ID: 508Credit: The Blue Marble data is courtesy of Reto Stockli (NASA/GSFC).
This dataset can be found at: http://earthobservatory.nasa.gov/Newsroom/BlueMarble/
See all pages that use this dataset -
ECCO2 (ECCO2 High Resolution Ocean and Sea Ice Model)
ID: 707 -
ETOPO-30
ID: 1216NOAA Earth TOPOgraphy global relief model 30 arc-second resolution (ETOPO-30): The ETOPO Global Relief Model integrates topography, bathymetry, and shoreline data from regional and global datasets to enable comprehensive, high resolution renderings of geophysical characteristics of the earth’s surface. The model is designed to support tsunami forecasting, modeling, and warning, as well as ocean circulation modeling and Earth visualization.
This dataset can be found at: https://www.ncei.noaa.gov/products/etopo-global-relief-model
See all pages that use this dataset
Note: While we identify the data sets used on this page, we do not store any further details, nor the data sets themselves on our site.
Related
- ID: 14745
Alternate Versions
- ID: 5529
 Visualization
 - ID: 5505
 Visualization
Used as a Source In
- ID: 14745