2024 Atlantic Hurricane Season
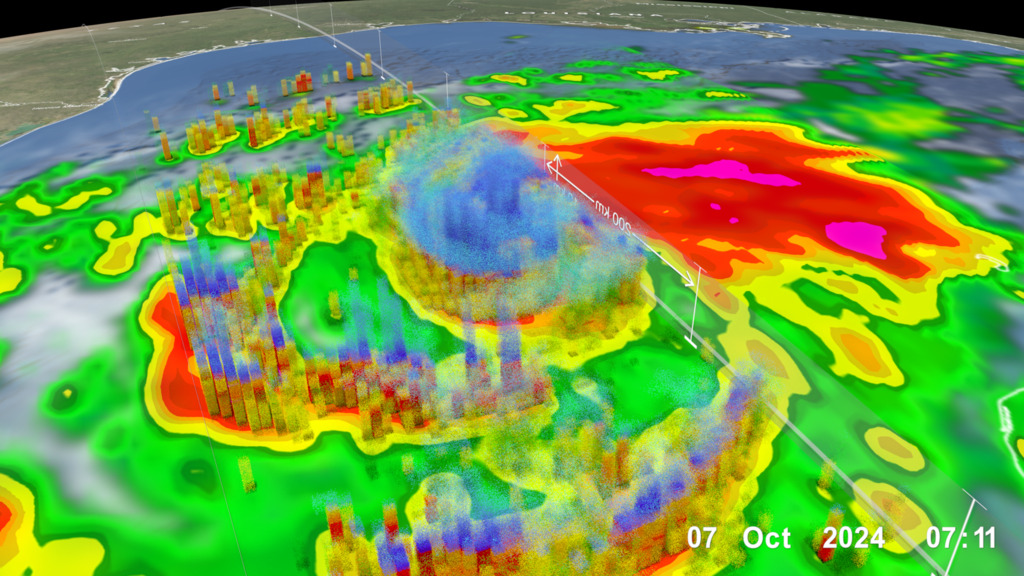
Data visualization of the 2024 hurricane season where time is sped up during non-hurricane activity.
The 2024 Atlantic hurricane season was notably active, featuring 18 named storms, 11 hurricanes, and 5 major hurricanes. This level of activity aligns with pre-season forecasts that anticipated an above-normal season, largely due to exceptionally warm sea surface temperatures (SSTs) in the tropical Atlantic and Caribbean Sea.
Sea Surface Temperatures (SSTs) from the Multi-scale Ultra-high Resolution (MUR) analyses.

Sea Surface Temperature (SST) colorbar focusing primarily on temperatures between 20 degrees Celsius to 30 Celsius. Hurricanes tend to form over the warm tropical oceans where the SST is warmer than ~26.5 C (~80 F) depicted in colors from yellow to red.
Sea surface temperatures play a critical role in hurricane development, as warmer waters provide the energy necessary for storm formation and intensification. In 2024, SSTs in the tropical Atlantic were at near-record warm levels during the peak of the hurricane season. These anomalously high temperatures contributed to the formation of several intense storms, including Hurricane Beryl, which became the earliest forming Cat 5 on record, causing significant damage in Grenada and Jamaica, as well as hitting the U.S. Gulf Coast.
2024 Hurricane Season only showing clouds and storm tracks.
The season was also marked by rapid intensification events, exemplified by Hurricane Milton, which escalated from a Category 1 to a Category 5 storm at near-record speed before impacting Florida’s Gulf Coast. Such rapid intensification is often linked to elevated SSTs, which provide the additional heat energy required for storms to strengthen quickly.
2024 Hurricane Season only showing IMERG precipitation and storm tracks.

Liquid precipitation rate in milimeters per hour

Frozen precipitation rate in milimeters per hour
The estimated financial losses due to the 2024 hurricane season were around $200 billion, making it one of the costliest hurricane seasons on record. Notably, Hurricane Helene was the deadliest U.S. storm since Katrina in 2005, reaching as far inland as North Carolina, causing catestrophic flooding to the western portions of North Carolina.
Full length data visualization of the 2024 Hurricane Season showing SSTs, IMERG precipitation, CPC clouds, and storm tracks together.
In summary, the 2024 Atlantic hurricane season was characterized by above-average activity and significant impacts, heavily influenced by unusually warm sea surface temperatures that fueled storm development and intensification.
Credits
NASA's Scientific Visualization Studio
-
Data visualizers
- Alex Kekesi (Global Science and Technology, Inc.)
- Greg Shirah (NASA/GSFC)
- Kel Elkins (USRA)
-
Technical support
- Laurence Schuler (ADNET Systems, Inc.)
- Ian Jones (ADNET Systems, Inc.)
Release date
This page was originally published on Tuesday, February 11, 2025.
This page was last updated on Monday, February 17, 2025 at 10:42 AM EST.
Series
This page can be found in the following series:Datasets used
-
CPC (Climate Prediction Center) Cloud Composite
ID: 600Global cloud cover from multiple satellites
See all pages that use this dataset -
MUR SST (Multi-scale Ultra-high Resolution (MUR) Sea Surface Temperature (SST) Analysis)
ID: 845 -
IMERG
ID: 863This dataset can be found at: http://pmm.nasa.gov/sites/default/files/document_files/IMERG_ATBD_V4.4.pdf
See all pages that use this dataset -
Hurricane Tracks (Automated Tropical Cyclone Forecast (ATCF) - Best Track)
ID: 1109Credit: NOAA
This dataset can be found at: https://ftp.nhc.noaa.gov/atcf/
See all pages that use this dataset
Note: While we identify the data sets used on this page, we do not store any further details, nor the data sets themselves on our site.

