2016 Sea Ice Minimum Live Shots
Arctic Sea Ice Live Shot Roll-Ins
Arctic Sea Ice Trending Low After Record 2016 Heat
NASA Scientists Available August 19 To Show New Views Of The Arctic During Summer Melt Season
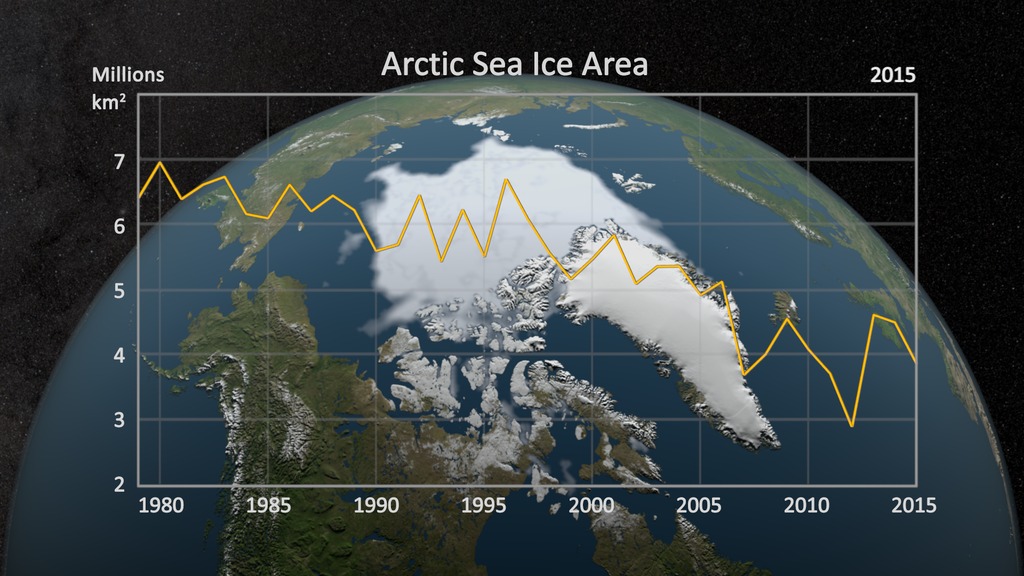
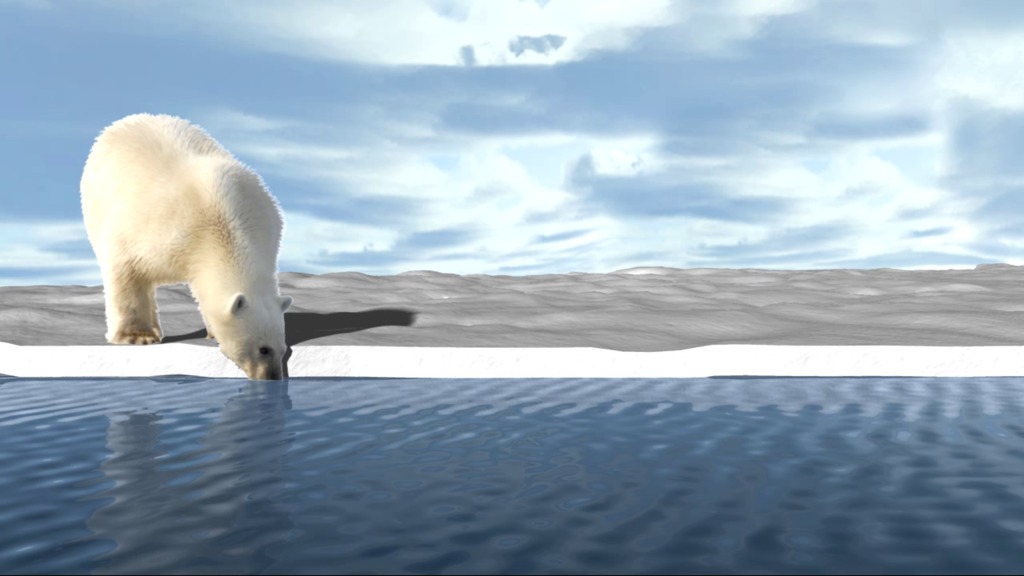
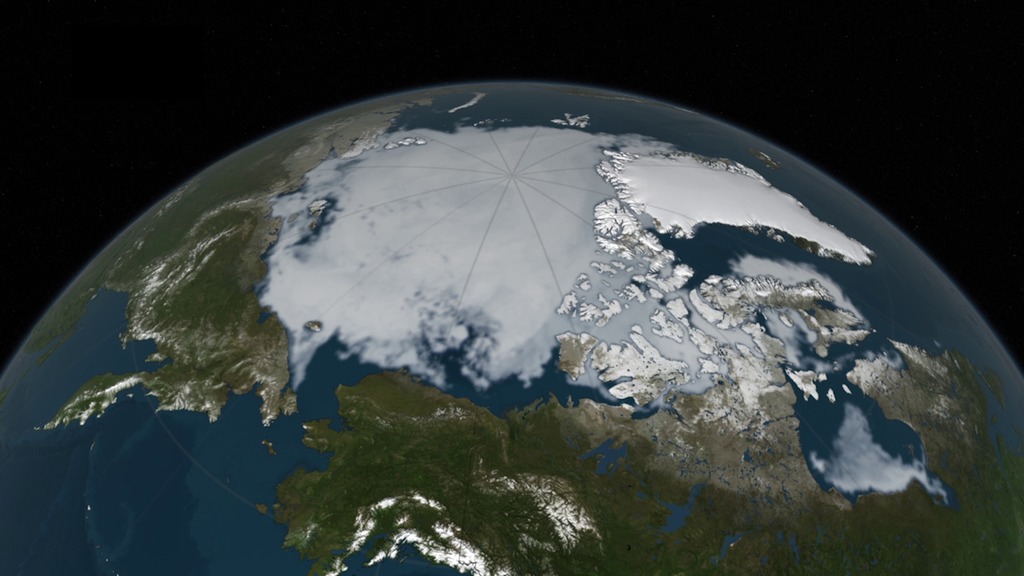
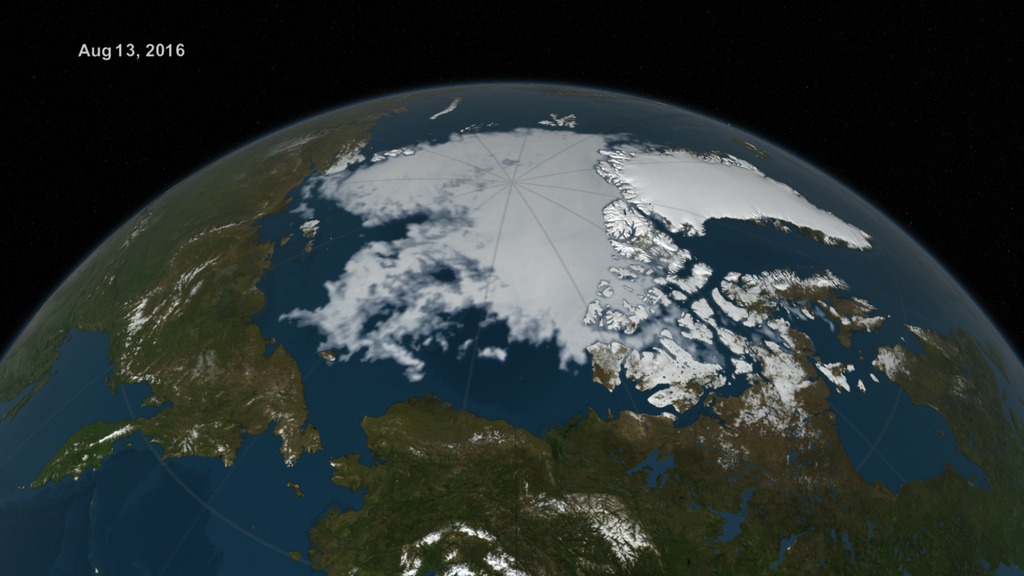
Record-breaking temperatures in the first half of 2016 have primed the Arctic for another summer of low sea ice cover. Sea ice is frozen ocean water around the polar caps that, in the winter thickens and grows and in the summer thins and decreases. Arctic sea ice is important because it reflects sunlight and keeps the Arctic region cool. Over the past three decades, Arctic sea ice has dramatically declined; making what was once extraordinary low measurements the new normal.
Join NASA scientists on Friday August 19th from 6:00 a.m. – 11:30 a.m. EDT to show your viewers new images from the Arctic, and talk about how the polar region is fairing this summer, and how long-term changes in this region could affect the way we live in the U.S.
The Arctic is Earth’s air conditioner and it helps regulate global temperatures. But the region is warming twice as fast as elsewhere in the world, making the Arctic one of the most visible signs of a changing planet.
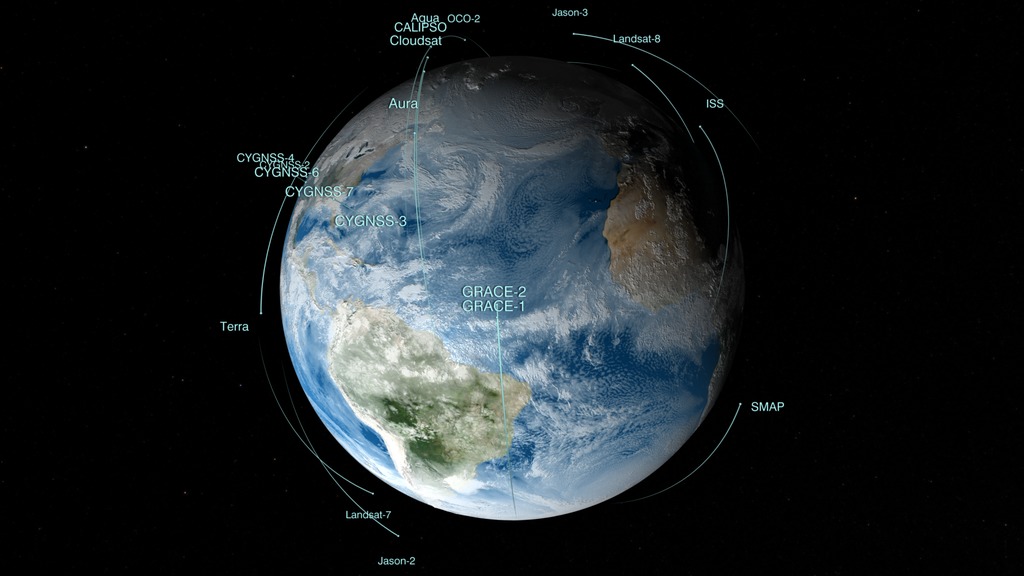
NASA is keeping a close eye on changing conditions in the Arctic with its satellites, airborne and ground campaigns that are measuring the polar sea ice. Scientists are also monitoring the ice sheets that sit on land that are also melting at increasing rates. In 2018 NASA will launch the ICESat-2 satellite that will make some of the most advanced measurements of the polar regions ever.
** To book a window ** Michelle Handleman/ michelle.z.handleman@nasa.gov / 301-286-0918 work
HD Satellite Coordinates for AMC9-K17/Slot AB (18MHz): AMC-9 Ku-band Xp 17 Slot AB| 83.0 ° W Longitude | DL 12045.0 MHz | Horizontal Polarity | QPSK/DVB-S | FEC 3/4 | SR 13.235 Mbps | DR 18.2954 MHz | HD 720p | Format MPEG2 | Chroma Level 4:2:0 | Audio Embedded
Suggested Questions:
1. Globally it’s been the warmest year on record. What do the latest images show us about this year’s summer in the Arctic?
2. What is sea ice and why is it important to the Arctic and the Earth as a whole?
3. Do you think we’ll ever see an ice-free Arctic?
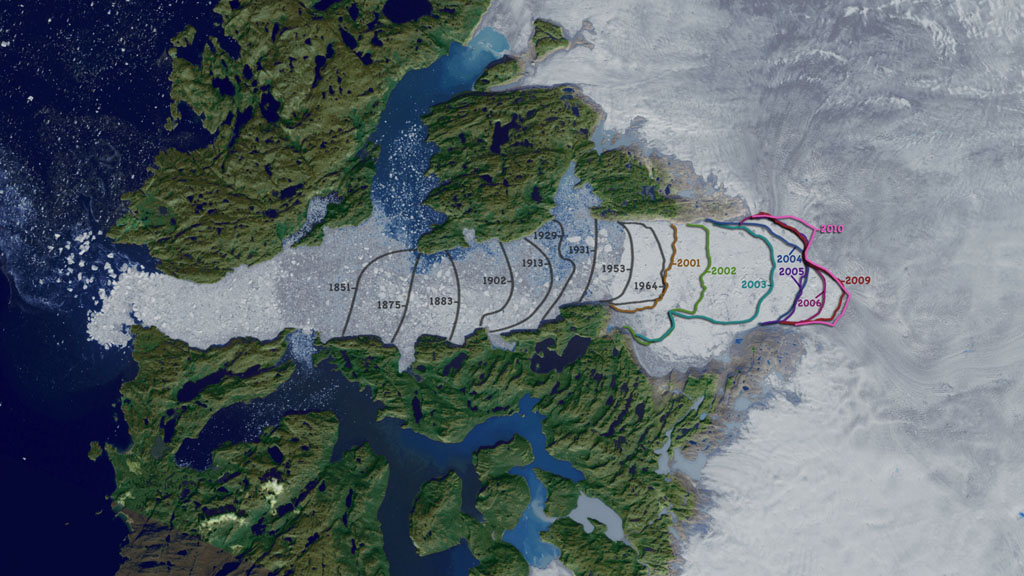
4. What about the rest of the Arctic – aren’t we seeing changes in Greenland, too?
5. Where can we learn more?
Live Shot Details:
Location: NASA’s Goddard Space Flight Center/Greenbelt, Maryland
Scientists:
• Dr. Walt Meier / NASA Scientist
• Dr. Tom Wagner / NASA Cryosphere Program Manager
• Dr. Carlos Del Castillo / NASA Scientist [Interviews in Spanish]
Video: NASA will roll all insert videos during live interviews. If needed, stations can roll a clean feed of all video at 5:45 a.m. EDT on August 18, 2016, at the above listed satellite.
Canned interviews and b-roll will be available starting August 18 at 6:00 p.m. EDT
On Twitter @NASAEarth

July 2016 was the warmest July in 136 years of modern record-keeping, according to a monthly analysis of global temperatures by scientists at NASA’s Goddard Institute for Space Studies (GISS) in New York.
Because the seasonal temperature cycle peaks in July, it means July 2016 also was warmer than any other month on record. It wasn't by the widest of margins, but July 2016 was the warmest month since modern record keeping began in 1880,” said GISS Director Gavin Schmidt.
This graph shows the temperature anomalies around the globe for the month of July 2016. For each area in the graph, the average temperature for July 2016 was compared to the average temperature of all Julys during the years 1951 to 1980.
For more information, go to http://data.giss.nasa.gov/gistemp/news/20160816/
Canned interview with NASA Scientist Dr. Walt Meier. TEXT is available for download. He answers the following questions:
What's happening this year.
What is sea ice and why is it important
Will we ever see an ice-free summer in the Arctic
Aren't we seeing changes in Greenland too
Update on August Arctic cyclone
Where can we learn more
NASA Scientist Dr. Walt Meier
Social Spot with NASA Scientist Dr. Eric Brown de Colstoun (in Spanish)
NASA Scientist Dr. Eric Brown de Colstoun (in Spanish)
Social media promo with Dr. Walt Meier.
For More Information
See nasa.gov/Earth
Credits
Please give credit for this item to:
NASA's Goddard Space Flight Center
-
Producer
- Michelle Handleman (USRA)
-
Editor
- Rich Melnick (HTSI)
Release date
This page was originally published on Monday, August 15, 2016.
This page was last updated on Wednesday, May 3, 2023 at 1:48 PM EDT.
Missions
This page is related to the following missions:- Deep Space Climate Observatory (DSCOVR)
- Gravity Recovery and Climate Experiment (GRACE)
- Gravity Recovery and Climate Experiment Follow-on (GRACE-FO)
- Ice, Cloud, and land Elevation Satellite (ICESat)
- Ice, Cloud, and land Elevation Satellite-2 (ICESat-2)
- Operation IceBridge
- Solar Radiation and Climate Experiment (SORCE)
![Two key climate change indicators have broken numerous records through the first half of 2016, according to NASA analyses of ground-based observations and satellite data. Each of the first six months of 2016 set a record as the warmest respective month globally in the modern temperature record, which dates to 1880. Meanwhile, five of the first six months set records for the smallest monthly Arctic sea ice extent since consistent satellite records began in 1979. NASA researchers are in the field this summer, collecting data to better understand our changing climate.Music: Hidden Files by Sam Dodson [PRS]](/vis/a010000/a012300/a012306/12306_climate_2016_large.00071_print.jpg)
